Submitted Successfully!
To reward your contribution, here is a gift for you: A free trial for our video production service.
Thank you for your contribution! You can also upload a video entry or images related to this topic.
Version Summary Created by Modification Content Size Created at Operation
1 + 1366 word(s) 1366 2022-01-07 04:59:25 |
2 The format is correct. Meta information modification 1366 2022-01-12 04:28:47 |

Video Upload Options

Do you have a full video?

Confirm

Are you sure to Delete?
Cite
If you have any further questions, please contact Encyclopedia Editorial Office.
Zaknic-Catovic, A. Diurnal Extrema Timing—A New Climatological Parameter. Encyclopedia. Available online: https://encyclopedia.pub/entry/18091 (accessed on 25 July 2024).
Zaknic-Catovic A. Diurnal Extrema Timing—A New Climatological Parameter. Encyclopedia. Available at: https://encyclopedia.pub/entry/18091. Accessed July 25, 2024.
Zaknic-Catovic, Ana. "Diurnal Extrema Timing—A New Climatological Parameter" Encyclopedia, https://encyclopedia.pub/entry/18091 (accessed July 25, 2024).
Zaknic-Catovic, A. (2022, January 11). Diurnal Extrema Timing—A New Climatological Parameter. In Encyclopedia. https://encyclopedia.pub/entry/18091
Zaknic-Catovic, Ana. "Diurnal Extrema Timing—A New Climatological Parameter." Encyclopedia. Web. 11 January, 2022.
Diurnal Extrema Timing—A New Climatological Parameter
Edit

Diurnal Extrema Timing (DET) are daily occurrence times of air temperature minimum and maximum. Although unrecognized and unrecorded as a meteorological variable, the exact timing of daily temperature extrema plays a crucial role in the characterization of air temperature variability. The results reveal the timing of daily air temperature maximum as the most vulnerable to climate change among temperature and timing extrema indices.

air temperature climate change daily temperature extrema extrema timing temperature variability trend analysis

1. Introduction

The importance of accurate identification of daily extrema for climatological analysis and various scientific operations cannot be overstated. Due to the common absence of long-term high-frequency air temperature observations, daily extrema are often the only available choice for climate analysis. Consequently, the authenticity of air temperature trend analysis and daily mean calculation is often entirely dependent on the accuracy of daily extrema [1][2][3][4].

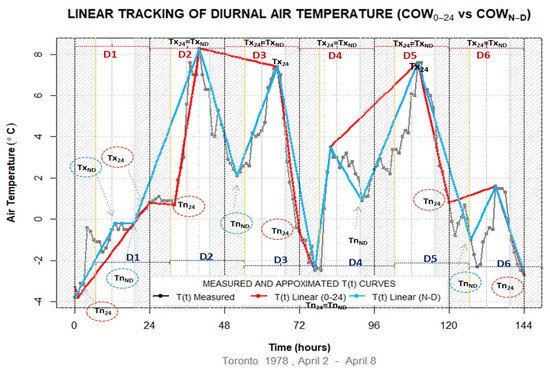
Identification of daily temperature extrema is further aggravated by various factors, inducing observational and physical inhomogeneities to the extrema time series. On one hand, the effects of changes in instrumental sampling rates and average processing algorithms, that are based on instantaneous values of meteorological variables, are a large cause of uncertainty and bias in daily extrema reporting [5][6]. On the other hand, a disregard for the physical heterogeneity of temperature time series is a concealed cause of improper extrema definition [7]. The physical nature of daily temperature extrema, distinguishable based on the timing span between minima and maxima, is systematically disregarded due to the absence of the timing observation of daily extrema. Furthermore, the interpretation and reconstruction of air temperature variability, based solely on daily extrema, rest on the knowledge of daily extrema timing. As a result, diurnal extrema timing plays a crucial role in the calculation of areas under the temperature curve for the estimation of air temperature-related quantities using degree-day formulae [8].

Numerous scientific efforts to generate diurnal temperature wave, based exclusively on daily extrema, witness the lack of important temporal information necessary for the recreation of daily temperature variability. Various algorithms for the generation of hourly temperature values using daily minimum, maximum, and mean of daily extrema extend beyond the domain of climatological use [9][10][11]. The information when the derivative of the daily temperature curve changes its sign is critically important for a wide range of scientific applications. Diurnal extrema timing is necessary for the improvement of air, soil, and water temperature modeling, civil engineering building simulation programs, calculating chilling units and chill hours for agricultural applications, and other degree-day estimations [12][13][14][15][16][17][18][19][20].

1.1. Definition of Air Temperature Extrema

The diurnal extremum point of a continuous temperature-time function is defined as a set of air temperature–time coordinates (t, T) with Diurnal Extrema Timing (DET) as the x-coordinate, and air temperature value of the extremum point being the y-coordinate. Obtaining daily temperature extrema for various climatological applications is considered a common task. However, routine extrema search does not necessarily yield the intended information, i.e., a diurnal pair of mathematical extrema. Mathematical air temperature extrema are the points on a temperature-time curve in which the daily temperature trend changes its sign, and the derivative of temperature function equals zero. Due to the lack of means for determining Diurnal Mathematical Extrema (DME) in practice, one naturally resorts to discrete methods for identifying the smallest and the largest value of temperature over a 24-h search period. The discrete extrema search applied on a calendar-based scale often omits the true temperature extrema and instead identifies the endpoints of the search period. Diurnal Endpoint Extrema (DEE) are the highest and the lowest identified temperature points found at the start or at the end of a time discretization interval for extrema search.

1.2. Calendar Day vs. Climatological Day for Extrema Observations

A climatological day is the extent of the observational day used to identify extrema that are reflective of air temperature variation. Yet, the climatological day presently in use frequently reaches out of the bounds of a 24-h period in attempts to capture the true extrema. For meteorological sites in Canada reporting two daily observations of temperature extrema, the operational definition of a daily air temperature minimum and maximum differs from the calendar day definition that applies only to sites reporting extrema once per day. The reason for the development of the climatological day in place of a calendar day was to improve the capturing of true “peaks and lows” of periodic temperature variation [21].

1.3. Climatological Observing Window

A climatological observing window (COW) is a time frame over which continuous or extreme air temperature measurements are collected. A fixed 0–24 h observing window, (COW0–24), potentially leads to misidentification of minima due to fragmentation of the nighttime into two subsequent segments caused by the time discretization interval [22]. As a result, some identified diurnal minima do not conform with the definition of the DME. Systematic fragmentation of the nighttime period, caused by the rigidity of the COW0–24 search window’s position, is further magnified by the inconsistency of applying a COW indifferent to latitude and season of temperature observing location. However, correct identification of diurnal temperature extrema is achievable using a COW that identifies a minimum over a nighttime period and a maximum over a daytime period, per sunrise and sunset times. The Climatological Observing Window Night and Day (COWN–D) aims to identify the true turning points of the air temperature-time function. A randomly selected measured air temperature interval presented in Figure 1 contrasts the performance of COW0–24 and COWN–D extrema identification methods in air temperature tracking. Linear temperature tracking refers to the approximation of hourly temperatures between daily extrema points for the validation of extrema identification methods. 
Figure 1. Comparison of COW0–24 and COWN–D observing windows. Linear temperature tracking highlights the effect of the choice of a diurnal observing window on the accuracy of temperature extrema identification. Gray solid lines represent measured hourly temperature, while red and blue lines correspond to linearly interpolated temperatures based on COW0–24 and COWN–D extrema. Hatched areas represent the duration of nighttime, while vertical yellow lines indicate sunrise. The COW0–24 days extend between consecutive midnights (vertical black dotted lines), while COWN–D days extend between consecutive sunrises (vertical solid yellow lines).

2. Findings

Improved characterization of diurnal air temperature minima and identification of extrema timing is essential for gaining insight into the timing shifts of nighttime and daytime extrema populations. It is suggested that shifts in annually-averaged extrema timing, consistent with temperature shifts, reveal changes to the climate system when daily extrema are identified using Climatological Observing Window Night and Day.
Climate Parameter Sensitivity Index used to assess the susceptibility of temperature and timing parameters, identified the timing parameter as more prone to climate change than the temperature itself.
Apart from positive trends in the timing parameter referring to temperature increase, the abrupt changes in this parameter point to the intensification of large-scale oscillation phases influencing temperature and timing trends.
An in-depth evaluation of seasonal trends, time shifts, and sensitivity of the diurnal extrema timing parameter is recommended. Additional research is necessary to expand on the correlation of interannual variation of the timing parameter with low-frequency modes of atmospheric-oceanic variability influencing the Canadian climate [23][24]. A study of the variability of diurnal extrema timing parameter with fog frequency is also suggested. In view of the fact that a variation in observing window significantly affects temperature minima, further study of diurnal temperature asymmetries [25] and changes in air mass frequency [26] would be beneficial.
Given the necessity of extrema timing for the analysis of air temperature patterns, the systematic recording of this parameter is highly encouraged [7].

3. Conclusions

Systematic bias in air temperature extrema, associated with the traditional observing window, is identified across all examined temperature extrema series. Further, substantial positive time shifts in annual averages of Diurnal Extrema Timing parameter are observed at all stations. Lastly, the Climate Parameter Sensitivity Index analysis ranks the annual After Noon Maxima timing as the most vulnerable to climate change among temperature and timing indices.
The results indicate that turning points of daily air temperature function carry vital climatological information. Therefore, a change in the observing window is proposed for the identification of daily mathematical extrema with temperature and time coordinates. The information on daily minima and maxima timing are fundamental for the analysis of extrema time series and the development of algorithmic tools in climate analysis. 

References

  1. Bonacci, O.; Željković, I.; Trogrlić, R.Š.; Milković, J. Differences between true mean, daily, monthly and annual air temperatures and air temperatures calculated with three equations: A case from three Croatian stations. Theor. Appl. Clim. 2013, 114, 271–279.
  2. Allen, S.M.J.; Gough, W.A.; Mohsin, T. Changes in the frequency of extreme temperature records for Toronto, Ontario, Canada. Theor. Appl. Clim. 2015, 119, 481–491.
  3. Wang, K.C. Sampling biases in datasets of historical mean air temperature over land. Sci. Rep. 2014, 4, 4637.
  4. Schaal, L.A.; Dale, R.F. Time of observation temperature bias and “climatic change”. J. Appl. Meteorol. 1977, 16, 215–222.
  5. Gough, W.A.; Žaknić-Ćatović, A.; Zajch, A. Sampling frequency of climate data for the determination of daily temperature and daily temperature extrema. Int. J. Clim. 2020, 40, 5451–5463.
  6. Lin, X.; Hubbard, K.G. What are daily maximum and minimum temperatures in observed climatology? Int. J. Clim. 2008, 28, 283–294.
  7. Žaknić-Ćatović, A.; Gough, W.A. Identification of radiative and advective populations in Canadian temperature time series using the Linear Pattern Discrimination algorithm. Int. J. Clim. 2021, 41, 5100–5124.
  8. Žaknić-Ćatović, A.; Howard, K.W.F.; Ćatović, Z. Modification of the degree-day formula for diurnal meltwater generation and refreezing. Theor. Appl. Clim. 2018, 131, 1157–1171.
  9. Chow, D.H.C.; Levermore, G.J. New algorithm for generating hourly temperature values using daily maximum, minimum and average values from climate models. Build. Serv. Eng. Res. Technol. 2007, 28, 237–248.
  10. Magnano, L.; Boland, J.W.; Hyndman, R.J. Generation of synthetic sequences of half-hourly temperatures. Environmetrics 2008, 19, 818–835.
  11. Parton, W.J.; Logan, J.A. A model for diurnal variation in soil and air temperature. Agric. Meteorol. 1981, 23, 205–216.
  12. Watanabe, N. An improved method for computing heat accumulation from daily maximum and minimum temperatures. Appl. Entomol. Zool. 1978, 13, 44–46.
  13. Floyd, B.R.; Braddock, R.D. A simple method for fitting average diurnal temperature curves. Agric. For. Meteorol. 1984, 32, 107–1194.
  14. Wann, M.; Yen, D.; Gold, H.J. Evaluation and calibration of three models for daily cycle of air temperature. Agric. For. Meteorol. 1985, 34, 121–128.
  15. Linvill, D.E. Calculating chilling hours and chill units from daily maximum and minimum temperature observations. Hort Sci. 1990, 25, 14–16.
  16. Sadler, J.E.; Schroll, R.E. An empirical model of diurnal temperature patterns. Agron. J. 1997, 89, 542–548.
  17. Dall’Amico, M.; Hornsteiner, M. A simple method for estimating daily and monthly mean temperatures from daily minima and maxima. Int. J. Clim. 2006, 26, 1929–1936.
  18. Besson, F.; Bazile, E.; Soci, C.; Soubeyroux, J.-M.; Ouzeau, G.; Perrin, M. Diurnal temperature cycle deduced from extreme daily temperatures and impact over a surface reanalysis system. Adv. Sci. Res. 2015, 12, 137–140.
  19. Hansen, J.E. A mathematical model for the generation of hourly temperatures. J. Appl. Meteorol. 1962, 16, 935–948.
  20. Allen, J.C. A modified sine wave method for calculating degree-days. Environ. Entomol. 1976, 5, 388–396.
  21. Government of Canada. About the Data. Available online: https://climate.weather.gc.ca/about_the_data_index_e.html (accessed on 15 September 2021).
  22. Žaknić-Ćatović, A.; Gough, W.A. A comparison of climatological observing windows and their impact on detecting daily temperature extrema. Theor. Appl. Clim. 2018, 132, 41–54.
  23. Bonsal, B.; Shabbar, A. Large-Scale Climate Oscillations Influencing Canada, 1900-2008. Canadian Biodiversity: Ecosystem Status and Trends 2010. Technical Thematic Report No.4; Canadian Councils of Resource Ministers: Ottawa, ON, Canada, 2011; Available online: http://www.biodivcanada.ca/default.asp?lang=En&n=137E1147-0 (accessed on 15 September 2021).
  24. Vincent, L.A.; Zhang, X.; Brown, R.D.; Feng, Y.; Mekis, E.; Milewska, E.J.; Wan, H.; Wang, X.L. Observed trends in Canada’s climate and influence of low-frequency variability modes. J. Clim. 2015, 28, 4545–4560.
  25. Gough, W.A.; He, D. Diurnal temperature asymmetries and fog at Churchill, Manitoba. Theor. Appl. Clim. 2015, 121, 113–119.
  26. Leung, A.; Gough, W.A. Air mass distribution and the heterogeneity of the climate change signal in the Hudson Bay/Foxe Basin region, Canada. Theor. Appl. Clim. 2016, 125, 583–592.
More
Information
Contributor MDPI registered users' name will be linked to their SciProfiles pages. To register with us, please refer to https://encyclopedia.pub/register :
View Times: 550
Entry Collection: Environmental Sciences
Revisions: 2 times (View History)
Update Date: 12 Jan 2022
1000/1000
Video Production Service