Submitted Successfully!
To reward your contribution, here is a gift for you: A free trial for our video production service.
Thank you for your contribution! You can also upload a video entry or images related to this topic.
Version Summary Created by Modification Content Size Created at Operation
1 + 2797 word(s) 2797 2022-01-04 10:38:19 |
2 The format is correct + 28 word(s) 2825 2022-01-05 03:56:48 |

Video Upload Options

Do you have a full video?

Confirm

Are you sure to Delete?
Cite
If you have any further questions, please contact Encyclopedia Editorial Office.
Rahman, D.M. Reactive Nitrogen Flows in Bangladesh’s Agriculture Sector. Encyclopedia. Available online: https://encyclopedia.pub/entry/17754 (accessed on 04 May 2024).
Rahman DM. Reactive Nitrogen Flows in Bangladesh’s Agriculture Sector. Encyclopedia. Available at: https://encyclopedia.pub/entry/17754. Accessed May 04, 2024.
Rahman, Dr. Mizanur. "Reactive Nitrogen Flows in Bangladesh’s Agriculture Sector" Encyclopedia, https://encyclopedia.pub/entry/17754 (accessed May 04, 2024).
Rahman, D.M. (2022, January 05). Reactive Nitrogen Flows in Bangladesh’s Agriculture Sector. In Encyclopedia. https://encyclopedia.pub/entry/17754
Rahman, Dr. Mizanur. "Reactive Nitrogen Flows in Bangladesh’s Agriculture Sector." Encyclopedia. Web. 05 January, 2022.
Reactive Nitrogen Flows in Bangladesh’s Agriculture Sector
Edit

Nitrogen (N) fertilizer use is the largest in the crop sector, an important sector, where current annual consumption is 1190 Gg. The present combined annual Nr production from crop, fishery, and livestock sectors is ~600 Gg, while emissions of nitrous oxide (N2O), a potent greenhouse gas, are ~200 Gg. Poor N management results in Nr leaking into the environment, which has increased approximately 16-fold since 1961. One potential consequence is the disruption of ecosystem functioning. The balanced tradeoff between food production and reducing Nr input needs to be achieved. One solution to reducing unutilized reactive N (Nr) may be a holistic approach that optimizes N application rates and incorporates waste of one subsector as an input to another applying the principle of the circular economy. 

isheries livestock sectors N2O manure sustainable N management

1. Introduction

Nitrogen (N) is an essential nutrient for all life forms and the ultimate resource for food production. Molecular nitrogen (N2) is plentiful in the atmosphere but is unreactive [1]. To make it available for plants and animals, it needs to be transformed into reactive forms such as ammonia (NH3), nitrate (NO3), nitrogen oxides (NOx), nitrous oxide (N2O), amines, and other organic forms of N [2]. During the green revolution, the dramatic advances in inorganic fertilizer production and application to crop fields have contributed to increasing agricultural productivity, ensuring food security for the ever-expanding global population [3][4]. However, the excessive use of inorganic N fertilizer in agriculture, accompanied by reactive N (Nr) production, is threatening the sustainability of both crop production and the environment [5][6][7]. Nr is produced in the environment by lightning, wildfires, biological N2 fixation (BNF), and use of applied organic and inorganic fertilizers to crop fields. It is also produced through the burning of fossil fuels, which leads to the formation of NOx in the atmosphere. UNEP and WHRC [8] reported that in the last 150 years, the contribution of Nr from the agriculture, industry, and transport sectors to the atmosphere, soils, and water bodies has increased more than 10-fold annually. N fertilizer is applied to fields to increase crop yields. However, a considerable amount of Nr is not used by the crops and is instead lost from soil through different biological and abiotic processes.
Bangladesh’s economy is largely dependent on agriculture; the share of agriculture in Bangladesh’s gross domestic product (GDP) was 12.65% in 2020 [9]. In Bangladesh, agricultural land occupies 70.6% of the total land area, with total cultivable land covering 8.5 million ha [10]. As agricultural growth is essential to feed its huge population, Bangladesh is one of the most climate-vulnerable countries in the world [11]. Hence, increasing production from different agricultural sectors under a changing climate has become a serious challenge for Bangladesh. About 82,900 ha of agricultural land is lost every year because of new settlements, industrialization, road construction, and other developmental works, exerting tremendous pressure on limited land resources to produce more food for the increasing population [12]. In 1971, the population of Bangladesh was only 75 million, which increased to 81.36 million in 1980, and the current population stands at 166.01 million [13]. In 1980–1981, the food grain production in Bangladesh was only 15 Mt; by 2016–17, it increased to 55 Mt [10], representing a 267% increase and indicating a significant positive effect of modern technologies, including high N-fertilizer use, on increasing production from 0.20 Mt in 1960–1961 to 1.12 Mt in 2018–2019.
The fisheries sector plays a vital role in Bangladesh in terms of nutritional security, supplying over 60% of animal protein contributing 3.8% to the country’s GDP [14]. The country has diverse and extensive fisheries resources, comprising capture fishery and aquaculture, both freshwater and marine. Inland aquaculture contributes 83.7% of the total fishery production in Bangladesh [15]. Bangladesh is the fifth largest aquaculture producer in the world, and the country’s farmed fish production increased 1.78 times from 0.79 Mt in 2001–2002 to 2.2 Mt in 2017–2018 [10][16]. This increased fish production is largely supported by the applications of fertilizer and supplementary feed as inputs to the pond systems in freshwater aquaculture. Reportedly, only 10–30% of the applied feed N is utilized by fish and the residual 70–90% remains in the pond systems, becoming a potential source of gaseous losses to the environment in the form of NH3 and nitrogen dioxide (NO2) [17].
Livestock is another vital sector of the rural economy in Bangladesh. It accounts for 14.1% of the agricultural GDP and 2.6% of the country’s GDP [18][19]. Chemical N fertilizer and animal manure are used for fodder production. Animal manure contains a large amount of N [20]. The annual fresh manure production in Bangladesh from ruminants and poultry is 151.3 and 4.5 Mt, respectively, which contribute a total of 0.296 Mt of N [21]. Animal manure may release substantial amounts of NH3, N2O, and NO to the environment during manure management and application to crop fields [22]. Conversely, animal manure, if applied to agricultural fields, might improve soil health and crop productivity. However, manure management in Bangladesh is traditional (mainly without manure treatment) and manure heaps might therefore act as a hotspot source of Nr in the environment.
Intensive cultivation practices with inorganic fertilizers cause environmental pollution and soil health degradation [23]. Globally, the N use efficiency, expressed as the ratio of N uptake to N applied, also called the apparent recovery efficiency, is only around ~20%, so 80% of the N in applied fertilizer is lost to the environment, equating to an annual loss of USD 200 billion [24]. In Bangladesh, traditionally, N fertilizer is broadcasted, an about 65–70% of the applied N is lost [25]. Such excess Nr reduces the quality of soil, water, and air; increases GHG emissions; degrades the ecosystems; and reduces biodiversity, significantly altering the global N budget, and ultimately affecting the global climate [1][26][27].
It is crucial to reduce Nr losses through sustainable N management that encompasses policy guidelines, social awareness, and execution in farmers’ fields. To reach this goal, information is required on how much Nr is produced in Bangladesh from field agriculture, aquaculture, and livestock sectors, which is currently not available in the scientific literature. Moreover, to develop strategies for the effective use of N fertilizers in agricultural sectors, it is crucial to quantify the extent of Nr losses. 

2. Reactive Nitrogen Flows in Bangladesh’s Agriculture Sector 

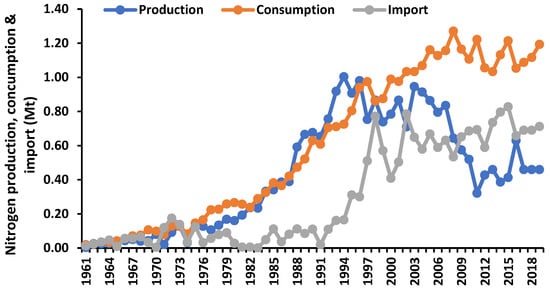
2.1. Nitrogen Fertilizer Consumption, Production, and Import in Bangladesh

Nitrogen consumption in Bangladesh was only 20,000 t in 1961, increasing to 1.27 Mt in 2008, and then decreasing to 1.19 Mt in 2019 (Figure 1). However, N fertilizer consumption in the country increased from 1961 to 2019 to increase food production (Figure 1).
Figure 1. Trends in N production, consumption, import, and excess or deficit in Bangladesh since 1960–1965 to 2015–2019. Data compiled from different sources [20][28][29][30].
The major crops of Bangladesh are rice, wheat, maize, and potato. Rice was grown on 11.05 Mha of land in 2016–1207, and the total cropped area was 15.44 Mha [10] (Figure 2). This appears to be the maximum use of the country’s agricultural land available for rice production, which ultimately contributed to a significant increase in rice production of about 34 Mt (Figure 2). This increased crop production resulted in an increase in N consumption (Figure 1).
Figure 2. Major crops, area, production, and their yields in 2016–2017 in Bangladesh [10].
Rice production might have to be increased further to meet the increasing food demand of the growing population by using higher rates of N, P, K, and other fertilizers, and adopting pest management practices. According to the Bangladesh Unnayan Onneshan think-tank [31], the present requirement of urea for rice is 2.45 Mt; in 2050, the projected urea fertilizer requirement is 3.92 Mt (Figure 3a). The projected N demand for rice from 2007 to 2050 follows a linear trend. Among the three types of rice, urea consumption is the lowest in aus rice (pre-monsoon summer rice) and the highest in boro (dry season irrigated rice), whereas for the transplanted aman rice (monsoon rice), the requirement is almost as high as for boro rice [20]. The global N use as a percentage of N fertilizer demand was 9.5% in 2018 [32]. The N content in most of the soils of Bangladesh is low to medium [20]. Therefore, a large amount of inorganic N fertilizer is applied to bridge the gap between existing levels and the plants’ requirements to increase crop production. The amount of ammonium N (NH4+-N) and nitrate N (NO3-N) in agricultural soils in Bangladesh varies from 5.1–21.2 and 2.6–5.6 mg kg−1, respectively, [33], necessitating replenishing these nutrients from other sources such as inorganic fertilizers and manure. However, N undergoes several transformations in the soil and crop environments that result in loss of the N that cannot be taken up by the crop via the hydrosphere, atmosphere, and soil [34]. The loss of N from agricultural land is high in tropical and subtropical countries such as Bangladesh [35]. Hence, despite intensive cropping with modern crop varieties and the use of mostly inorganic fertilizers, N use efficiency in Bangladesh is declining. The apparent recovery efficiency of N in rice in the country remains almost constant, ranging from 25–30%, with marginally higher rates in boro rice since 2007 to date and for predictions for 2050 (Figure 3b). Due to intensive cropping and the associated mining of nutrients, the contribution of the soil to the nutrients supply or crop productivity is also declining. Such plateauing of yield is of concern for future food security in Bangladesh. As a result, a higher amount of N fertilizers is being used by the farmers in order to maintain similar rice yields. Application of inorganic N fertilizer in agriculture is essential to meet global food, feed, and fiber needs [36]. At the same time, fertilizer efficiency also needs to be increased by adopting various soil and crop management activities. In various research stations in Bangladesh, the apparent recovery efficiencies of N for the major crops, viz. rice, wheat, maize, and potato, are 48%, 62%, 26%, and 58%, respectively, and agronomic efficiencies are 37, 40, 17, and 110 kg kg−1, respectively (Figure 4). However, N use efficiencies are generally much lower in the farmers’ fields because of poor N management and the imbalanced use of fertilizers (Figure 3b). Therefore, there is room to increase N use efficiency, particularly in farmers’ fields.
Figure 3. Present and future N demand (a), and its apparent recovery efficiency (b) in rice production in Bangladesh. Produced using data from different sources [20][37][38][31].
Figure 4. Apparent recovery and agronomic efficiency of N fertilizer of major crops in Bangladesh.

2.2. Reactive N (Nr) Production in Bangladesh’s Agriculture

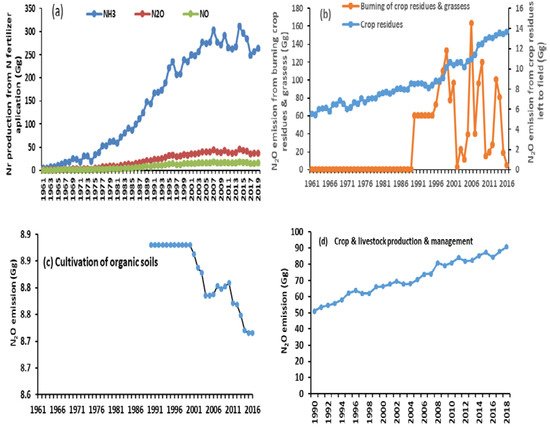
Significant proportions of N fertilizer applied for crop production are subject to loss to the atmosphere. The release of Nr from N fertilizer as NH3, N2O, and NO in Bangladesh since 1961 to 2019 has increased dramatically (Figure 5a). From 1961 to 2019, emissions of NH3, N2O, and NO from N fertilizer increased from 4.72 to 263.45, 0.68 to 37.95, and from 0.28 to 15.65 Gg, respectively. This magnitude of loss of Nr from inorganic N fertilizer is of serious concern for agricultural and environmental sustainability. Production of Nr and its losses to the environment have increased in recent years mostly because of higher rates of N fertilizer application coupled with low use efficiency.

Figure 5. Reactive N (Nr) production in Bangladesh: (a) N fertilizer application, (b) crop residues, burning crop residues and grasses, (c) cultivation of organic soils, and (d) crop and livestock production and management. Raw data for (ac) were taken from FAOSTAT [28] and IFASTAT [30], and for (d) from Climatewatch [39].
There was a noticeable loss of N2O because of crop residue management and burning of crop residues and grasses in Bangladesh from 1961 to 2016 (Figure 5b). Residues incorporation into crop fields contributed to 5.56 and 13.70 Gg of N2O in 1961 and 2016, respectively. On-site burning of crop residues and grasses showed similar emission rates of N2O from 1961 to 1989 (0.35 to 0.44 Gg), then increased to a peak of 163.64 Gg in 2006, and decreased to 5.24 Gg in 2016 (Figure 5b). The likely reason for this is higher rates of burning during 1990 to 2006, before an awareness program was launched encouraging farmers not to burn residues. Cultivation of organic soils decreased N2O emissions in croplands from 8.88 Gg in 1990 to 8.71 Gg in 2016 (Figure 5c). Better management of organic matter, soils, and crops might be the cause of slowing rates of N2O emissions from the cultivation of organic soils. Furthermore, decomposition of organic soil might have reduced as N was taken up by microorganisms. N lost as N2O from most of the agricultural activities increased substantially from 1961 to 2016. Data obtained from Climatewatch showed that N2O emissions from crop and livestock production and management activities almost doubled from 50.97 to 90.73 Gg during the period of 1990 to 2018 (Figure 5d).
Losses of Nr as NH3, N2O, and NO from inorganic fertilizers, management of crop residues, and burning of crop residues and grasses are based on various assumptions and factors; however, the available numbers confirm a substantial release of Nr from crop agriculture. The agriculture sector of Bangladesh, comprising crop and livestock production and management, contributed 88.5 Mt CO2e of non-CO2 GHG emissions in 2018 and contributed the most (44.49%) compared to the energy, waste, and industrial process sectors (Figure 6). N fertilizers are necessary to feed the population, but excess Nr from agriculture can severely pollute the environment, as discussed above.
Figure 6. Non-CO2 GHG emission from crop and livestock production and management in Bangladesh in 2018. Raw data were obtained from Climatewatch [39].

2.3. Nitrogen Use and Nr Production in Aquaculture

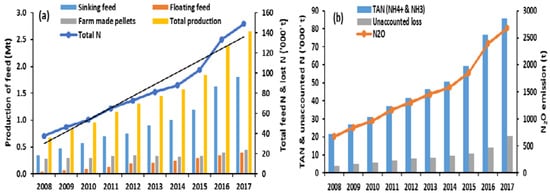
Fish provide 60% of the animal protein to the people of Bangladesh [40]. During the recent decades, aquaculture ventures have increased and intensified. The shift from low-input, extensive systems to high-input, intensive aquaculture systems has resulted in a huge demand for fish feed. Total feed production for pond aquaculture in 2008 was only 0.67 Mt, which increased 400 times to 2.66 Mt in 2017 (Figure 7a). Total feed comprises sinking, floating, and farm-made feeds, which contributed a total of 37,520 t of N in 2008, increasing to 148,960 t in 2017. Mamun-Ur-Rashid et al. [41] reported that the production and sale of fish feed in Bangladesh’s aquaculture have increased radically in the last decade, where about 1.04 Mt of feed was produced commercially and between 0.3 and 0.4 Mt was produced at th village level with additional imports needed. Actual feed requirements are higher than local production. Raw unformulated feeds such as rice bran and mustard oil cake are applied to fishponds. Farmers in Bangladesh apply 1000 t of raw and unprocessed feed in their ponds annually [42]. This is included in farm-made feed in Figure 7a. Mamun-Ur-Rashid et al. [41] also reported that, since 2008, feed production has increased by 32% annually to approximately 3.0 Mt in 2017. Other data led to a fish feed requirement estimation of 2.65 Mt in 2017 in Bangladesh [43]. Fish feed serves as an important input of Nr in the aquaculture sector of the country, and cultured fish ponds released 675 t of N2O in 2008 and 2681 tons in 2017 (Figure 7b). Total ammonia (NH4+ and NH3) production in fish ponds was 21,574 and 85,652 t in 2008 and 2017, respectively (Figure 7b). Unaccounted-for loss of N was calculated to be 4014 t in 2008 and 20,587 t in 2017.

Figure 7. Fish feed and nitrogen in pond aquaculture: (a) Production of total feed, and (b) Nr production upon application to ponds in Bangladesh during 2008 to 2017 (modified from Mamun-Ur-Rashid et al. [41] and DoF [40]).

2.4. Manure N and Nr Production from Livestock and Poultry

The number of livestock of different categories in Bangladesh increased at high rates from 1949 to 2017 (Table 1). The number of bovine animals plateaued from 2008 onward. This lower growth rate of 0.53% is likely because of the replacement of animals with machines in agriculture. However, the numbers of sheep and goats (2.31%) and poultry (2.39%) increased at higher rates. These huge numbers of livestock and poultry require a large amount of nutrients supplied through fodder and feed. For the quality production of milk and meat, quality fodder and nutrient supply is a necessity.
Table 1. Livestock resources (million) in Bangladesh (1949–2017).
Livestock Resources Year Growth Rate (%)
1949 1960 1977 1984 1996 2008 2011 2017
Bovine (cattle, buffaloes, horses) 16.37 21.105 20.58 22.06 22.29 26.22 25.80 25.40 0.53
Sheep, goats 4.27 6.14 9.155 14.22 14.61 17.62 17.32 29.33 2.31
Poultry (fowls and ducks) 25.22 20.10 47.52 73.71 126.67 137.24 135.10 329.20 2.39
Source: AIS [10], Rahman et al. [44], and BBS [45].
Better management options, i.e., application of all required fertilizer elements including N, are required to overcome the shortfall in fodder production. Urea is used in cultivation of fodder crops, e.g., napier, maize, alfalfa, and Moringa oliefera, and other feed production. Even though recommended rates of fertilizer for fodder crops exist, they are basically ignored by most farmers. Animals are fed not only these fodder crops, but also about 27.32 Mt of fibrous biomass and 14,530 t of oilcakes as animal feed [45]. From all these activities, it is likely that a significant amount of reactive N leaks to the environment; however, data on the magnitudes of these losses are missing, which is a concern.
Livestock manure annually contributed 295,913 t of N, where the shares of ruminants and poultry were 234,515 and 61,398 t, respectively (ILMM, 2015). According to FAOSTAT [28], manure N was 80.66 Gg in 1961, which increased to 229.62 Gg in 2017 (Figure 8a). FAOSTAT also reported that of the manure N, about 70% was applied to cropland as organic fertilizer. Because of chemical and microbial transformation of manure N, it substantially contributes to Nr formation, especially in the form of NH3 [46]. Manure N enters the hydrological system through leaching and runoff, and is partly released to the atmosphere through volatilization and denitrification [47]. Data derived from FAOSTAT [28] revealed that livestock-manure-released NH3, N2O, and NO increased significantly in 2017 compared to base year 1961 (Figure 8b).
Figure 8. Nitrogen and Nr production from manure in Bangladesh from 1961 to 2017: (a) N in manure, and N in crop land from manure, (b) Nr from manure, and (c) N2O from manure management and manure to pasture (raw data from FAOSTAT [28]).

References

  1. Sutton, M.A.; Howard, C.M.; Erisman, J.W.; Billen, G.; Bleeker, A. The European Nitrogen Assessment: Sources, Effects and Policy Perspectives; Cambridge University Press: Cambridge, UK, 2011.
  2. Erisman, J.W.; Galloway, J.N.; Seitzinger, S.; Bleeker, A.; Butterbach-Bahl, K. Reactive nitrogen in the environment and its effect on climate change. Curr. Opin. Environ. Sustain. 2011, 3, 281–290.
  3. Erisman, J.W.; Sutton, M.A. Reduced nitrogen in ecology and the environment: Special issue of the ESF-FWF Conference in partnership with LFUI, October 2006. Environ. Pollut. 2008, 154, 357–507.
  4. UNEP. Frontiers 2018/19 Emerging Issues of Environmental Concern; United Nations Environment Programme: Nairobi, Kenya, 2019.
  5. Ju, X.T.; Xing, G.X.; Chen, X.P.; Zhang, S.L.; Zhang, L.J.; Liu, X.J.; Cui, Z.L.; Yin, B.; Christie, P.; Zhu, Z.L.; et al. Reducing environmental risk by improving N management in intensive Chinese agricultural systems. Proc. Natl. Acad. Sci. USA 2009, 106, 3041–3046.
  6. Sutton, M.A.; Oenema, O.; Erisman, J.W.; Leip, A.; van Grinsven, H.; Winiwarter, W. Too much of a good thing. Nature 2011, 472, 159–161.
  7. Lu, C.; Tian, H. Net greenhouse gas balance in response to nitrogen enrichment: Perspectives from a coupled biogeochemical model. Glob. Chang. Biol. 2013, 19, 571–588.
  8. UNEP; WHRC. Reactive Nitrogen in the Environment: Too Much or too Little of a Good Thing; United Nations Environment Programme: Paris, France, 2007.
  9. O’Neill, A. Share of Economic Sectors in the GDP in Bangladesh 2020. Available online: https://www.statista.com/statistics/438359/share-of-economic-sectors-in-the-gdp-in-bangladesh/ (accessed on 27 July 2021).
  10. AIS. Agriculture Information Services; Krishi Diary 2018; Department of Agriculture Extension, Ministry of Agriculture, Government of Bangladesh: Dhaka, Bangladesh, 2018.
  11. Sikder, R.; Xiaoying, J. Climate change impact and agriculture of Bangladesh. J. Environ. Earth Sci. 2014, 4, 35–40.
  12. Islam, M.R.; Hasan, M.Z. Losses of agricultural land due to its infrastructural development: A study on Rajshahi district. Int. J. Sci. Eng. Res. 2013, 4, 391–397.
  13. World Population Review. 2008. Available online: http://worldpopulationreview.com/countries/bangladesh-population/ (accessed on 16 April 2018).
  14. FAO. Fishery and Aquaculture Country Profiles, The People’s Republic of Bangladesh; FAO Fishery and Aquaculture Department, Food and Agriculture Organization of the United Nations: Rome, Italy, 2014; Available online: http://www.fao.org/fishery/facp/BGD/en (accessed on 27 July 2021).
  15. FRSS. Yearbook of Fisheries Statistics of Bangladesh; Fisheries Resources Survey System (FRSS), Department of Fisheries, Bangladesh: Dhaka, Bangladesh, 2016; Volume 32, pp. 1–57.
  16. DoF. Fisheries Statistical Yearbook of Bangladesh 2012–2013; Fisheries Resource Survey System (FRSS), Department of Fisheries: Dhaka, Bangladesh, 2014; p. 52.
  17. Hu, Z.; Lee, J.W.; Chandran, K.; Kim, S.; Khanal, S.K. Nitrous oxide (N2O) emission from aquaculture: A review. Environ. Sci. Technol. 2012, 46, 6470–6480.
  18. BES. Bangladesh Economic Survey; Department of Finance, Ministry of Finance and Planning, Government of the People’s Republic of Bangladesh: Dhaka, Bangladesh, 2009; p. 71.
  19. DLS. Annual Report on Livestock; Division of Livestock Statistics, Ministry of Fisheries and Livestock: Dhaka, Bangladesh, 2013.
  20. FRG. Fertilizer Recommendation Guide (FRG); Bangladesh Agricultural Research Council (BARC): Dhaka, Bangladesh, 2018; p. 223.
  21. ILMM. Draft National Integrated Livestock Manure Management (ILMM) Policy; Government of the People’s Republic of Bangladesh Ministry of Fisheries and Livestock, Bangladesh Secretariat: Dhaka, Bangladesh, 2015.
  22. Zhang, X.; Fang, Q.; Zhang, T.; Ma, W.; Velthof, G.L.; Hou, Y.; Oenema, O.; Zhang, F. Benefits and trade-offs of replacing synthetic fertilizers by animal manures in crop production in China: A meta-analysis. Glob. Chang. Biol. 2020, 26, 888–900.
  23. Singh, B.; Ryan, J. Managing Fertilizers to Enhance Soil Health; International Fertilizer Industry Association: Paris, France, 2015.
  24. Sutton, M.A.; Howard, C.M.; Adhya, T.K.; Baker, E.; Baron, J.; Basir, A.; Brownlie, W.; de Vries, W.; Eory, V.; Hicks, K.W.; et al. Nitrogen—Grasping the Challenge. A Manifesto for Science-in-Action through the International Nitrogen Management System; Centre for Ecology & Hydrology: Edinburgh, UK, 2019.
  25. Islam, S.M.; Yam, K.G.; Shah, A.L.; Singh, U.; Sarkar, M.I.U.; Satter, M.A.; Sanabria, J.; Biswas, J.C. Rice yields and nitrogen use efficiency with different fertilizers and water management under intensive lowland rice cropping systems in Bangladesh. Nutr. Cycl. Agroecosyst. 2016, 106, 143–156.
  26. Bodisrsky, B.L.; Popp, A.; Lotze-Campen, H.; Dietrich, J.P.; Rolinski, S.; Weindl, I.; Schmitz, C.; Muller, C.; Bonsch, M.; Humpenöder, F.; et al. Reactive nitrogen requirements to feed the world in 2050 and potential to mitigate nitrogen pollution. Nat. Commun. 2014, 5, 3858.
  27. Lu, C.; Tian, H. Global nitrogen and phosphorus fertilizer use for agriculture production in the past half century: Shifted hot spots and nutrient imbalance. Earth Syst. Sci. Data 2017, 9, 181–192.
  28. FAOSTAT. Agriculture Statistics from 1961–2017 FAODATA Statistics. 2019. Available online: http://www.fao.org/faostat/en/#data (accessed on 15 March 2019).
  29. BBS. Statistical Year Book of Bangladesh; Statistics Division, Bangladesh Bureau of Statistics, Ministry of Planning, The Government of Peoples Republic of Bangladesh: Dhaka, Bangladesh, 2018.
  30. IFASTAT. International Fertilizer Association. 2019. Available online: https://www.ifastat.org/databases/plant-nutrition (accessed on 12 February 2019).
  31. Bangladesh Unnayan Onneshan. Future Fertilizer Demand for Sustaining Rice Production in Bangladesh: A Quantitative Analysis. Unnayan Onneshan-The Innovators 16/2, Indira Road, Farmgate, Dhaka-1215, Bangladesh. 2018. Available online: http://www.unnayan.org/reports/Livelihood/future_fertilizer_demand.pdf (accessed on 15 April 2018).
  32. FAO. World Fertilizer Trends and Outlook to 2018; Food and Agriculture Organization of the United Nations: Rome, Italy, 2015.
  33. Alam, M.A.; Rahman, M.M.; Biswas, J.C.; Akhter, S.; Maniruzzaman, M.; Choudhury, A.K.; Jahan, A.B.M.S.; Miah, M.M.U.; Sen, R.; Kamal, M.Z.U.; et al. Nitrogen transformation and carbon sequestration in wetland paddy field of Bangladesh. Paddy Water Environ. 2019, 17, 677–688.
  34. Weil, R.R.; Brady, N.C. The Natures and Properties of Soils, 15th ed.; Pearson: New York, NY, USA, 2016; p. 1104.
  35. Islam, M.S. Soil Management in Agricultural Research in Bangladesh; Bangladesh Agricultural Research Council: Dhaka, Bangladesh, 1983; pp. 105–109.
  36. Wortmann, C.S.; Tarkalson, D.D.; Shapiro, C.A.; Dobermann, A.R.; Ferguson, R.B.; Hergert, G.W.; Walters, D. Nitrogen use efficiency of irrigated corn for three cropping systems in Nebraska. Agron. J. 2011, 103, 76–84.
  37. AIS. Agriculture Information Services; Department of Agriculture Extension, Ministry of Agriculture, Government of Bangladesh: Dhaka, Bangladesh, 2016.
  38. BBS. Statistical Year Book of Bangladesh; Statistics Division, Bangladesh Bureau of Statistics, Ministry of Planning, The Government of Peoples Republic of Bangladesh: Dhaka, Bangladesh, 2016.
  39. Climatewatch. Historical GHG Emission. Available online: https://www.climatewatchdata.org/ghg-emissions?end_year=2018&start_year=1990 (accessed on 12 May 2021).
  40. DoF. Fisheries Statistical Yearbook of Bangladesh, 2017–2018; Fisheries Resources Survey System (FRSS), Department of Fisheries, Ministry of Fisheries: Dhaka, Bangladesh, 2018; Volume 35, p. 129.
  41. Mamun-Ur-Rashid, M.; Belton, B.; Phillips, M.; Rosentrater, K.A. Improving Aquaculture Feed in Bangladesh: From Feed Ingredients to Farmer Profit to Safe Consumption; World Fish: Penang, Malaysia, 2013; pp. 2013–2034.
  42. Barman, B.K.; Karim, M. Analysis of feeds and fertilizers for sustainable aquaculture development in Bangladesh. In Study and Analysis of Feeds and Fertilizers for Sustainable Aquaculture Development; Hasan, M.R., Hecht, T., de Silva, S.S., Tacon, A.G.J., Eds.; FAO Fisheries Technical Paper. No. 497; FAO: Rome, Italy, 2007; pp. 113–140.
  43. Hossain, T. Grain and Feed Annual: Bangladesh; Gain Report, BG 1803; Global Agricultural Information Network, USDA Foreign Agricultural Services: Washington, DC, USA, 2018.
  44. Rahman, M.M.; Yakupitiyage, A.; Ranamukhaarchchi, S.L. Agricultural use of fish pond sediment for environmental amelioration. Thammassat Int. J. Sci. Technol. 2004, 9, 1–10.
  45. BBS. Statistical Year Book of Bangladesh; Statistics Division, Bangladesh Bureau of Statistics, Ministry of Planning, The Government of Peoples Republic of Bangladesh: Dhaka, Bangladesh, 2012.
  46. Galloway, J.N.; Cowling, E.B. Reactive nitrogen and the world: 200 years of change. AMBIO J. Hum. Environ. 2002, 31, 64–71.
  47. Erisman, J.W.; Galloway, J.N.; Dies NBSutton, M.A.; Bleeker, A.; Grizzetti, B.; Leach, A.M.; de Vries, W. Nitrogen: Too Much of a Vital Resource; Science Brief; WWF: Zeist, The Netherlands, 2015.
More
Information
Contributor MDPI registered users' name will be linked to their SciProfiles pages. To register with us, please refer to https://encyclopedia.pub/register :
View Times: 933
Entry Collection: Environmental Sciences
Revisions: 2 times (View History)
Update Date: 06 Jan 2022
1000/1000