Your browser does not fully support modern features. Please upgrade for a smoother experience.
Submitted Successfully!
 +1 credit
Thank you for your contribution! You can also upload a video entry or images related to this topic.
For video creation, please contact our Academic Video Service.
| Version | Summary | Created by | Modification | Content Size | Created at | Operation |
|---|---|---|---|---|---|---|
| 1 | Jianping Xu | + 1814 word(s) | 1814 | 2021-12-30 04:42:29 | | | |
| 2 | Amina Yu | + 3 word(s) | 1817 | 2021-12-31 03:24:53 | | |
Video Upload Options
We provide professional Academic Video Service to translate complex research into visually appealing presentations. Would you like to try it?
Cite
If you have any further questions, please contact Encyclopedia Editorial Office.
Xu, J. Aspergillus fumigatus in Arctic Soils. Encyclopedia. Available online: https://encyclopedia.pub/entry/17676 (accessed on 24 June 2026).
Xu J. Aspergillus fumigatus in Arctic Soils. Encyclopedia. Available at: https://encyclopedia.pub/entry/17676. Accessed June 24, 2026.
Xu, Jianping. "Aspergillus fumigatus in Arctic Soils" Encyclopedia, https://encyclopedia.pub/entry/17676 (accessed June 24, 2026).
Xu, J. (2021, December 30). Aspergillus fumigatus in Arctic Soils. In Encyclopedia. https://encyclopedia.pub/entry/17676
Xu, Jianping. "Aspergillus fumigatus in Arctic Soils." Encyclopedia. Web. 30 December, 2021.
Copy Citation
Aspergillus fumigatus is a thermotolerant ascomycete mould with a ubiquitous presence around the world. Its primary ecological niche is within decaying plant matter and soil. However, it is also a common opportunistic fungal pathogen capable of infecting both immunocompetent and immunocompromised humans.
Aspergillus
arctic
microsatellite genotyping
population genetics
triazole resistance
global population structure
1. Isolation Rates of A. fumigatus from Arctic Soils
In total, 52 (23.6%) and 32 (10.2%) A. fumigatus isolates were obtained from 220 NWT and 314 Iceland soils samples, respectively. In both regions, there were considerable variations among sites in their isolation rates of A. fumigatus (Table 1). Following isolation, all isolates were genotyped at nine microsatellite loci.
Table 1. Soil samples and A. fumigatus isolates obtained from Iceland and Northwest Territories (NW)
| Country/Territory | Local Site | Number of Soil Samples | Number of Isolates (MAT1-1:MAT1-2) * |
|---|---|---|---|
| Iceland | Dimmuborgir | 60 | 1 (0:1) |
| Thingvellir | 51 | 8 (3:5) | |
| Skaftafell | 52 | 6 (4:2) | |
| Myvatn Lake | 42 | 10 (7:3) | |
| Landbrotalaug | 60 | 1 * | |
| Reykjavik University | 49 | 6 (4:2) | |
| Total | 312 | 32 (18:13) * | |
| Canada/NWT | Yellowknife Downtown | 80 | 43 (24:17) * |
| 30 km North of Yellowknife | 50 | 0 | |
| 30 km Northwest of Yellowknife | 60 | 3 (0:3) | |
| Yellowknife Old Town | 30 | 6 (1:5) | |
| Total | 220 | 52 (25:25) * |
* 1 isolate from Iceland and 2 from NWT were unable to be genotyped at the MAT locus.
2. Local Genetic Diversity within Iceland and NWT
The STR genotypes were obtained for isolates from both Iceland and NWT A. fumigatus populations. Because of the small sample sizes and unequal sample size distributions among local populations from within both Iceland and NWT (Table 1), it was elected to not compare the local populations within each of the two regions but instead focused on comparing the two arctic populations. It was found that the two regional populations had similar uh between Iceland and NWT where no significant difference was observed (Table 2; p = 0.36). For the effective number of alleles, the NWT population had a higher value than that from Iceland, but the difference was statistically insignificant (p = 0.13). Similarly, the number of observed alleles was higher in the NWT population but after being adjusted for sample size effects, the difference was statistically nonsignificant (p = 0.08). Together, the results indicated similar levels of allelic and genotypic diversities between the Iceland and NWT soil populations of A. fumigatus.
Table 2. Number of alleles and allelic diversity for the nine microsatellite loci of 32 and 52 Aspergillus fumigatus isolates from Iceland and Northwest Territories, respectively.
| Population | Locus | N 1 | Na 2 | Ne 3 | Uh 4 |
|---|---|---|---|---|---|
| Iceland | 2A | 32 | 7 | 4.92 | 0.82 |
| 2B | 32 | 5 | 4.70 | 0.81 | |
| 2C | 32 | 8 | 6.10 | 0.86 | |
| 3A | 32 | 13 | 6.02 | 0.86 | |
| 3B | 32 | 6 | 4.66 | 0.81 | |
| 3C | 32 | 10 | 6.24 | 0.87 | |
| 4A | 29 | 5 | 2.87 | 0.68 | |
| 4B | 32 | 6 | 2.94 | 0.68 | |
| 4C | 30 | 10 | 5.63 | 0.85 | |
| Mean | 31.44 | 7.78 | 4.90 | 0.81 | |
| Standard Error | 0.38 | 0.91 | 0.43 | 0.03 | |
| Northwest Territories | 2A | 51 | 14 | 4.43 | 0.79 |
| 2B | 52 | 10 | 3.99 | 0.76 | |
| 2C | 52 | 11 | 6.93 | 0.87 | |
| 3A | 50 | 19 | 13.74 | 0.95 | |
| 3B | 50 | 11 | 4.63 | 0.80 | |
| 3C | 50 | 19 | 12.89 | 0.94 | |
| 4A | 52 | 9 | 3.25 | 0.71 | |
| 4B | 52 | 8 | 3.22 | 0.70 | |
| 4C | 52 | 14 | 5.88 | 0.85 | |
| Mean | 51.22 | 12.78 | 6.55 | 0.82 | |
| Standard Error | 0.32 | 1.35 | 1.34 | 0.03 |
1 N = sample size; 2 Na = number of unique alleles; 3 Ne = number of effective alleles = 1/(Σpi2) where pi is the frequency of the ith allele for the population; 4 uh = unbiased diversity = (N/(N−1)) × (1−Σpi2).
3. Clonality and Recombination within Iceland and Northwest Territories
To investigate evidence for clonality and recombination within the two arctic A. fumigatus populations, conducted two tests was detected :rd¯the proportion of phylogenetically compatible loci and the index of associations. Therd¯index of association values of Iceland and NWT were 0.36 (p = 0.001) and 0.16 (p = 0.001), respectively, rejecting the null hypothesis of random mating. The hypothesis of random mating was rejected even after clonal corrections. However, phylogenetic compatibility analyses revealed that 55.6% (p = 0.001) and 5.6% (p = 0.001) pairs of loci within Iceland and NWT were phylogenetically compatible. The high proportions of phylogenetically incompatible pairs of loci, at 44.4% and 94.4%, respectively, for the Iceland and NWT populations, are consistent with recombination. Overall, these results indicate that both the Iceland and NWT soil populations of A. fumigatus contain signatures of both clonal and recombining modes of reproduction.
4. Relationships between Iceland and NWT Samples
It was analyzed the relationships among A. fumigatus isolates from Iceland and NWT. Bruvo’s genetic distance was calculated between isolates of both populations and visualized through an MSN (Figure 1). Overall, while it was observed some geographic clustering among MLGs, isolates from the two arctic populations were intermixed. For example, two different MLGs were shared between Iceland and NWT populations. One of these two MLGs was shared among six strains with three isolates from each of the two regional populations. The other was shared among four isolates (one from Iceland and three from NWT). A DAPC of the Iceland and NWT samples yielded comparable results, which both showed some geographic clustering as well as overlaps between these two regions (Figure 2). Results from AMOVA indicated that while the majority (86.8%) of the genetic variations were found within the two regional populations, 13.2% of the total observed genetic variance was found between these two populations (ϕpt = 0.132, p = 0.001). Together, these results are consistent with an overall statistically significant genetic differentiation between these two arctic populations.
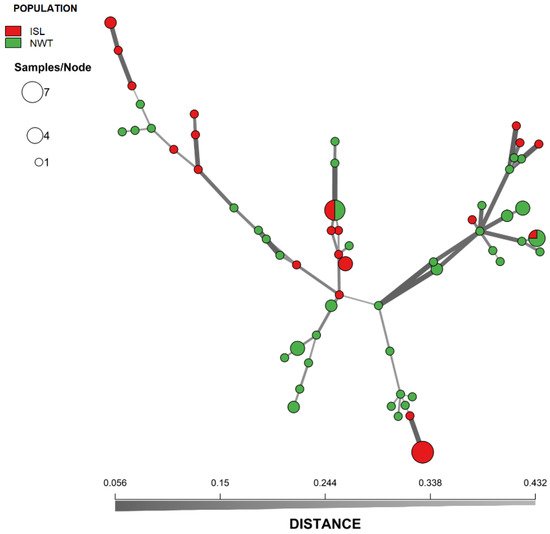
Figure 1. Minimum-spanning network showing the genetic relationship between MLGs of A. fumigatus from Iceland and Northwest Territory in Canada. The genetic distance between MLGs was calculated using Bruvo’s genetic distance from the nine microsatellite loci that incorporates the stepwise mutation model. Each node represents one or more identical MLGs, where node size corresponds to the number of strains for each MLG. Nodes that are more genetically similar have darker and thicker edges, whereas nodes genetically distant have lighter and thinner edges.
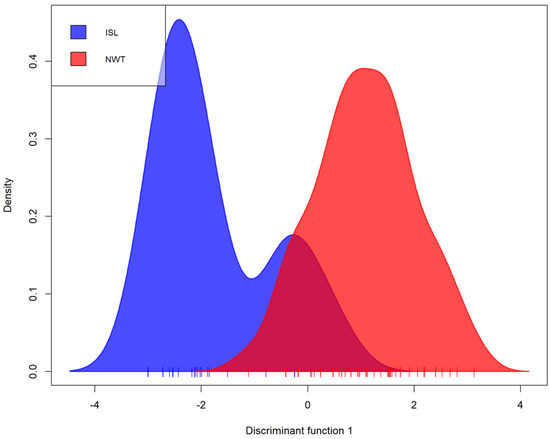
Figure 2. Discriminant analysis of principal components (DAPC) of Iceland and NWT A. fumigatus populations representing the first discriminant function in an individual density plot. Isolates were genotyped at nine microsatellite loci and clone corrected, totaling 60 multilocus genotypes. NWT—Northwest Territories, ISL—Iceland.
5. Relationship between the Arctic Populations to Additional Global A. fumigatus Populations
To determine how the arctic populations fit in the global context, the allelic and genotypic diversities of 12 other geographic populations totaling 2339 A. fumigatus MLGs were compared to the Iceland and NWT A. fumigatus populations. Within the 2423 MLGs, the number of private alleles present only within Iceland and NWT was 2 and 1 respectively. In Iceland, these two private alleles were #116 and #117 at the 3A locus. In NWT, the private allele was #57 at the 3B locus. Together, the allelic distribution results suggest limited novel genetic diversity in the arctic soil samples.
To determine the genetic relationships between the 2 arctic populations and the 12 other geographic populations, ϕpt was calculated between all pairwise population combinations (Table 3). For this analysis, the dataset was also clone-corrected to remove the influence of multiple clonal MLGs in determining genetic differentiation between populations. Overall, the analyses revealed that the two arctic populations of A. fumigatus were significantly different from most other geographic populations (Table 3). Specifically, before clonal correction, only the Belgian and French populations showed insignificant difference to the Iceland population. After clonal correction, only the Indian and French populations were not significantly differentiated from the Iceland population while the Norwegian and New Zealand populations were not significantly different from the NWT population.
Table 3. Pairwise differentiations between Iceland and Northwest Territories A. fumigatus populations to each other and 12 A. fumigatus populations from Eurasia, Oceania, and North America. NWT/ISL row represents the Iceland or Northwest Territories population being compared to the other. NWT—Northwest Territories, ISL—Iceland, CMR—Cameroon, CAN—Hamilton, Ontario, Canada, BEL—Belgium, FRA—France, DEU—Germany, IND—India, NLD—Netherlands, NOR—Norway, NZL—New Zealand, ESP—Spain, CHE—Switzerland, and USA—United States.
| Pairwise ϕpt | ||||
|---|---|---|---|---|
| Iceland | Northwest Territories | |||
| Country | Original Dataset | Clone Corrected | Original Dataset | Clone Corrected |
| NWT/ISL | 0.132 ** | 0.083 * | 0.132 ** | 0.083 * |
| CMR | 0.580 *** | 0.629 *** | 0.598 *** | 0.588 *** |
| CAN | 0.412 *** | 0.439 *** | 0.337 *** | 0.327 *** |
| BEL | 0.020 | 0.048 * | 0.178 *** | 0.041 ** |
| FRA | 0.028 | 0.012 | 0.070 ** | 0.050 * |
| DEU | 0.170 *** | 0.192 *** | 0.285 *** | 0.206 *** |
| IND | 0.130 *** | 0.052 | 0.213 *** | 0.056 * |
| NLD | 0.054 ** | 0.069 * | 0.088 *** | 0.062 ** |
| NOR | 0.152 *** | 0.050 * | 0.037 ** | 0.014 |
| NZL | 0.067 ** | 0.123 ** | 0.051 ** | 0.024 |
| ESP | 0.082 ** | 0.074 * | 0.122 *** | 0.069 *** |
| CHE | 0.089 ** | 0.100 ** | 0.063 *** | 0.036 * |
| USA | 0.162 *** | 0.146 ** | 0.129 *** | 0.051 ** |
* p-value = 0.05, ** p-value = 0.01, *** p-value = 0.001.
It analyzed the genotypic similarities among individual MLGs from the 14 geographic populations. An MSN of all 2416 strains was generated to visualize the genetic distance among the MLGs (Figure 3). To highlight the distribution of the arctic isolates, the 12 previously surveyed A. fumigatus populations were coloured white. Overall, while the MLGs from the arctic regions showed some geographic clustering, these arctic genotypes were broadly embedded in the global genotype network. This overall pattern was similarly supported by DAPC analyses (Figure 4) where MLGs from Iceland and NWT clustered with those from Eurasia and the United States but were different from the Hamilton, Ontario, Canada population as well as from the Cameroonian population.
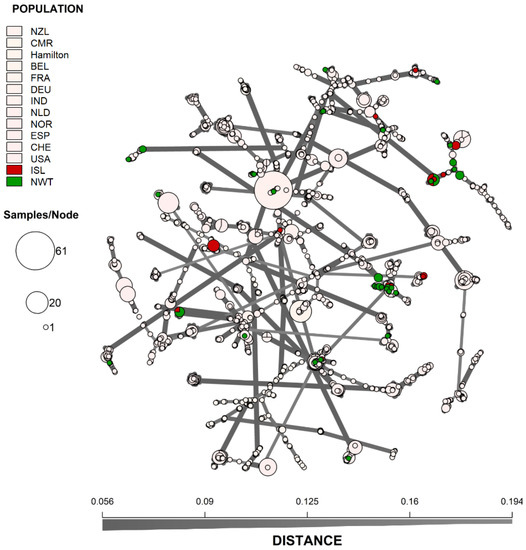
Figure 3. Minimum-spanning network showing the genetic relationship between MLGs from Iceland and Northwest Territory to 12 other A. fumigatus geographic populations. The genetic distance between MLGs was calculated using Bruvo’s genetic distance based on the nine microsatellite loci that incorporates the stepwise mutation model. Each node represents one or more identical MLGs, where the node size corresponds to the number of identical MLGs. Nodes that are more genetically similar have darker and thicker edges, whereas nodes genetically distant have lighter and thinner edges. NWT—Northwest Territories, ISL—Iceland, CMR—Cameroon, CAN—Hamilton, Ontario, Canada, BEL—Belgium, FRA—France, DEU—Germany, IND—India, NLD—Netherlands, NOR—Norway, NZL—New Zealand, ESP—Spain, CHE—Switzerland, and USA—United States.
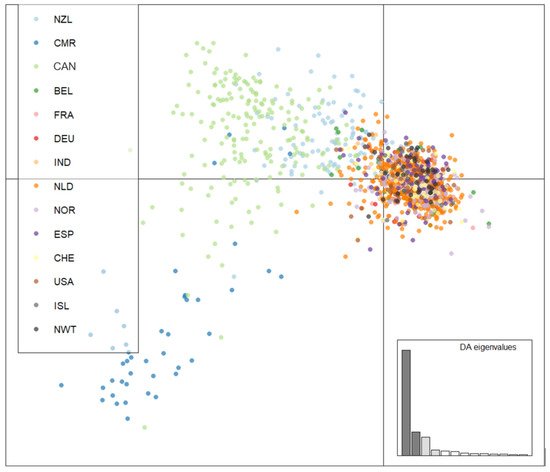
Figure 4. Genetic clustering using discriminant analysis of principal components (DAPC) of Iceland, NWT, Eurasian, North American, and Oceanian A. fumigatus populations. Isolates were genotyped at nine microsatellite loci and clone corrected, totaling 1703 unique multilocus genotypes. Populations were clustered according to population of origin. NWT—Northwest Territories, ISL—Iceland, CMR—Cameroon, CAN—Hamilton, Ontario, Canada, BEL—Belgium, FRA—France, DEU—Germany, IND—India, NLD—Netherlands, NOR—Norway, NZL—New Zealand, ESP—Spain, CHE—Switzerland, and USA—United States.
6. Susceptibility Testing
Antifungal susceptibility testing using voriconazole and itraconazole was conducted for all isolates from the two arctic populations (Table 4). One isolate resistant to both triazoles was identified within NWT but no resistant strain was identified from Iceland (Figure 5). The sequence analysis revealed that this triazole-resistant strain NCY6_13_2 had the TR34/L98H mutation within the cyp51A gene. Interestingly, this strain had a near identical genotype at the nine STR loci to a clonal population of triazole-resistant strains discovered from India in 2012, differing by only one repeat unit at the 3A locus and with identical alleles at the other eight STR loci (Table 5). Furthermore, all the A. fumigatus isolates in this Indian clone contained the identical TR34/L98H mutation within the cyp51A gene as the strain from NWT in the sample.
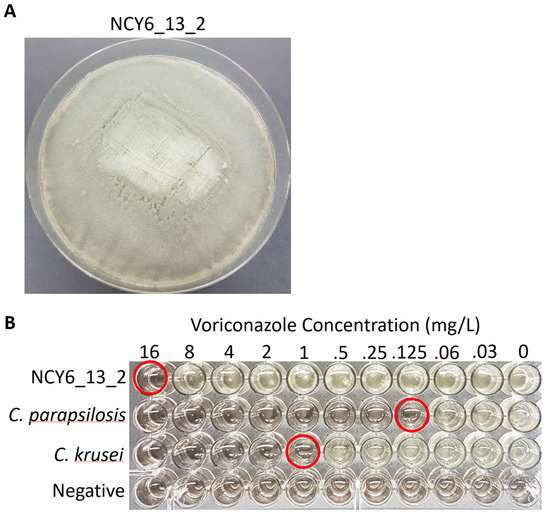
Figure 5. Radial growth and voriconazole susceptibility of triazole resistant A. fumigatus strain NCY6_13_2. (A) Growth morphology of A. fumigatus strain NCY6_13_2 on Malt extract agar after 5-day incubation at 35°C. (B) Voriconazole susceptibility of NCY6_13_2. Two control strains, Candida parasilosis ATCC® 22019 and C. krusei ATCC® 6258, were used to verify the susceptibility results. A negative control that was not inoculated with any microbial strain was included in the bottom row. Susceptibility endpoints are circled in red for each strain.
Table 4. Triazole antifungal susceptibility of the 32 and 52 A. fumigatus isolates from Iceland and NWT, respectively, to itraconazole and voriconazole. Numbers in the table refer to the number of strains with the respective minimum inhibitory concentrations for each of the two drugs in each geographic population.
| Country/Territory | Triazole | Minimum Inhibitory Concentration (mg/L) | |||||
|---|---|---|---|---|---|---|---|
| 0.125 | 0.25 | 0.5 | 1 | 2 | 16 | ||
| Iceland | Itraconazole | 0 | 0 | 24 | 8 | 0 | 0 |
| Voriconazole | 2 | 29 | 1 | 0 | 0 | 0 | |
| Canada/NWT | Itraconazole | 0 | 0 | 35 | 16 | 0 | 1 |
| Voriconazole | 0 | 27 | 24 | 0 | 0 | 1 | |
Table 5. Short tandem repeat genotype of the A. fumigatus strain with the TR34/L98H mutation in the triazole-target gene cyp51A obtained from Northwest Territories in Canada. Alleles at eight of the nine STR loci in this strain were identical to those of the large Indian triazole-resistant clonal population.
| Strain | Region | 2A | 2B | 2C | 3A | 3B | 3C | 4A | 4B | 4C |
|---|---|---|---|---|---|---|---|---|---|---|
| NCY6-13_2 | NWT | 14 | 20 | 9 | 31 | 8 | 10 | 8 | 10 | 28 |
| 1042/09 | India | 14 | 20 | 9 | 31 | 9 | 10 | 8 | 10 | 28 |
Information
Subjects:
Mycology
Contributor
MDPI registered users' name will be linked to their SciProfiles pages. To register with us, please refer to https://encyclopedia.pub/register
:
View Times:
829
Revisions:
2 times
(View History)
Update Date:
19 Apr 2022
Table of Contents


Notice
You are not a member of the advisory board for this topic. If you want to update advisory board member profile, please contact office@encyclopedia.pub.
OK
Confirm
Only members of the Encyclopedia advisory board for this topic are allowed to note entries. Would you like to become an advisory board member of the Encyclopedia?
Yes
No
${ textCharacter }/${ maxCharacter }
Submit
Cancel
Back
Comments
${ item }
|
${ item.createdUser.fullName }
${ item.createdAt }
${ item.vote }
${ item.reply }
Delete
${ reply.createdUser.fullName }
${ reply.createdAt }
${ reply.vote }
Delete
There is no reply to this comment~
${ item.replyTextCharacter }/${ item.replyMaxCharacter }
Submit
Cancel
More
No more~
There is no comment~
${ textCharacter }/${ maxCharacter }
Submit
Cancel
${ selectedItem.replyTextCharacter }/${ selectedItem.replyMaxCharacter }
Submit
Cancel
Confirm
Are you sure to Delete?
Yes
No