Your browser does not fully support modern features. Please upgrade for a smoother experience.
Submitted Successfully!
 +1 credit
Thank you for your contribution! You can also upload a video entry or images related to this topic.
For video creation, please contact our Academic Video Service.
Video Upload Options
We provide professional Academic Video Service to translate complex research into visually appealing presentations. Would you like to try it?
Cite
If you have any further questions, please contact Encyclopedia Editorial Office.
Tan, L. The Sanjiangyuan Nature Reserve for Mitigating Human Pressures. Encyclopedia. Available online: https://encyclopedia.pub/entry/17647 (accessed on 22 June 2026).
Tan L. The Sanjiangyuan Nature Reserve for Mitigating Human Pressures. Encyclopedia. Available at: https://encyclopedia.pub/entry/17647. Accessed June 22, 2026.
Tan, Linyi. "The Sanjiangyuan Nature Reserve for Mitigating Human Pressures" Encyclopedia, https://encyclopedia.pub/entry/17647 (accessed June 22, 2026).
Tan, L. (2021, December 30). The Sanjiangyuan Nature Reserve for Mitigating Human Pressures. In Encyclopedia. https://encyclopedia.pub/entry/17647
Tan, Linyi. "The Sanjiangyuan Nature Reserve for Mitigating Human Pressures." Encyclopedia. Web. 30 December, 2021.
Copy Citation
This entry developed a human footprint (HF) dataset for the Sanjiangyuan region in China, which was localized the global HF model, then used it to assess the effectiveness of Sanjiangyuan natural reserve.
human footprint
sanjiangyuan region
protected areas
effectiveness
1. Backgrond
Human activities have greatly intensified since the Industrial Revolution, resulting in worldwide environmental degradation and biodiversity loss [1][2]. Many countries have established a series of protected areas to reduce human pressure on the ecosystem and protect biodiversity. Protected areas cover roughly 15.4% of Earth’s surface [3]; however, they have shortfalls in effectiveness [4]. There are 20 “Aichi Biodiversity Targets” set by the United Nations Conference on Biological Diversity in 2010, including “Address the underlying causes of biodiversity loss by mainstreaming biodiversity across government and society” and “Reduce the direct pressures on biodiversity and promote sustainable use” (https://www.cbd.int/sp/targets accessed on 15 December 2021). By 2020, however, none of them have been fully achieved, and only six goals have been partially achieved [5].
It has become increasingly important to assess whether protected areas are effective. At the global scale, the effectiveness of protected areas in implementing biodiversity measures [6], reducing forest loss [7], and protecting natural land cover [8] was assessed. At the national scale, some scholars evaluated the conservation effectiveness for amphibian biodiversity [9] and carnivores [10]. Moreover, some evaluation studies are also available at the regional scale [11][12][13]. These studies primarily focus on changes of species or ecosystem services, which has provided a good foundation for further studies. However, assessing changes in biodiversity and ecosystem services is not only time- and cost-consuming. It also requires integrating a great number of biotic and abiotic variables that are not fully comprehended and differ from period to period and area to area. As the targets of protected areas were achieved by reducing human activity, evaluating the change in human activity intensity should also be feasible. It is accurate and efficient because the human pressure data, including population density and land use intensity, is easier to obtain than biodiversity and ecosystem services data. Some studies have attempted to assess the effectiveness of protected areas from the perspective of human activity, including land use [14][15], roads [16], grazing [17][18], and energy consumption such as nighttime lights [19][20]. Nevertheless, most of them have investigated only one or two human impact factors, thus resulting in insufficient assessments.
Some researchers [21][22] mapped human footprint (HF), measuring human activities from multiple perspectives. It is a map that shows the impacts of human activity on the planet’s surface [21]. It measures the cumulative disturbance intensity of some categories of human pressures on ecosystems, including built environments, crop and pasture lands, population density, nighttime lights, roads and railways, and navigable waterways [23]. By contrast with collecting biodiversity and ecosystem services data, it is easier to obtain these satellite-based human pressure data. So HF has been widely adopted in studies at various scales. Specifically, at the regional scale, it has been used to evaluate the effectiveness of nature reserves in Tibet [24], the Hengduan Mountains region [25], and south Ecuador [26]. It has been mapped for Iran [27] and Argentina [28] at the national scale. At the global scale, it has been used to evaluate the effectiveness of global terrestrial nature reserves for different years [22][29][30]. These studies have shown that HF is increasingly being used to evaluate the effectiveness of nature reserves [27].
As the Yellow River, Yangtze River, and Mekong River source, the Sanjiangyuan region is rich in biodiversity and ecosystem services. China and the Chinese government have designated a nature reserve in this area known as Sanjiangyuan nature reserve (SNR), one of the largest in China situated in the Qinghai-Tibet plateau. In terms of biodiversity and ecosystem services, evaluating the SNR’s effectiveness is challenging because it is nearly impossible to collect data covering a long time on this remote plateau with a harsh natural environment. A more flexible way to assess its effectiveness is measuring HF and its changes after SNR is established.
2. Spatio-Temporal Changes of the HF for 1995–2015 in the Sanjiangyuan Region
The intensity of human activities in the Sanjiangyuan region was generally low from 1995 to 2015, with a fluctuating increasing trend. The average HF value in the Sanjiangyuan region was only 1.0307 in 20 years (Figure 1). The HF value was considerable in the eastern parts of the Sanjiangyuan region and low in its western parts.
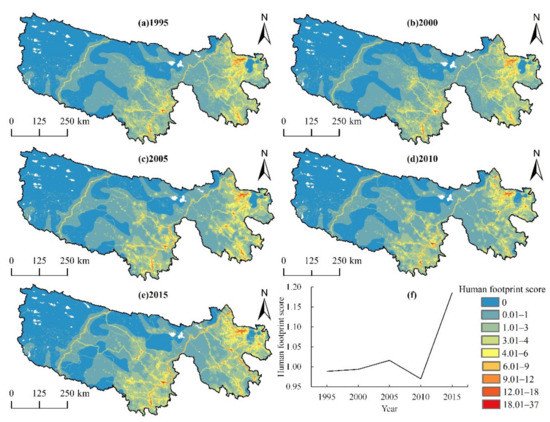
Figure 1. Spatio-temporal distributions of HF in the Sanjiangyuan region from 1995 to 2015.
The average HF value increased from 0.9885 in 1995 to 1.0161 in 2005, indicating human activity intensity was increasing for the Sanjiangyuan region. For 2005–2010, the average HF value decreased from 1.0161 to 0.9697. After that, it increased to 1.1857 in 2015. Spatially, the HF value is high in the east and south of the Sanjiangyuan region and low in the west of the region. Collectively, the spatial pattern of HF remained stable for the whole study period (Figure 1).
There was an increasing trend for population density, land use intensity, nighttime lights, and roads from 1995 to 2015. In particular, the pressure values of roads and population density increased by 0.0973 and 0.1612, respectively, over 20 years (Table 1). Nevertheless, grazing intensity showed a decreasing trend.
Table 1. The disturbance value of five categories of human pressures to the ecosystem in the Sanjiangyuan area from 1995 to 2015.
| Human Pressures | 1995 | 2000 | 2005 | 2010 | 2015 |
|---|---|---|---|---|---|
| Population density | 0.6150 | 0.6150 | 0.6205 | 0.6406 | 0.7763 |
| Land use intensity | 0.0385 | 0.0436 | 0.0444 | 0.0445 | 0.0456 |
| Grazing intensity | 0.2111 | 0.2111 | 0.2111 | 0.1422 | 0.1422 |
| Roads | 0.1180 | 0.1180 | 0.1370 | 0.1370 | 0.2153 |
| Nighttime lights | 0.0004 | 0.0004 | 0.0004 | 0.0032 | 0.0040 |
3. Effectiveness of the SNR in Mitigating Human Activities
3.1. Changes of the HF within and outside the SNR
From 1995 to 2005, when there were few ecological measures in the SNR, the increase of HF value inside the SNR was always greater than that outside the area, and the increase occurred mainly in the central and eastern SNR (Figure 2). For 2005–2010, both the inside and outside of the SNR experienced a reduction in HF value, but the reduction was less for the inside than it was for the outside. And the decline was concentrated mainly outside the eastern SNR. From 2010 to 2015, the growth of the HF value inside the SNR was less than that outside the area, and the growth occurred mainly outside the central and eastern SNR (Figure 2).
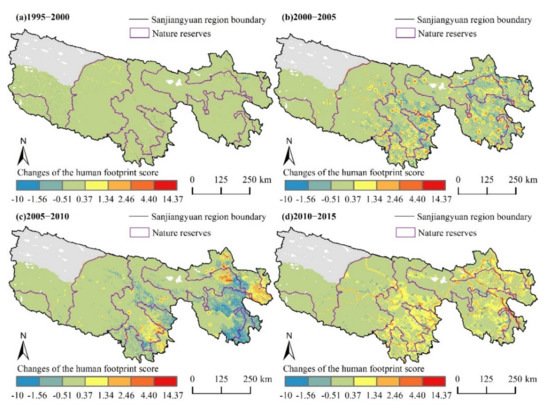
Figure 2. Spatio-temporal changes of HF within and outside of the SNR for 1995–2015.
The effectiveness of the measures in reducing the five categories of human pressures is also partially positive. The changes in population density within the SNR were greater than those outside the SNR until 2010. From 2010 to 2015, the changes in population density within the SNR were lower than those outside the SNR. This phenomenon suggests that controlling the population increase in the reserve didn’t work from 2005 to 2010, and had positive impacts only for 2010–2015 (Table 2).
Table 2. Changes of HF values within and outside of the SNR for 1995–2015.
| Human Pressures | Changes in Human Pressure Values | |||||||||
|---|---|---|---|---|---|---|---|---|---|---|
| 1995–2000 | 2000–2005 | 2005–2010 | 2010–2015 | 1995–2015 | ||||||
| within | outside | within | outside | within | outside | within | outside | within | outside | |
| Population density | 0.0000 | 0.0000 | 0.0020 | 0.0042 | 0.0371 | 0.0095 | 0.1323 | 0.1775 | 0.1714 | 0.1912 |
| Land use intensity | 0.0106 | 0.0008 | 0.0004 | 0.0015 | −0.0002 | 0.0005 | 0.0004 | 0.0015 | 0.0112 | 0.0043 |
| Grazing intensity | 0.0000 | 0.0000 | 0.0000 | 0.0000 | −0.0689 | −0.0900 | 0.0000 | 0.0000 | −0.0689 | −0.0900 |
| Roads | 0.0000 | 0.0000 | 0.0291 | 0.0131 | 0.0000 | 0.0000 | 0.0789 | 0.1008 | 0.1080 | 0.1139 |
| Nighttime lights | 0.0000 | 0.0000 | 0.0000 | −0.0002 | 0.0007 | 0.0057 | 0.0002 | 0.0015 | 0.0009 | 0.0070 |
| HF value | 0.0108 | 0.0008 | 0.0313 | 0.0176 | −0.0317 | −0.0746 | 0.2123 | 0.2815 | 0.2227 | 0.2253 |
From 1995 to 2000, the increase of land use intensity in the SNR was higher than that outside the SNR. After 2000, it was always lower in the reserve than outside of it. Encouragingly, the ecological measures reduced the land use intensity within the SNR from 2005 to 2010, but the remarkable changes were not sustained in the latter five years (Table 2). The results show the ecological measures played a positive role in reducing land use intensity from 2005 to 2010, but the role for 2010–2015 was weaker than that for 2005–2010.
The grazing intensity decreased within and outside the SNR for 2005–2010, but the decrease was higher inside the reserve than outside (Table 2). These results suggest that the ecological measures have been successful in reducing grazing disturbance, but there is a lack of more careful management within the reserve.
The increase of roads within the SNR was greater than outside before taking the conservation measures. After taking the measures, the increase of roads within the reserve had become less than outside. However, the human pressure values within the SNR rose from 0.0291 to 0.0789, and those outside the SNR rose from 0.0131 to 0.1008 (Table 2). The changes suggest that the conservation measures have regulated the disturbance of road construction in the SNR, but it didn’t decrease to the original level.
The increase of nighttime lights was more significant within the SNR than outside from 1995 to 2005. After 2005, the increase of nighttime lights in the SNR was always less than outside (Table 2), which indicates that the conservation measures have effectively regulated the disturbance degree of energy consumption from 2005 to 2015.
3.2. Changes of the HF in Each Functional Zone of the SNR
For 1995–2000, when there were no investments in the natural capital of the SNR, the HF values increased mainly in the experimental areas, then in the buffer areas, and finally in the core areas. After entering the 21st century, the growth of HF values was largest in the core areas, then in the buffer areas, and lastly in the experimental areas for the first five years. Encouragingly, there was a decrease in the HF values for the three functional zones from 2005 to 2010 since the conservation measures have been taken. The experimental areas have the largest reduction, followed by the core areas, and the buffer areas have the least. From 2010 to 2015, the growth of HF values was lowest in the core areas, followed by the buffer areas, and the experimental areas were highest (Table 3). The changes show that the conservation measures in the three functional zones were partially effective.
Table 3. Changes in the HF values in three functional zones of the SNR from 1995 to 2015.
| Functional Zones | Human Pressures | Changes in Human Pressure Values | ||||
|---|---|---|---|---|---|---|
| 1995–2000 | 2000–2005 | 2005–2010 | 2010–2015 | 1995–2015 | ||
| Core areas | Population density | 0.0000 | 0.0057 | 0.0219 | 0.0973 | 0.1249 |
| Land use intensity | 0.0089 | 0.0011 | −0.0006 | 0.0001 | 0.0095 | |
| Grazing intensity | 0.0000 | 0.0000 | −0.0225 | 0.0000 | −0.0225 | |
| Roads | 0.0000 | 0.0376 | 0.0000 | 0.0617 | 0.0993 | |
| Nighttime lights | 0.0000 | 0.0000 | 0.0000 | 0.0005 | 0.0005 | |
| HF value | 0.0093 | 0.0449 | −0.0015 | 0.1615 | 0.2142 | |
| Buffer areas | Population density | 0.0000 | −0.0014 | 0.0377 | 0.1147 | 0.1510 |
| Land use intensity | 0.0109 | 0.0001 | 0.0003 | 0.0003 | 0.0116 | |
| Grazing intensity | 0.0000 | 0.0000 | −0.0384 | 0.0000 | −0.0384 | |
| Roads | 0.0000 | 0.0312 | 0.0000 | 0.0544 | 0.0856 | |
| Nighttime lights | 0.0000 | 0.0000 | 0.0002 | 0.0001 | 0.0003 | |
| HF value | 0.0109 | 0.0299 | −0.0003 | 0.1695 | 0.2100 | |
| Experimental areas | Population density | 0.0000 | 0.0024 | 0.0426 | 0.1541 | 0.1991 |
| Land use intensity | 0.0111 | 0.0003 | −0.0002 | 0.0006 | 0.0118 | |
| Grazing intensity | 0.0000 | 0.0000 | −0.1033 | 0.0000 | −0.1033 | |
| Roads | 0.0000 | 0.0248 | 0.0000 | 0.0973 | 0.1221 | |
| Nighttime lights | 0.0000 | 0.0000 | 0.0012 | 0.0002 | 0.0014 | |
| HF value | 0.0112 | 0.0268 | −0.0600 | 0.2525 | 0.2305 | |
The land use intensity within the core areas had a maximum decrease of 0.0006 for 2005–2010, then increased slightly from 2010 to 2015 (Table 3). However, it still decreased a lot compared to the pre–2005 period. The results suggest that the measures mitigated land use intensity more effectively for 2005–2010 than for 2010–2015. Grazing was controlled well, with its pressure on the ecosystem decreasing by 0.0225 during 2005–2010. Unfortunately, the SNR failed to reduce the population density, road construction, and energy consumption, with their pressures even increasing more than those in the pre–2005 period.
In the buffer areas, grazing was effectively regulated through ecological measures from 2005 to 2010, with the pressure to the ecosystem decreasing by 0.0384 (Table 3). However, both population density and nighttime lights increased, rising to 0.0377 and 0.0002 for 2005–2010. And they were 0.1147 and 0.0001 for 2010–2015, which decreased compared to those for 2005–2010. These results indicate that the measures failed to reduce population density and energy consumption. A similar situation can be found for land use and road construction factors.
In the experimental areas, grazing was effectively mitigated from 2005 to 2010, with its pressure on the ecosystem decreasing by 0.1033 (Table 3). The pressure value of land use intensity decreased by 0.0002 from 2005 to 2010, but it increased by 0.0006 from 2010 to 2015. This change indicates that the conservation measures only reduced land use intensity for 2005–2010. Before implementing the conservation measures, the pressure values for population density and nighttime lights continued to rise by 0.0426 and 0.0012 from 2005 to 2010. Nevertheless, they decreased by 0.1541 and 0.0002 from 2010 to 2015, which indicates that the conservation measures only reduced population density and energy consumption for 2010–2015. Furthermore, the conservation measures were ineffective in regulating roads, as the pressure score for roads increased significantly from 2010 to 2015.
References
- Dirzo, R.; Raven, P.H. Global state of biodiversity and loss. Annu. Rev. Env. Resour. 2003, 28, 137–167.
- Motesharrei, S.; Rivas, J.; Kalnay, E.; Asrar, G.R.; Busalacchi, A.J.; Cahalan, R.F.; Cane, M.A.; Colwell, R.R.; Feng, K.S.; Franklin, R.S.; et al. Modeling sustainability: Population, inequality, consumption, and bidirectional coupling of the Earth and Human Systems. Natl. Sci. Rev. 2016, 3, 470–494.
- Xu, W.; Xiao, Y.; Zhang, J.; Yang, W.; Zhang, L.; Hull, V.; Wang, Z.; Zheng, H.; Liu, J.; Polasky, S.; et al. Strengthening protected areas for biodiversity and ecosystem services in China. Proc. Natl. Acad. Sci. USA 2017, 114, 1601–1606.
- Watson, J.E.M.; Dudley, N.; Segan, D.B.; Hockings, M. The performance and potential of protected areas. Nature 2014, 515, 67–73.
- Secretariat of the Convention on Biological Diversity. Global Biodiversity Outlook 5; World Trade Centre: Montreal, QC, Canada, 2020; pp. 5–19.
- Gray, C.L.; Hill, S.; Newbold, T.; Hudson, L.N.; Börger, L.; Contu, S.; Hoskins, A.J.; Ferrier, S.; Purvis, A.; Scharlemann, J. Local biodiversity is higher inside than outside terrestrial protected areas worldwide. Nat. Commun. 2016, 7, 12306.
- Leberger, R.; Rosa, I.M.D.; Guerra, C.A.; Wolf, F.; Pereira, H.M. Global patterns of forest loss across IUCN categories of protected areas. Biol. Conserv. 2020, 241, 108299.
- Joppa, L.N.; Pfaff, A. Global protected area impacts. Proc. R. Soc. 2011, 278, 1633–1638.
- Chen, Y.; Zhang, J.; Jiang, J.; Nielsen, S.E.; He, F. Assessing the effectiveness of China’s protected areas to conserve current and future amphibian diversity. Divers. Distrib. 2017, 23, 146–157.
- Terraube, J.; Van Doninck, J.; Helle, P.; Cabeza, M. Assessing the effectiveness of a national protected area network for carnivore conservation. Nat. Commun. 2020, 11, 2957.
- Tammeleht, E.; Kull, A.; Parna, K. Assessing the importance of protected areas in human-dominated lowland for brown bear (Ursus arctos) winter denning. Mammal Res. 2020, 65, 105–115.
- Jordaan, M.S.; Chakona, A.; van der Colff, D. Protected Areas and Endemic Freshwater Fishes of the Cape Fold Ecoregion: Missing the Boat for Fish Conservation? Front. Environ. Sci. 2020, 8, 502042.
- Zeng, J.; Chen, T.; Yao, X.; Chen, W. Do Protected Areas Improve Ecosystem Services? A Case Study of Hoh Xil Nature Reserve in Qinghai-Tibetan Plateau. Remote Sens. 2020, 12, 471.
- Benavidez-Silva, C.; Jensen, M.; Pliscoff, P. Future Scenarios for Land Use in Chile: Identifying Drivers of Change and Impacts over Protected Area System. Land 2021, 10, 408.
- Vukomanovic, J.; Singh, K.K.; Vogler, J.B.; Meentemeyer, R.K. Protection status and proximity to public-private boundaries influence land use intensification near US parks and protected areas. Conserv. Sci. Pract. 2020, 2, e190.
- Poor, E.E.; Jati, V.I.M.; Imron, M.A.; Kelly, M.J. The road to deforestation: Edge effects in an endemic ecosystem in Sumatra, Indonesia. PLoS ONE 2019, 14, e0217540.
- Broder, L.; Tatin, L.; Danielczak, A.; Seibel, T.; Hochkirch, A. Intensive grazing as a threat in protected areas: The need for adaptive management to protect the Critically Endangered Crau plain grasshopper Prionotropis rhodanica. Oryx 2019, 53, 239–246.
- Prowse, T.A.A.; O’Connor, P.J.; Collard, S.J.; Rogers, D.J. Eating away at protected areas: Total grazing pressure is undermining public land conservation. Glob. Ecol. Conserv. 2019, 20, e00754.
- Andrade-Nunez, M.J.; Aide, T.M. Using nighttime lights to assess infrastructure expansion within and around protected areas in South America. Environ. Res. Commun. 2020, 2, 021002.
- Li, G.Y.; Gao, J.X.; Li, L.Z.; Hou, P. Human pressure dynamics in protected areas of China based on nighttime light. Glob. Ecol. Conser. 2020, 24, e01222.
- Sanderson, E.W.; Jaiteh, M.; Levy, M.A.; Redford, K.H.; Wannebo, A.V.; Woolmer, G. The Human Footprint and the Last of the Wild. BioScience 2002, 52, 891–904.
- Venter, O.; Sanderson, E.W.; Magrach, A.; Allan, J.R.; Beher, J.; Jones, K.R.; Possingham, H.P.; Laurance, W.F.; Wood, P.; Fekete, B.M.; et al. Global terrestrial Human Footprint maps for 1993 and 2009. Sci. Data 2016, 3, 160067.
- Venter, O.; Sanderson, E.W.; Magrach, A.; Allan, J.R.; Beher, J.; Jones, K.R.; Possingham, H.P.; Laurance, W.F.; Wood, P.; Fekete, B.M.; et al. Sixteen years of change in the global terrestrial human footprint and implications for biodiversity conservation. Nat. Commun 2016, 7, 12558.
- Li, S.; Wu, J.; Gong, J.; Li, S. Human footprint in Tibet: Assessing the spatial layout and effectiveness of nature reserves. Sci. Total Environ. 2018, 621, 18–29.
- Yin, L.; Dai, E.F.; Zheng, D.; Wang, Y.H.; Ma, L.; Tong, M. Spatio-temporal analysis of the human footprint in the Hengduan Mountain region: Assessing the effectiveness of nature reserves in reducing human impacts. J. Geogr. Sci. 2020, 30, 1140–1154.
- Tapia-Armijos, M.F.; Homeier, J.; Draper Munt, D. Spatio-temporal analysis of the human footprint in South Ecuador: Influence of human pressure on ecosystems and effectiveness of protected areas. Appl. Geogr. 2017, 78, 22–32.
- Karimi, A.; Jones, K. Assessing national human footprint and implications for biodiversity conservation in Iran. Ambio 2020, 49, 1506–1518.
- Martinuzzi, S.; Radeloff, V.C.; Pastur, G.M.; Rosas, Y.M.; Lizarraga, L.; Politi, N.; Rivera, L.; Herrera, A.H.; Silveira, E.M.O.; Olah, A.; et al. Informing forest conservation planning with detailed human footprint data for Argentina. Glob. Ecol. Conserv. 2021, 31, e01787.
- Geldmann, J.; Joppa, L.N.; Burgess, N.D. Mapping change in human pressure globally on land and within protected areas. Conserv. Biol. 2014, 28, 1604–1616.
- Jones, K.R.; Venter, O.; Fuller, R.A.; Allan, J.R.; Maxwell, S.L.; Negret, P.J.; Watson, J.E.M. One-third of global protected land is under intense human pressure. Science 2018, 360, 788–791.
More
Information
Subjects:
Area Studies
Contributor
MDPI registered users' name will be linked to their SciProfiles pages. To register with us, please refer to https://encyclopedia.pub/register
:
View Times:
1.1K
Entry Collection:
Environmental Sciences
Revisions:
3 times
(View History)
Update Date:
30 Dec 2021
Table of Contents


Notice
You are not a member of the advisory board for this topic. If you want to update advisory board member profile, please contact office@encyclopedia.pub.
OK
Confirm
Only members of the Encyclopedia advisory board for this topic are allowed to note entries. Would you like to become an advisory board member of the Encyclopedia?
Yes
No
${ textCharacter }/${ maxCharacter }
Submit
Cancel
Back
Comments
${ item }
|
${ item.createdUser.fullName }
${ item.createdAt }
${ item.vote }
${ item.reply }
Delete
${ reply.createdUser.fullName }
${ reply.createdAt }
${ reply.vote }
Delete
There is no reply to this comment~
${ item.replyTextCharacter }/${ item.replyMaxCharacter }
Submit
Cancel
More
No more~
There is no comment~
${ textCharacter }/${ maxCharacter }
Submit
Cancel
${ selectedItem.replyTextCharacter }/${ selectedItem.replyMaxCharacter }
Submit
Cancel
Confirm
Are you sure to Delete?
Yes
No