Your browser does not fully support modern features. Please upgrade for a smoother experience.
Submitted Successfully!
 +1 credit
Thank you for your contribution! You can also upload a video entry or images related to this topic.
For video creation, please contact our Academic Video Service.
| Version | Summary | Created by | Modification | Content Size | Created at | Operation |
|---|---|---|---|---|---|---|
| 1 | Sungchan Gwark | + 1661 word(s) | 1661 | 2021-12-23 08:01:25 | | | |
| 2 | Dean Liu | Meta information modification | 1661 | 2021-12-27 01:40:14 | | |
Video Upload Options
We provide professional Academic Video Service to translate complex research into visually appealing presentations. Would you like to try it?
Cite
If you have any further questions, please contact Encyclopedia Editorial Office.
Gwark, S. Application of Plasma Proteome Signature in Breast Cancer. Encyclopedia. Available online: https://encyclopedia.pub/entry/17563 (accessed on 22 July 2026).
Gwark S. Application of Plasma Proteome Signature in Breast Cancer. Encyclopedia. Available at: https://encyclopedia.pub/entry/17563. Accessed July 22, 2026.
Gwark, Sungchan. "Application of Plasma Proteome Signature in Breast Cancer" Encyclopedia, https://encyclopedia.pub/entry/17563 (accessed July 22, 2026).
Gwark, S. (2021, December 26). Application of Plasma Proteome Signature in Breast Cancer. In Encyclopedia. https://encyclopedia.pub/entry/17563
Gwark, Sungchan. "Application of Plasma Proteome Signature in Breast Cancer." Encyclopedia. Web. 26 December, 2021.
Copy Citation
The prognostic impact of plasma protein biomarkers in breast cancer patients treated with neoadjuvant chemotherapy (NCT) was evaluated using a proteomics approach. Three biomarkers were identified among differentially expressed proteins. The plasma concentration of APOC3 was higher in the pathological complete response (pCR) group, whereas MBL2, ENG, and P4HB were upregulated in the non-pCR group.
liquid biopsy
breast cancer
neoadjuvant chemotherapy
proteome
LC-MS/MS
1. Introduction
Neoadjuvant chemotherapy (NCT) provides several benefits for locally advanced breast cancer (BC) patients. Down-staging of tumors may increase the probability of breast conservation with better cosmesis [1][2][3]. Additionally, it allows in vivo monitoring of the response of tumors to therapy, which could be helpful for predicting pathological responses [4][5][6][7][8][9]. Tumors that respond well to a given therapy show better outcomes, and pathological complete response (pCR) is a surrogate factor for survival in the neoadjuvant setting [10][11][12]. However, the value of pCR for predicting prognosis in different subtypes of BC, especially in estrogen receptor (ER)-positive and HER2-negative tumors, is under debate. Because of substantial inconsistencies between clinical, radiological, and pathologic responses [13], extensive clinical/laboratory research has focused on achieving a more accurate prediction of the treatment response.
2. Proteome Results from Clinical Plasma Samples by LC-MS/MS
A workflow was established for biomarker identification in BC patients with or without pCR after NCT (Figure 1A). To identify prognostic marker candidates for pCR, clinical plasma samples were collected from 51 BC patients, including 15 with and 36 without pCR after NCT. Depleted plasma samples from the 51 study participants were used to analyze constitutive proteins via single LC-MS/MS runs, which led to the identification of 594 proteins. Among them, 548 proteins were quantified in one or more samples using a label-free quantification method. Among these, four relatively stable abundant proteins (C6, HPX, KNG1, and SERPINC1) were used to normalize the raw abundance of the other candidates, which were quantified in at least 80% of the samples [14]. Before normalization, missing values were imputed [15]. After normalization, 254 common proteins out of 305 proteins showed a significant positive correlation with the plasma concentrations of the published Plasma Proteome Database [16] (ρ = 0.657; Pearson’s correlation coefficient, permutation p < 0.001). Partial least squares-discriminant analysis (PLS-DA) indicated that the pCR and non-pCR groups were separated into two components, component 1 (6%) and component 2 (17%) (Figure 1B). VIP score-ordered contributions are shown in Figure 1C. The top 26 proteins had VIP scores >1.5. Statistical analysis was performed to identify pCR prediction marker candidates. Four signature proteins annotated by molecular functional terms and processes were selected for building the clinical model. Finally, three biomarkers were selected and used in the survival analysis, including recurrence, death, and metastasis events.
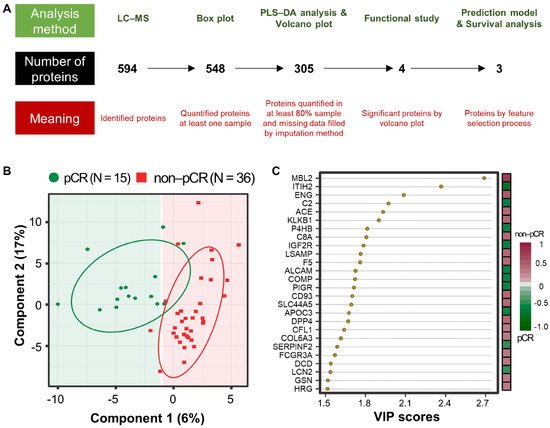
Figure 1. Analysis workflow and partial least-squares discriminant analysis (PLS-DA) of plasma proteomes in 51 breast cancer (BC) patients. (A) The analysis method is shown at the top, the number of proteins is shown in the middle, and the meaning of the step is shown at the bottom. PLS-DA score plot (B) and top26 variable importance in projection (VIP) score (>1.5) plot derived from PLS-DA analysis (C) in 15 patients with pathological complete response (pCR; green) after neoadjuvant therapy and 36 patients with non-pCR (red).
3. Differentially Abundant Plasma Proteins between pCR and Non-pCR BC Patients
Statistical analysis was performed using the Student’s t-test to identify differentially abundant plasma proteins (DAPs) between the two groups. A volcano plot was drawn to represent log2 fold-changes against negative log10 p-values. We identified a single upregulated protein in the pCR group and three proteins in the non-pCR group (p < 0.05 and |fold-change| > 2; Figure 2A). We examined whether the abundance of the four proteins was related to the subtypes as confounding factors. Each protein was stratified by pCR status, and the quantitative differences according to subtype (HER2 and HR positive or negative) were statistically analyzed (p > 0.05). The results confirmed that the subtype did not affect the four proteins as a confounding factor.
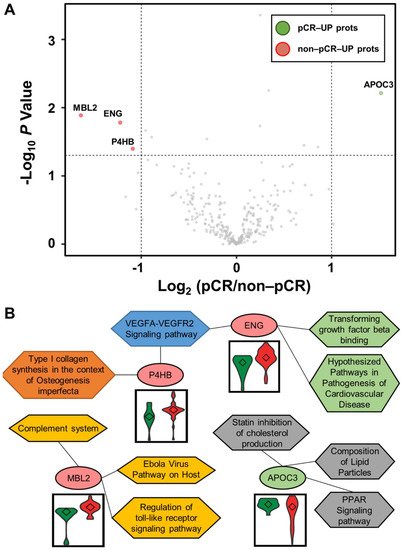
Figure 2. Volcano plot for DAPs altered by pathological complete response (pCR) and functional interpretation. (A) Log2 fold changes and the corresponding p-values of all proteins between pCR group (n = 15) and non-pCR group (n = 36) are presented as volcano plot. Proteins upregulated with more than a twofold change with a p-value < 0.05 are depicted in red circles and those downregulated with identical fold change and p-value are in green circles. Gray circles show plasma proteins that did not show statistically significant differences. (B) Association between WikiPathways and proteins, and violin plots of the corresponding proteins between the two groups (pCR: green; non-pCR: red).
Functional annotation of the proteins was performed using Enrichr [17]. Significant differences between the two groups were identified using WikiPathways (Figure 2B). P4HB and ENG were involved in the “VEGFA-VEGFR2 signaling pathway”. ENG was also involved in “transforming growth factor beta binding” and “hypothesized pathways in pathogenesis of cardiovascular disease”. P4HB was also associated with “type I collagen synthesis in the context of osteogenesis imperfecta”. MBL2 was related to “complement system”, “Ebola virus pathway on host”, and “regulation of toll-like receptor signaling pathway”. APOC3 was linked to “PPAR signaling pathway”, “composition of lipid particles”, and “statin inhibition of cholesterol production”. In addition, we focused on the TNBC subtype, which shows the greatest long-term clinical benefit from pCR in BC [18]. Statistical analysis was performed as described above by dividing patients into pCR and non-pCR groups only in the TNBC subtype. In all BC patients, one highly abundant protein, MBL2, was identified in the non-pCR group, and three highly abundant proteins, DCD, KNG1-2, and TLN1, were identified in the non-pCR group. Two highly abundant proteins, ALCAM and MAN1A1, were identified in the pCR group.
4. Multivariate Analysis for Predicting pCR Outcome
Multivariate analysis was performed using ML classifiers based on random forest (RF) [19] and SVM [20] to improve the predictive performance for distinguishing pCR from non-pCR patients. First, feature selection was performed with the four significant proteins by AUC-based RF backward elimination [21] according to a probability of selection >0.5 and independently performed 305 proteins as input. The RF and SVM models were built with three proteins (MBL2, ENG, and P4HB). To avoid overfitting, threefold cross-validation was performed three times to generate 10,000 decision trees from the RF model, and a linear SVM model was applied. To confirm the robustness of the ML models, the sample was randomly trisected 100 times, and the model was then built with 2/3 of the sample and validated with 1/3 of the sample. Evaluation of the performance of the classifiers showed that the median AUC values for SVM and RF were 0.861 (95% CI: 0.845–0.873) and 0.861 (95% CI: 0.830–0.867), respectively (Figure 3).
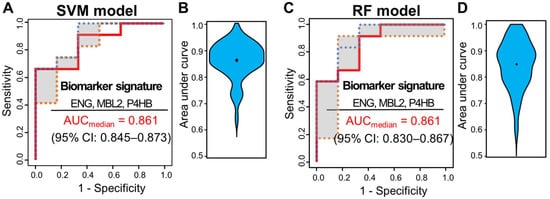
Figure 3. ROC curves of SVM and RF classifiers for three selected proteins (ENG, MBL2, and P4HB). Capability of the two classifiers in a set of 51 samples, 15 from patients with pCR and 36 from patients with non-pCR. (A) ROC curves of SVM classifiers generated through 100 repeats of threefold cross-validation steps. (B) ROC curves of SVM classifiers generated through 100 repeats of threefold cross-validation steps. ROC curves were obtained by plotting the 25th, 50th, and 75th quantiles of the sensitivities for each value of 1-specificity. (B) Violin plots of 100 area under the curve (AUC) values in the SVM model. (C) ROC curves of RF classifiers generated through 100 repeats of threefold cross-validation steps. ROC curves were obtained by plotting the 25th, 50th, and 75th quantiles of the sensitivities for each value of 1-specificity. (D) Violin plots of 100 AUC values in the RF model.
The three plasma biomarkers were also expressed in tissues of BC patients. The mRNA expression levels of five proteins obtained from BC tissues by fine needle aspiration prior to NCT were analyzed. The data were obtained from two publicly available GEO datasets (GSE22513 [22][23][24] and GSE22093 [25][26]). ML models were built as described above. In GSE22513, the median AUC values for SVM and RF were 0.631 (95% CI: 0.613–0.643) and 0.646 (95% CI: 0.633–0.669), respectively. In GSE22093, the median AUC values for SVM and RF were 0.709 (95% CI: 0.684–0.713) and 0.658 (95% CI: 0.645–0.666), respectively.
5. Survival Analysis
During a median follow-up of 52.0 months, 15 relapses (29.4%) and eight deaths (15.7%) were observed. To determine the correlation of single plasma proteins with long-term clinical indicators such as DFS, OS, and DMFS, we performed univariate survival analysis for the three proteins in the model (MBL2, ENG, and P4HB), and the remaining 302 proteins were quantified. The Kaplan–Meier method was used to select the cutoff values based on the maximally selected rank statistics. At first, pCR was statistically a better prognostic factor than non-PCR for DFS, OS, and DMFS (log-rank test p < 0.05). MBL2 and P4HB for DFS, P4HB for OS, and MBL2 for DMFS were statistically significant in dividing patients into low-risk and high-risk groups (log-rank test p < 0.05; Figure 4). Among the remaining 302 proteins quantified, the prognosis with respect to the three survival results in the two patient groups was separated by a threshold of protein quantification values: 84 proteins for DFS, 46 proteins for OS, and 96 proteins for DMFS were statistically significant for classifying patients into high-risk and low-risk groups (log-rank test p < 0.05). We also analyzed the prognosis of patients according to Miller-Payne grades in the patients with partial response, but couldn’t find a significant correlation. In the multivariate Cox analysis of survival with following factors: patient age at diagnosis; clinical tumor stage; nodal status; hormone receptor (HR) status; and HER2 status, no factor showed significant correlation. However, in DMFS analysis with proteins, MBL2 was identified as the only consistent risk factor (HR: 9.65, 95% CI: 2.10–44.31, p = 0.004). In other survival analyses including DFS and OS, none of the proteins demonstrated a significant correlation. All three protein (MBL2, ENG, P4HB) levels were significantly increased as the pathological stages elevated.
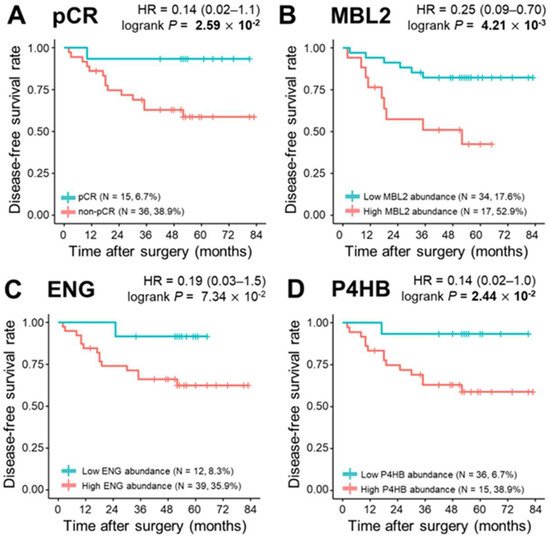
Figure 4. Kaplan–Meier plots of pathological complete response (pCR) and three proteins, MBL2, ENG, and P4HB. (A) Categorization of patients into pCR and non—pCR risk groups (pCR, n = 15, 6.7%; non-pCR, n = 36, 38.9%; p = 2.59 × 10⁻²). Classification of patients into risk groups according to (B) MBL2 abundance: low abundance group (n = 34, 17.6%) and high abundance group (n = 17, 52.9%), p = 4.21 × 10⁻³; (C) ENG abundance: low abundance group (n = 12, 8.3%) and high abundance group (n = 39, 35.9%), p = 7.34 × 10⁻²; and (D) P4HB abundance: low abundance group (n = 36, 6.7%) and high abundance group (n = 15, 38.9%), p = 2.44 × 10⁻². Statistical significance was determined using the log-rank test. p-values < 0.05 are displayed in bold.
References
- Fisher, B.; Brown, A.; Mamounas, E.; Wieand, S.; Robidoux, A.; Margolese, R.G.; Cruz, A.B., Jr.; Fisher, E.R.; Wickerham, D.L.; Wolmark, N.; et al. Effect of preoperative chemotherapy on local-regional disease in women with operable breast cancer: Findings from National Surgical Adjuvant Breast and Bowel Project B-18. J. Clin. Oncol. 1997, 15, 2483–2493.
- van der Hage, J.A.; van de Velde, C.J.; Julien, J.P.; Tubiana-Hulin, M.; Vandervelden, C.; Duchateau, L. Preoperative chemotherapy in primary operable breast cancer: Results from the European Organization for Research and Treatment of Cancer trial 10902. J. Clin. Oncol. 2001, 19, 4224–4237.
- Caudle, A.S.; Bedrosian, I.; Milton, D.R.; DeSnyder, S.M.; Kuerer, H.M.; Hunt, K.K.; Mittendorf, E.A. Use of Sentinel Lymph Node Dissection After Neoadjuvant Chemotherapy in Patients with Node-Positive Breast Cancer at Diagnosis: Practice Patterns of American Society of Breast Surgeons Members. Ann. Surg. Oncol. 2017, 10, 2925–2934.
- Meisamy, S.; Bolan, P.J.; Baker, E.H.; Bliss, R.L.; Gulbahce, E.; Everson, L.I.; Nelson, M.T.; Emory, T.H.; Tuttle, T.M.; Yee, D. Neoadjuvant chemotherapy of locally advanced breast cancer: Predicting response with in vivo 1H MR spectroscopy—A pilot study at 4 T. Radiology 2004, 233, 424–431.
- Cerussi, A.; Hsiang, D.; Shah, N.; Mehta, R.; Durkin, A.; Butler, J.; Tromberg, B.J. Predicting response to breast cancer neoadjuvant chemotherapy using diffuse optical spectroscopy. Proc. Natl. Acad. Sci. USA 2007, 104, 4014–4019.
- Sharma, U.; Danishad, K.K.A.; Seenu, V.; Jagannathan, N.R. Longitudinal study of the assessment by MRI and diffusion-weighted imaging of tumor response in patients with locally advanced breast cancer undergoing neoadjuvant chemotherapy. NMR Biomed. Int. J. Devoted Dev. Appl. Magn. Reson. In Vivo 2009, 22, 104–113.
- Manton, D.; Chaturvedi, A.; Hubbard, A.; Lind, M.; Lowry, M.; Maraveyas, A.; Pickles, M.; Tozer, D.; Turnbull, L. Neoadjuvant chemotherapy in breast cancer: Early response prediction with quantitative MR imaging and spectroscopy. Br. J. Cancer 2006, 94, 427.
- Rajan, R.; Poniecka, A.; Smith, T.L.; Yang, Y.; Frye, D.; Pusztai, L.; Fiterman, D.J.; Gal-Gombos, E.; Whitman, G.; Rouzier, R. Change in tumor cellularity of breast carcinoma after neoadjuvant chemotherapy as a variable in the pathologic assessment of response. Cancer Interdiscip. Int. J. Am. Cancer Soc. 2004, 100, 1365–1373.
- Baek, H.-M.; Chen, J.-H.; Nie, K.; Yu, H.J.; Bahri, S.; Mehta, R.S.; Nalcioglu, O.; Su, M.-Y. Predicting pathologic response to neoadjuvant chemotherapy in breast cancer by using MR imaging and quantitative 1H MR spectroscopy. Radiology 2009, 251, 653–662.
- Liedtke, C.; Mazouni, C.; Hess, K.R.; André, F.; Tordai, A.; Mejia, J.A.; Symmans, W.F.; Gonzalez-Angulo, A.M.; Hennessy, B.; Green, M. Response to neoadjuvant therapy and long-term survival in patients with triple-negative breast cancer. J. Clin. Oncol. 2008, 26, 1275–1281.
- Houssami, N.; Macaskill, P.; von Minckwitz, G.; Marinovich, M.L.; Mamounas, E. Meta-analysis of the association of breast cancer subtype and pathologic complete response to neoadjuvant chemotherapy. Eur. J. Cancer 2012, 48, 3342–3354.
- Carey, L.A.; Dees, E.C.; Sawyer, L.; Gatti, L.; Moore, D.T.; Collichio, F.; Ollila, D.W.; Sartor, C.I.; Graham, M.L.; Perou, C.M. The triple negative paradox: Primary tumor chemosensitivity of breast cancer subtypes. Clin. Cancer Res. 2007, 13, 2329–2334.
- Schott, A.F.; Roubidoux, M.A.; Helvie, M.A.; Hayes, D.F.; Kleer, C.G.; Newman, L.A.; Pierce, L.J.; Griffith, K.A.; Murray, S.; Hunt, K.A.; et al. Clinical and radiologic assessments to predict breast cancer pathologic complete response to neoadjuvant chemotherapy. Breast Cancer Res. Treat. 2005, 92, 231–238.
- Dziura, J.D.; Post, L.A.; Zhao, Q.; Fu, Z.; Peduzzi, P. Strategies for dealing with missing data in clinical trials: From design to analysis. Yale J. Biol. Med. 2013, 86, 343–358.
- Karpievitch, Y.V.; Dabney, A.R.; Smith, R.D. Normalization and missing value imputation for label-free LC-MS analysis. BMC Bioinform. 2012, 13 (Suppl. 16), S5.
- Nanjappa, V.; Thomas, J.K.; Marimuthu, A.; Muthusamy, B.; Radhakrishnan, A.; Sharma, R.; Ahmad Khan, A.; Balakrishnan, L.; Sahasrabuddhe, N.A.; Kumar, S.; et al. Plasma Proteome Database as a resource for proteomics research: 2014 update. Nucleic Acids Res. 2014, 42, D959–D965.
- Kuleshov, M.V.; Jones, M.R.; Rouillard, A.D.; Fernandez, N.F.; Duan, Q.; Wang, Z.; Koplev, S.; Jenkins, S.L.; Jagodnik, K.M.; Lachmann, A.; et al. Enrichr: A comprehensive gene set enrichment analysis web server 2016 update. Nucleic Acids Res. 2016, 44, W90–W97.
- Cortazar, P.; Zhang, L.; Untch, M.; Mehta, K.; Costantino, J.P.; Wolmark, N.; Bonnefoi, H.; Cameron, D.; Gianni, L.; Valagussa, P.; et al. Pathological complete response and long-term clinical benefit in breast cancer: The CTNeoBC pooled analysis. Lancet 2014, 384, 164–172.
- Breiman, L. Random forests. Mach. Learn. 2001, 45, 5–32.
- Cortes, C.; Vapnik, V. Support-Vector Networks. Mach. Learn. 1995, 20, 273–297.
- Calle, M.L.; Urrea, V.; Boulesteix, A.L.; Malats, N. AUC-RF: A new strategy for genomic profiling with random forest. Hum. Hered. 2011, 72, 121–132.
- Adams, S.; Chakravarthy, A.B.; Donach, M.; Spicer, D.; Lymberis, S.; Singh, B.; Bauer, J.A.; Hochman, T.; Goldberg, J.D.; Muggia, F.; et al. Preoperative concurrent paclitaxel-radiation in locally advanced breast cancer: Pathologic response correlates with five-year overall survival. Breast Cancer Res. Treat. 2010, 124, 723–732.
- Bauer, J.A.; Chakravarthy, A.B.; Rosenbluth, J.M.; Mi, D.; Seeley, E.H.; De Matos Granja-Ingram, N.; Olivares, M.G.; Kelley, M.C.; Mayer, I.A.; Meszoely, I.M.; et al. Identification of markers of taxane sensitivity using proteomic and genomic analyses of breast tumors from patients receiving neoadjuvant paclitaxel and radiation. Clin. Cancer Res. 2010, 16, 681–690.
- Lehmann, B.D.; Bauer, J.A.; Chen, X.; Sanders, M.E.; Chakravarthy, A.B.; Shyr, Y.; Pietenpol, J.A. Identification of human triple-negative breast cancer subtypes and preclinical models for selection of targeted therapies. J. Clin. Investig. 2011, 121, 2750–2767.
- Iwamoto, T.; Bianchini, G.; Booser, D.; Qi, Y.; Coutant, C.; Shiang, C.Y.; Santarpia, L.; Matsuoka, J.; Hortobagyi, G.N.; Symmans, W.F.; et al. Gene pathways associated with prognosis and chemotherapy sensitivity in molecular subtypes of breast cancer. J. Natl. Cancer Inst. 2011, 103, 264–272.
- Shen, K.; Song, N.; Kim, Y.; Tian, C.; Rice, S.D.; Gabrin, M.J.; Symmans, W.F.; Pusztai, L.; Lee, J.K. A systematic evaluation of multi-gene predictors for the pathological response of breast cancer patients to chemotherapy. PLoS ONE 2012, 7, e49529.
More
Information
Subjects:
Oncology
Contributor
MDPI registered users' name will be linked to their SciProfiles pages. To register with us, please refer to https://encyclopedia.pub/register
:
View Times:
971
Entry Collection:
Peptides for Health Benefits
Revisions:
2 times
(View History)
Update Date:
28 Dec 2021
Table of Contents


Notice
You are not a member of the advisory board for this topic. If you want to update advisory board member profile, please contact office@encyclopedia.pub.
OK
Confirm
Only members of the Encyclopedia advisory board for this topic are allowed to note entries. Would you like to become an advisory board member of the Encyclopedia?
Yes
No
${ textCharacter }/${ maxCharacter }
Submit
Cancel
Back
Comments
${ item }
|
${ item.createdUser.fullName }
${ item.createdAt }
${ item.vote }
${ item.reply }
Delete
${ reply.createdUser.fullName }
${ reply.createdAt }
${ reply.vote }
Delete
There is no reply to this comment~
${ item.replyTextCharacter }/${ item.replyMaxCharacter }
Submit
Cancel
More
No more~
There is no comment~
${ textCharacter }/${ maxCharacter }
Submit
Cancel
${ selectedItem.replyTextCharacter }/${ selectedItem.replyMaxCharacter }
Submit
Cancel
Confirm
Are you sure to Delete?
Yes
No