 +1 credit
| Version | Summary | Created by | Modification | Content Size | Created at | Operation |
|---|---|---|---|---|---|---|
| 1 | darius wen shuo koh | + 1702 word(s) | 1702 | 2021-12-10 10:16:46 |
Video Upload Options
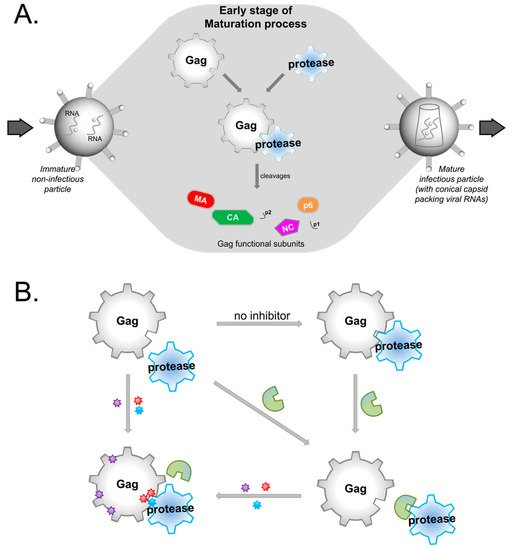
HIV protease inhibitors against the viral protease are often hampered by drug resistance mutations in protease and in the viral substrate Gag. To overcome this drug resistance and inhibit viral maturation, targeting Gag alongside protease rather than targeting protease alone may be more efficient.
1. Introduction
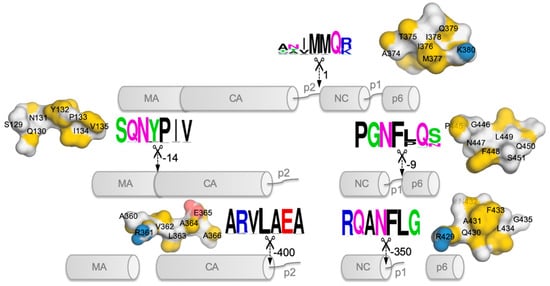
2. Possible Targets in Gag
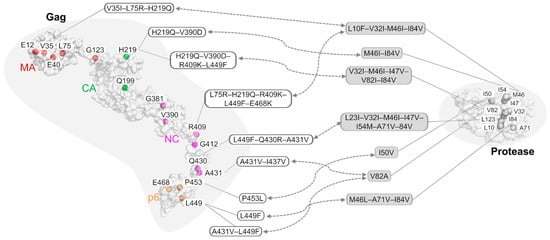
3. The Role of Gag Mutations in Restoring Gag–Protease Synergy in PI Resistance
|
|
|
||
|---|---|---|---|
|
Inhibitor |
Strain or Lab Clone |
Mutations on Gag |
Mutations on Protease |
|
Amprenavir |
HIV-1 NL4-3 (pNL4-3) |
V35I–L75R–H219Q |
L10F–V32I–M46I–I84V |
|
Amprenavir |
HIV-1 NL4-3 (pNL4-3) |
L75R–H219Q–R409K–L449F–E468K |
L10F–V32I–M46I–I84V |
|
Amprenavir |
HIV-1 NL4-3 (pNL4-3) |
E12K–V35I–L75R–H219Q–V390D–R409K–L449F–E468K |
L10F–V32I–M46I–I54M–A71V–I84V |
|
JE–2147 |
HIV-1 NL4-3 (pNL4-3) |
H219Q–V390D |
M46I–I84V |
|
JE–2147 |
HIV-1 NL4-3 (pNL4-3) |
H219Q–V390D–R409K–L449F |
V32I–M46I–I47V–V82I–I84V |
|
KNI–272 |
HIV-1 NL4-3 (pNL4-3) |
V35I–E40K–G123E–H219Q–G381S–R409K–A431V |
V32I–M46I–A71V–V82I–I84V |
|
UIC–94003 |
HIV-1 NL4-3 (pNL4-3) |
E12K–E40K–G123E–Q199H–H219Q–R409K–G412D–L449F–E468K |
L10F–M46I–I50V–A71V |
|
Amprenavir |
HIV-1 HXB2 |
P453L |
I50V |
|
BILA–1906BS |
HIV-1 strain IIIB |
L449F |
M46L–A71V–I84V |
|
BILA–2185BS |
HIV-1 strain IIIB |
L449F–Q430R–A431V |
L23I–V32I–M46I–I47V–I54M–A71V–I84V |
|
Indinavir |
HIV-1 pNL4.3 |
A431V–I437V |
V82A |
|
Ritonavir/Saquinavir |
HIV-1 subtype B # |
A431V–L449F |
I84V |


References
- Adnan Bashir Bhatti; Muhammad Usman; Venkataramana Kandi; Current Scenario of HIV/AIDS, Treatment Options, and Major Challenges with Compliance to Antiretroviral Therapy. Cureus 2016, 8, e515, 10.7759/cureus.515.
- Mohammad A. Rai; Sam Pannek; Carl J. Fichtenbaum; Emerging reverse transcriptase inhibitors for HIV-1 infection. Expert Opinion on Emerging Drugs 2018, 23, 149-157, 10.1080/14728214.2018.1474202.
- Ron Zhi-Hui Chiang; Samuel Ken-En Gan; Chinh Tran-To Su; A computational study for rational HIV-1 non-nucleoside reverse transcriptase inhibitor selection and the discovery of novel allosteric pockets for inhibitor design. Bioscience Reports 2018, 38, 1, 10.1042/bsr20171113.
- Kwok-Fong Chan; Chinh Su; Alexander Krah; Ser-Xian Phua; Joshua Yeo; Wei-Li Ling; Peter Bond; Samuel Gan; An Alternative HIV-1 Non-Nucleoside Reverse Transcriptase Inhibition Mechanism: Targeting the p51 Subunit. Molecules 2020, 25, 5902, 10.3390/molecules25245902.
- Zeger Debyser; Gerlinde VanSant; Anne Bruggemans; Julie Janssens; Frauke Christ; Insight in HIV Integration Site Selection Provides a Block-and-Lock Strategy for a Functional Cure of HIV Infection. Viruses 2018, 11, 12, 10.3390/v11010012.
- Charlotte Charpentier; Diane Descamps; Resistance to HIV Integrase Inhibitors: About R263K and E157Q Mutations. Viruses 2018, 10, 41, 10.3390/v10010041.
- Graziella Favarato; Claire L. Townsend; Heather Bailey; Helen Peters; Pat A. Tookey; Graham P. Taylor; Claire Thorne; Protease inhibitors and preterm delivery. AIDS 2018, 32, 243-252, 10.1097/qad.0000000000001694.
- Yong Wang; Zhengtong Lv; Yuan Chu; HIV protease inhibitors: a review of molecular selectivity and toxicity. HIV/AIDS - Research and Palliative Care 2015, 7, 95-104, 10.2147/hiv.s79956.
- Louise Castain; Marine Perrier; Charlotte Charpentier; Romain Palich; Nathalie Desire; Marc Wirden; Diane Descamps; Sophie Sayon; Roland Landman; Marc-Antoine Valantin; et al.Véronique JolyGilles PeytavinYazdan YazdanpanahChristine KatlamaVincent CalvezAnne-Genevieve MarcelinEve Todesco New mechanisms of resistance in virological failure to protease inhibitors: selection of non-described protease, Gag and Gp41 mutations. Journal of Antimicrobial Chemotherapy 2019, 74, 2019-2023, 10.1093/jac/dkz151.
- Eric O. Freed; HIV-1 assembly, release and maturation. Nature Reviews Microbiology 2015, 13, 484-496, 10.1038/nrmicro3490.
- Arun K. Ghosh; Heather L. Osswald; Gary Prato; Recent Progress in the Development of HIV-1 Protease Inhibitors for the Treatment of HIV/AIDS. Journal of Medicinal Chemistry 2016, 59, 5172-5208, 10.1021/acs.jmedchem.5b01697.
- Eric O. Freed; HIV-1 Gag Proteins: Diverse Functions in the Virus Life Cycle. Virology 1998, 251, 1-15, 10.1006/viro.1998.9398.
- Steve Pettit; M D Moody; R S Wehbie; A H Kaplan; P V Nantermet; C A Klein; R Swanstrom; The p2 domain of human immunodeficiency virus type 1 Gag regulates sequential proteolytic processing and is required to produce fully infectious virions. Journal of Virology 1994, 68, 8017-8027, 10.1128/jvi.68.12.8017-8027.1994.
- Moses Prabu-Jeyabalan; Ellen Nalivaika; Celia A. Schiffer; Substrate Shape Determines Specificity of Recognition for HIV-1 Protease: Analysis of Crystal Structures of Six Substrate Complexes. Structure 2002, 10, 369-381, 10.1016/s0969-2126(02)00720-7.
- Axel Fun; Annemarie Mj Wensing; Jens Verheyen; Monique Nijhuis; Human Immunodeficiency Virus gag and protease: partners in resistance. Retrovirology 2012, 9, 63-63, 10.1186/1742-4690-9-63.
- François Clavel; Fabrizio Mammano; Role of Gag in HIV Resistance to Protease Inhibitors. Viruses 2010, 2, 1411-1426, 10.3390/v2071411.
- Steve C Pettit; Jeffrey N Lindquist; Andrew H Kaplan; Ronald Swanstrom; Processing sites in the human immunodeficiency virus type 1 (HIV-1) Gag-Pro-Pol precursor are cleaved by the viral protease at different rates. Retrovirology 2005, 2, 66-66, 10.1186/1742-4690-2-66.
- Gavin E. Crooks; Gary Hon; John-Marc Chandonia; Steven E. Brenner; WebLogo: A Sequence Logo Generator: Figure 1. Genome Research 2004, 14, 1188-1190, 10.1101/gr.849004.
- Thomas Schneider; R. Michael Stephens; Sequence logos: a new way to display consensus sequences. Nucleic Acids Research 1990, 18, 6097-6100, 10.1093/nar/18.20.6097.
- Michele W. Tang; Robert W. Shafer; HIV-1 Antiretroviral Resistance. Drugs 2012, 72, e1-e25, 10.2165/11633630-000000000-00000.
- Kwok-Fong Chan; Stelios Koukouravas; Joshua Yi Yeo; Darius Wen-Shuo Koh; Samuel Ken-En Gan; Probability of change in life: Amino acid changes in single nucleotide substitutions. Biosystems 2020, 193-194, 104135, 10.1016/j.biosystems.2020.104135.
- E. Fumero; D. Podzamczer; New patterns of HIV-1 resistance during HAART. Clinical Microbiology and Infection 2003, 9, 1077-1084, 10.1046/j.1469-0691.2003.00730.x.
- Pierre Loulergue; Constance Delaugerre; Vincent Jullien; Jean-Paul Viard; Letter to the Editor [HIV Drug Resistance on HAART Despite an Undetectable Viral Load]. Current HIV Research 2011, 9, 623-624, 10.2174/157016211798998817.
- Michael F. Maguire; Rosario Guinea; Philip Griffin; Sarah Macmanus; Robert C. Elston; Josie Wolfram; Naomi Richards; Mary H. Hanlon; David J. T. Porter; Terri Wrin; et al.Neil ParkinMargaret TisdaleEric FurfineChris PetropoulosB. Wendy SnowdenJörg-Peter Kleim Changes in Human Immunodeficiency Virus Type 1 Gag at Positions L449 and P453 Are Linked to I50V Protease Mutants In Vivo and Cause Reduction of Sensitivity to Amprenavir and Improved Viral Fitness In Vitro. Journal of Virology 2002, 76, 7398-7406, 10.1128/jvi.76.15.7398-7406.2002.
- Axel Fun; Noortje M van Maarseveen; Jana Pokorná; Renée Em Maas; Pauline J Schipper; Jan Konvalinka; Monique Nijhuis; HIV-1 protease inhibitor mutations affect the development of HIV-1 resistance to the maturation inhibitor bevirimat. Retrovirology 2011, 8, 70-70, 10.1186/1742-4690-8-70.
- Art F. Y. Poon; Sergei L. Kosakovsky Pond; Douglas D. Richman; Simon Frost; Mapping Protease Inhibitor Resistance to Human Immunodeficiency Virus Type 1 Sequence Polymorphisms within Patients. Journal of Virology 2007, 81, 13598-13607, 10.1128/jvi.01570-07.
- Jose-Luis Blanco; Vici Varghese; Soo-Yon Rhee; Jose M. Gatell; Robert W. Shafer; HIV-1 Integrase Inhibitor Resistance and Its Clinical Implications. The Journal of Infectious Diseases 2011, 203, 1204-1214, 10.1093/infdis/jir025.
- Hiroaki Mitsuya; Kenji Maeda; Debananda Das; Arun K. Ghosh; Development of Protease Inhibitors and the Fight with Drug‐Resistant HIV‐1 Variants. A New Era of Catecholamines in the Laboratory and Clinic 2007, 56, 169-197, 10.1016/s1054-3589(07)56006-0.
- Joel E Gallant; Initial therapy of HIV infection. Journal of Clinical Virology 2002, 25, 317-333, 10.1016/s1386-6532(02)00024-0.
- Kimberly A. Barrie; Elena E. Perez; Susanna L. Lamers; William G. Farmerie; Ben M. Dunn; John W. Sleasman; Maureen M. Goodenow; Natural Variation in HIV-1 Protease, Gag p7 and p6, and Protease Cleavage Sites within Gag/Pol Polyproteins: Amino Acid Substitutions in the Absence of Protease Inhibitors in Mothers and Children Infected by Human Immunodeficiency Virus Type 1. Virology 1996, 219, 407-416, 10.1006/viro.1996.0266.
- Joon H. Park; Jane M. Sayer; Annie Aniana; Xiaxia Yu; Irene T. Weber; Robert W. Harrison; John M. Louis; Binding of Clinical Inhibitors to a Model Precursor of a Rationally Selected Multidrug Resistant HIV-1 Protease Is Significantly Weaker Than That to the Released Mature Enzyme. Biochemistry 2016, 55, 2390-2400, 10.1021/acs.biochem.6b00012.
- Yuqi Yu; Jinan Wang; Qiang Shao; Jiye Shi; Weiliang Zhu; Effects of drug-resistant mutations on the dynamic properties of HIV-1 protease and inhibition by Amprenavir and Darunavir. Scientific Reports 2015, 5, 10517, 10.1038/srep10517.
- Masaaki Nakashima; Hirotaka Ode; Koji Suzuki; Masayuki Fujino; Masami Maejima; Yuki Kimura; Takashi Masaoka; Junko Hattori; Masakazu Matsuda; Atsuko Hachiya; et al.Yoshiyuki YokomakuAtsuo SuzukiNobuhisa WatanabeWataru SugiuraYasumasa Iwatani Unique Flap Conformation in an HIV-1 Protease with High-Level Darunavir Resistance. Frontiers in Microbiology 2016, 7, 61, 10.3389/fmicb.2016.00061.
- Rajeswari Appadurai; Sanjib Senapati; Dynamical Network of HIV-1 Protease Mutants Reveals the Mechanism of Drug Resistance and Unhindered Activity. Biochemistry 2016, 55, 1529-1540, 10.1021/acs.biochem.5b00946.
- Chen-Hsiang Shen; Yu-Chung Chang; Johnson Agniswamy; Robert Harrison; Irene T. Weber; Conformational variation of an extreme drug resistant mutant of HIV protease. Journal of Molecular Graphics and Modelling 2015, 62, 87-96, 10.1016/j.jmgm.2015.09.006.
- Debra A. Ragland; Ellen A. Nalivaika; Madhavi N. L. Nalam; Kristina L. Prachanronarong; Hong Cao; Rajintha M. Bandaranayake; Yufeng Cai; Nese Kurt-Yilmaz; Celia A. Schiffer; Drug Resistance Conferred by Mutations Outside the Active Site through Alterations in the Dynamic and Structural Ensemble of HIV-1 Protease. Journal of the American Chemical Society 2014, 136, 11956-11963, 10.1021/ja504096m.
- Jeffrey D. Carter; Estrella G. Gonzales; Xi Huang; Adam Smith; Ian Mitchelle de Vera; Peter D'Amore; James R. Rocca; Maureen M. Goodenow; Ben M. Dunn; Gail E. Fanucci; et al. Effects of PRE and POST therapy drug-pressure selected mutations on HIV-1 protease conformational sampling. FEBS Letters 2014, 588, 3123-3128, 10.1016/j.febslet.2014.06.051.
- Xi Huang; Manuel D. Britto; Jamie L. Kear-Scott; Christopher D. Boone; James R. Rocca; Carlos Simmerling; Robert Mckenna; Michael Bieri; Paul Gooley; Ben M. Dunn; et al.Gail E. Fanucci The Role of Select Subtype Polymorphisms on HIV-1 Protease Conformational Sampling and Dynamics. Journal of Biological Chemistry 2014, 289, 17203-17214, 10.1074/jbc.m114.571836.
- Rui Duan; Raudah Lazim; Dawei Zhang; Understanding the basis of I50V-induced affinity decrease in HIV-1 protease via molecular dynamics simulations using polarized force field. Journal of Computational Chemistry 2015, 36, 1885-1892, 10.1002/jcc.24020.
- Dinler Antunes; Mauricio Menegatti Rigo; Marialva Sinigaglia; Rúbia M. De Medeiros; Dennis M. Junqueira; Sabrina E. M. Almeida; Gustavo F. Vieira; New Insights into the In Silico Prediction of HIV Protease Resistance to Nelfinavir. PLOS ONE 2014, 9, e87520, 10.1371/journal.pone.0087520.
- Ankita Gupta; Salma Jamal; Sukriti Goyal; Ritu Jain; Divya Wahi; Abhinav Grover; Structural studies on molecular mechanisms of Nelfinavir resistance caused by non-active site mutation V77I in HIV-1 protease. BMC Bioinformatics 2015, 16, S10-S10, 10.1186/1471-2105-16-s19-s10.
- Feng Gao; David L. Robertson; Catherine D. Carruthers; Sandra G. Morrison; Bixi Jian; Yalu Chen; Françoise Barré-Sinoussi; Marc Girard; Alagarsamy Srinivasan; Alash’Le G. Abimiku; et al.George M. ShawPaul M. SharpBeatrice H. Hahn A Comprehensive Panel of Near-Full-Length Clones and Reference Sequences for Non-Subtype B Isolates of Human Immunodeficiency Virus Type 1. Journal of Virology 1998, 72, 5680-5698, 10.1128/jvi.72.7.5680-5698.1998.
- Javier Martinez-Picado; Anu V. Savara; Lorraine Sutton; Richard T. D’Aquila; Replicative Fitness of Protease Inhibitor-Resistant Mutants of Human Immunodeficiency Virus Type 1. Journal of Virology 1999, 73, 3744-3752, 10.1128/jvi.73.5.3744-3752.1999.
- Joshua Yi Yeo; Darius Wen-Shuo Koh; Ping Yap; Ghin-Ray Goh; Samuel Ken-En Gan; Spontaneous Mutations in HIV-1 Gag, protease, RT p66 in the first replication cycle and how they appear: Insights from an in vitro BSL2 assay on mutation rates and types. null 2019, NA, 679852, 10.1101/679852.
- Ron Geller; Pilar Domingo-Calap; Jose Cuevas; Paola Rossolillo; Matteo Negroni; Rafael Sanjuán; The external domains of the HIV-1 envelope are a mutational cold spot. Nature Communications 2015, 6, 8571, 10.1038/ncomms9571.
- Michael E. Abram; Andrea L. Ferris; Wei Shao; W. Gregory Alvord; Stephen H. Hughes; Nature, Position, and Frequency of Mutations Made in a Single Cycle of HIV-1 Replication. Journal of Virology 2010, 84, 9864-9878, 10.1128/jvi.00915-10.
- Joshua Yeo; Darius Koh; Ping Yap; Ghin-Ray Goh; Samuel Gan; Spontaneous Mutations in HIV-1 Gag, Protease, RT p66 in the First Replication Cycle and How They Appear: Insights from an In Vitro Assay on Mutation Rates and Types. International Journal of Molecular Sciences 2020, 22, 370, 10.3390/ijms22010370.
- Elisabeth Dam; Romina Quercia; Bärbel Glass; Diane Descamps; Odile Launay; Xavier Duval; Hans-Georg Kräusslich; Allan J. Hance; François Clavel; ANRS 109 Study Group; et al. Gag Mutations Strongly Contribute to HIV-1 Resistance to Protease Inhibitors in Highly Drug-Experienced Patients besides Compensating for Fitness Loss. PLOS Pathogens 2009, 5, e1000345, 10.1371/journal.ppat.1000345.
- Chris M. Parry; Arinder Kohli; Christine J. Boinett; Greg J. Towers; Adele L. McCormick; Deenan Pillay; Gag Determinants of Fitness and Drug Susceptibility in Protease Inhibitor-Resistant Human Immunodeficiency Virus Type 1. Journal of Virology 2009, 83, 9094-9101, 10.1128/jvi.02356-08.
- Sadahiro Tamiya; Sek Mardy; Mark F. Kavlick; Kazuhisa Yoshimura; Hiroaki Mistuya; Amino Acid Insertions near Gag Cleavage Sites Restore the Otherwise Compromised Replication of Human Immunodeficiency Virus Type 1 Variants Resistant to Protease Inhibitors. Journal of Virology 2004, 78, 12030-12040, 10.1128/jvi.78.21.12030-12040.2004.
- Hiroyuki Gatanaga; Yasuhiro Suzuki; Hsinyi Tsang; Kazuhisa Yoshimura; Mark F. Kavlick; Kunio Nagashima; Robert J. Gorelick; Sek Mardy; Chun Tang; Michael F. Summers; et al.Hiroaki Mitsuya Amino Acid Substitutions in Gag Protein at Non-cleavage Sites Are Indispensable for the Development of a High Multitude of HIV-1 Resistance against Protease Inhibitors. Journal of Biological Chemistry 2002, 277, 5952-5961, 10.1074/jbc.m108005200.
- Frank Bally; Raquel Martinez; Solange Peters; Philippe Sudre; Amalio Telenti; Polymorphism of HIV Type 1 Gag p7/p1 and p1/p6 Cleavage Sites: Clinical Significance and Implications for Resistance to Protease Inhibitors. AIDS Research and Human Retroviruses 2000, 16, 1209-1213, 10.1089/08892220050116970.
- Chinh Tran-To Su; Chee-Keong Kwoh; Chandra Shekhar Verma; Samuel Ken-En Gan; Modeling the full length HIV-1 Gag polyprotein reveals the role of its p6 subunit in viral maturation and the effect of non-cleavage site mutations in protease drug resistance. Journal of Biomolecular Structure and Dynamics 2017, 36, 4366-4377, 10.1080/07391102.2017.1417160.
- Firdaus Samsudin; Samuel Ken-En Gan; Peter J. Bond; The impact of Gag non-cleavage site mutations on HIV-1 viral fitness from integrative modelling and simulations. Computational and Structural Biotechnology Journal 2020, 19, 330-342, 10.1016/j.csbj.2020.12.022.
- L Doyon; G Croteau; D Thibeault; F Poulin; L Pilote; D Lamarre; Second locus involved in human immunodeficiency virus type 1 resistance to protease inhibitors. Journal of Virology 1996, 70, 3763-3769, 10.1128/jvi.70.6.3763-3769.1996.
- Isabelle Malet; Bénédicte Roquebert; Cécile Dalban; Marc Wirden; Bahia Amellal; Rachid Agher; Anne Simon; Christine Katlama; Dominique Costagliola; Vincent Calvez; et al.Anne-Geneviève Marcelin Association of Gag cleavage sites to protease mutations and to virological response in HIV-1 treated patients. Journal of Infection 2007, 54, 367-374, 10.1016/j.jinf.2006.06.012.
- Manabu Aoki; David J. Venzon; Yasuhiro Koh; Hiromi Aoki-Ogata; Toshikazu Miyakawa; Kazuhisa Yoshimura; Kenji Maeda; Hiroaki Mitsuya; Non-Cleavage Site Gag Mutations in Amprenavir-Resistant Human Immunodeficiency Virus Type 1 (HIV-1) Predispose HIV-1 to Rapid Acquisition of Amprenavir Resistance but Delay Development of Resistance to Other Protease Inhibitors. Journal of Virology 2009, 83, 3059-3068, 10.1128/jvi.02539-08.
- William F. Flynn; Max W. Chang; Zhiqiang Tan; Glenn Oliveira; Jinyun Yuan; Jason F. Okulicz; Bruce E. Torbett; Ronald M. Levy; Deep Sequencing of Protease Inhibitor Resistant HIV Patient Isolates Reveals Patterns of Correlated Mutations in Gag and Protease. PLOS Computational Biology 2015, 11, e1004249, 10.1371/journal.pcbi.1004249.
- Chris M. Parry; Madhavi Kolli; Richard E. Myers; Patricia A. Cane; Celia Schiffer; Deenan Pillay; Three Residues in HIV-1 Matrix Contribute to Protease Inhibitor Susceptibility and Replication Capacity. Antimicrobial Agents and Chemotherapy 2011, 55, 1106-1113, 10.1128/aac.01228-10.
- Chinh Tran-To Su; Wei-Li Ling; Wai-Heng Lua; Yu-Xuan Haw; Samuel Ken-En Gan; Structural analyses of 2015-updated drug-resistant mutations in HIV-1 protease: an implication of protease inhibitor cross-resistance. BMC Bioinformatics 2016, 17, 219-228, 10.1186/s12859-016-1372-3.
- Soo-Yon Rhee; Jonathan Taylor; W. Jeffrey Fessel; David Kaufman; William Towner; Paolo Troia; Peter Ruane; James Hellinger; Vivian Shirvani; Andrew Zolopa; et al.Robert W. Shafer HIV-1 Protease Mutations and Protease Inhibitor Cross-Resistance. Antimicrobial Agents and Chemotherapy 2010, 54, 4253-4261, 10.1128/aac.00574-10.
- Akbar Ali; Rajintha M. Bandaranayake; Yufeng Cai; Nancy M. King; Madhavi Kolli; Seema Mittal; Jennifer F. Murzycki; Madhavi N.L. Nalam; Ellen A. Nalivaika; Ayşegül Özen; et al.Moses M. Prabu-JeyabalanKelly ThayerCelia A. Schiffer Molecular Basis for Drug Resistance in HIV-1 Protease. Viruses 2010, 2, 2509-2535, 10.3390/v2112509.


