Various kinds of primary metabolisms in plants are modulated through sulfate metabolism, and sulfotransferases (SOTs), which are engaged in sulfur metabolism, catalyze sulfonation reactions. In this study, a genome-wide approach was utilized for the recognition and characterization of SOT family genes in the significant nutritional crop potato (Solanum tuberosum L.). Twenty-nine putative StSOT genes were identified in the potato genome and were mapped onto the nine S. tuberosum chromosomes. The protein motifs structure revealed two highly conserved 5′-phosphosulfate-binding (5′ PSB) regions and a 3′-phosphate-binding (3′ PB) motif that are essential for sulfotransferase activities. The protein–protein interaction networks also revealed an interesting interaction between SOTs and other proteins, such as PRTase, APS-kinase, protein phosphatase, and APRs, involved in sulfur compound biosynthesis and the regulation of flavonoid and brassinosteroid metabolic processes. This suggests the importance of sulfotransferases for proper potato growth and development and stress responses. Notably, homology modeling of StSOT proteins and docking analysis of their ligand-binding sites revealed the presence of proline, glycine, serine, and lysine in their active sites. An expression essay of StSOT genes via potato RNA-Seq data suggested engagement of these gene family members in plants’ growth and extension and responses to various hormones and biotic or abiotic stimuli. Our predictions may be informative for the functional characterization of the SOT genes in potato and other nutritional crops.
1. Introduction
The chemical element sulfur (S) is a necessary factor for life found in the amino acid cysteine (Cys) and methionine (Met), certain vitamins (e.g., thiamin and biotin), co-enzymes (e.g., S-adenosyl methionine), iron–sulfur complexes, prosthetic substances, glutathione (GSH) antioxidants, and others natural secondary metabolites
[1]. The adequate S in the soil helps plant growth and development, and it is helpful to get a high plant yield of high quality
[2]. Moreover, the deficiency of S makes plants susceptible to various biotic and abiotic stresses
[3]. An S content ≤ 0.25% in any plant tissue may be considered severe S deficiency; plants with such deficiency have overall chlorosis and yellowish color due to lack of chlorophyll in the early stage of development
[4].
Sulfotransferases (SOTs) (EC 2.8.2.-) are sulfate-regulating proteins in various organisms. In plants, the conjugate reaction of sulfate play a vital role in plant growth and development and in response to various stresses
[5]. Sulfate is activated by two subsequent steps for the formation of adenosine-5′-phosphosulfate (APS) and 3′-phosphoadenosine-5′-phosphosulfate (PAPS) before being involved in further biochemical reactions
[6]. Sulfotransferases (
SOTs) (EC 2.8.2.-) catalyze the transfer of a sulfate group from PAPS to a hydroxyl group of different substrates
[7]. Sulfated substances in plants function as secondary metabolites, hormones in coping with stimulus situations, and use as important S storage substances during the life cycle
[8]. Plant SOTs are directly engaged in the sulfation process of desulpho-glucosinolate compounds (ds-Gl), which are important secondary metabolites that provide resistance against multiple biotic/abiotic stimuli in brassicales plants
[9]. All SOT proteins can be identified by a histidine residue in their PAPS-binding region and by a specific SOT domain (Pfam: PF00685)
[10]. SOT family members are specified by four conserved regions (I to IV) in their protein sequences
[11], in which the I and IV regions are highly conserved sections
[8]. Three
AtSOT16,
AtSOT17, and
AtSOT18 genes in the
Arabidopsis thaliana (At) genome are responsible for transferring a sulfuryl group to various ds-Gl compounds
[8][12]. Various substances, such as brassinosteroids, gibberellic acids, glucosinolates, flavonoids, coumarins, and phenolic acids, can be sulfated by SOT proteins in various plant species
[13][14].
Multiple studies indicate that
SOT genes can regulate plant stimuli responses, stress sensing and signaling mechanisms, and developmental processes. For example, in rice,
Oryza sativa, expression of some
SOT gene was observed in root, stigma, and ovary tissues in response to indole acetic acid and Benzyl aminopurine
[15];
BrSOT16 in
Brassica rapa indicated strong expression in all tissues except for stamen
[16];
ds-Gl AtSOTs, such as
AtSOT15, is responsible for circadian control
[13]; and expression levels of 11
OsSOTs exhibited some up- and downregulation in response to dehydration, high or low temperatures, and hormone stresses in various tissues
[15]. Northern blotting of
AtSOT12 revealed that the deduced protein employs flavonoids, brassinosteroids, and salicylic acid compounds as substrates; may be expressed in leaves, flowers, and roots; and responds to abiotic stimuli (such as salt, sorbitol, and cold), hormones, and interactions with biotic pathogens
[17][18]. Studies on homologous genes from
B. napus revealed increased
BNST3 and
BNST4 transcripts during exposure to hormones, low oxygen, xenobiotics, and herbicides
[14][19]. This provides evidence for the role of these genes in stress responses and detoxification. Some experimental evidence suggests that SOT may also act as a tyrosyl protein and may involve in phytosulphokines biosynthesis
[8]. The glucosinolate and their degradation products provide a defense to plant against insects and fungi. Some evidence shows the role of sulphotransferases in the biosynthesis of glucosinolate. Hence, further exploration of SOT can provide important information for the control of pests
[8].
The importance of S during the plant life cycle and associated biological and chemical processes is helpful to overcome S shortage for crop production and improvement. Potato is considered an important food crop after wheat, maize, and rice. Adequate S content in potato plants facilitates the uptake of multiple nutrients, carbohydrate formation, vitamin synthesis, chlorophyll production, seed development and stress, and pest resistance
[3][20]. Defective S contents lead to upward curving of potato leaves, along with light-green-to-yellow color. Hence, this leads to poor plant growth, prolate form, and postponed maturity
[21]. Previous studies have shown that sufficient S elevated the yield of potato tubers and quality and increased tolerance against various pathogens through the sulfur-induced resistance (SIR) mechanism
[3], whereas insufficient S lead to a reduction of several important compounds.
[22]. These important aspects necessitate the understanding of plant S biology and adjustment of S nutrition in agricultural programs. Therefore, the identification of important sulfotransferases in the S metabolism may elucidate the S-mediated proper growth and resistance mechanisms in potato.
SOTs have been identified in
Arabidopsis (22 members)
[8], rice (35 members)
[15], and
B. rapa (56 members)
[16]. However, the identification and characterization of SOT proteins in the potato (
Solanum tuberosum) genome are currently limited. In the current study, various bioinformatics approaches have been utilized to distinguish important cluster
SOTs and their expression patterns in multiple tissues and during different biotic or abiotic stimuli. Our predictions may assist functional evaluation of the SOT gene family members in potato and related crop species.
2. Identification of StSOT Genes
The deduced amino acid sequence of sulfotransferase domain (PF00685) was searched against the Hidden Markov Model (HMM) program and Phytozome database. This led to the identification of 29 putative StSOT proteins; all contained the Sulfotransfer_1 domain and were named according to their chromosomal order (Table 1).
Table 1. Identified StSOT gene family members and their characteristics in the potato genome.
| Gene ID |
Gene Symbol |
Protein Length (aa) |
MW (KDa) |
Isoelectric Point |
Subcellular Localization |
| PGSC0003DMG400000144 |
StSOT01 |
296 |
34.38 |
6.54 |
Nuclear, Cyt., Extra. |
| PGSC0003DMG400027779 |
StSOT02 |
345 |
40.01 |
7.12 |
Cyt. |
| PGSC0003DMG400003287 |
StSOT03 |
337 |
38.80 |
5.73 |
Cyt. |
| PGSC0003DMG400031776 |
StSOT04 |
344 |
40.10 |
5.4 |
Cyt. |
| PGSC0003DMG400024622 |
StSOT05 |
350 |
40.15 |
6.54 |
Cyt. |
| PGSC0003DMG400018798 |
StSOT06 |
326 |
37.56 |
5.62 |
Cyt. |
| PGSC0003DMG400026753 |
StSOT07 |
101 |
11.83 |
5.74 |
Nuclear, Cyt. |
| PGSC0003DMG400026752 |
StSOT08 |
101 |
11.98 |
7.68 |
Nuclear, Cyt. |
| PGSC0003DMG400039363 |
StSOT09 |
313 |
36.15 |
6.27 |
Cyt. |
| PGSC0003DMG400005584 |
StSOT10 |
330 |
38.49 |
6.6 |
Cyt. |
| PGSC0003DMG400028349 |
StSOT11 |
335 |
39.05 |
6.8 |
Cyt. |
| PGSC0003DMG400028301 |
StSOT12 |
335 |
39.17 |
7.11 |
Cyt. |
| PGSC0003DMG400025717 |
StSOT13 |
308 |
35.90 |
6.83 |
Cyt. |
| PGSC0003DMG400036271 |
StSOT14 |
329 |
38.38 |
6.42 |
Cyt. |
| PGSC0003DMG400046427 |
StSOT15 |
330 |
38.58 |
7.13 |
Cyt. |
| PGSC0003DMG400028302 |
StSOT16 |
332 |
38.66 |
6.72 |
Cyt. |
| PGSC0003DMG400028350 |
StSOT17 |
240 |
28.31 |
6.31 |
Cyt. |
| PGSC0003DMG400015051 |
StSOT18 |
269 |
31.41 |
7.71 |
Cyt. |
| PGSC0003DMG400028341 |
StSOT19 |
268 |
31.24 |
7.72 |
Cyt. |
| PGSC0003DMG403028340 |
StSOT20 |
209 |
24.68 |
7.67 |
Cyt. |
| PGSC0003DMG400002358 |
StSOT21 |
359 |
41.56 |
7.03 |
Cyt. |
| PGSC0003DMG400014962 |
StSOT22 |
226 |
26.06 |
6.59 |
Nuclear, Extra. |
| PGSC0003DMG400029882 |
StSOT23 |
118 |
13.63 |
6.5 |
Cyt., Mitochondrial |
| PGSC0003DMG400020968 |
StSOT24 |
316 |
36.90 |
7.16 |
Cyt. |
| PGSC0003DMG400039919 |
StSOT25 |
244 |
28.49 |
5.51 |
Cyt. |
| PGSC0003DMG400046295 |
StSOT26 |
329 |
38.25 |
5.83 |
Cyt. |
| PGSC0003DMG400046521 |
StSOT27 |
161 |
19.20 |
5.76 |
Cyt. |
| PGSC0003DMG400014947 |
StSOT28 |
105 |
12.24 |
4.95 |
Cyt., Nuclear |
| PGSC0003DMG400009660 |
StSOT29 |
106 |
12.10 |
8.99 |
Cyt., Mitochondrial, Nuclear |
The identified StSOT proteins had diverse lengths, ranging from 101 aa (
StSOT07 and
StSOT08) to 359 aa (
StSOT21). Molecular weights (MWs) ranged from 11.83 kDa (
StSOT07) to 41.56 kDa (
StSOT21). Most of the identified StSOT proteins (approximately 65.5%) were of acidic nature (theoretical
pI ≤ 7.0), ranging from 4.95 (cytosolic StSOT28) to 6.83 (cytosolic StSOT13). The subcellular location of proteins indicated that most of StSOTs (approximately 76%) can be considered as cytoplasmic proteins with no putative transmembrane domains (TMDs). StSOT07, StSOT08, and StSOT28 were predicted to be located in the nucleus in addition to the cytoplasm (
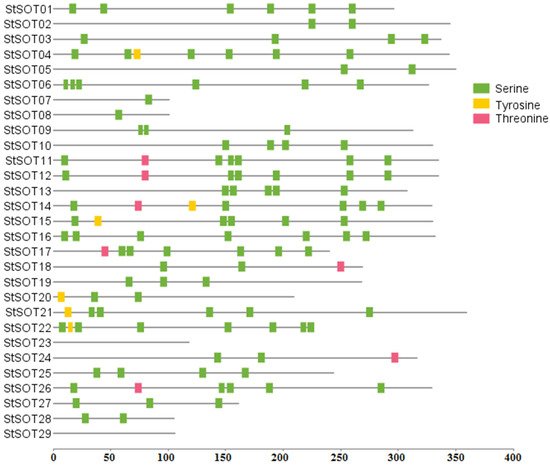
Table 1). The proteins StSOT01 and StSOT22 were also predicted to be localized in the nucleus and extracellular region. Two StSOT proteins, namely StSOT23 and StSOT29, could also be found in the mitochondria. Not all StSOT proteins contained any putative TMDs in both cytosolic N- and C-terminal regions that can suggest their specific function during the other cellular pathways apart from membrane transport. The StSOT proteins’ post-translational phosphorylation analysis illustrated a wide variety of phosphorylated serine (S) residues, along with some changed threonine (T) and tyrosine (Y) sites (
Figure 1 and
Supplementary Materials Table S1, supplementary could be found in
https://www.mdpi.com/2223-7747/10/12/2597#supplementary). The proteins StSOT02, StSOT05, StSOT07, StSOT08, and StSOT28 were predicted to contain a limited amount of phosphorylated regions (in one or two residues) in their amino acid sequences, while some StSOTs, such as StSOT01, StSOT04, StSOT06, StSOT12, StSOT14, StSOT22, and StSOT26, were predicted as the possible highly phosphorylated sulfotransferase proteins in potato.
Figure 1. Phosphorylation prediction with scores ≥ 0.95 in StSOT proteins based on serine, threonine, and tyrosine, using NetPhos 3.1 server.
3. Phylogenetic Relationships, Conserved Motifs/Residues, and Gene Structure of StSOTs
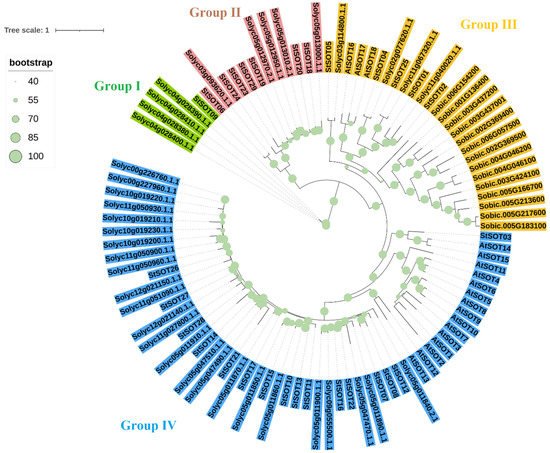
The sulfotransferase proteins from potato, Arabidopsis, tomato, and Sorghum were used to generate a phylogenetic tree to classify the SOT proteins into subfamilies (Figure 2). The phylogenetic tree clustered SOTs into the four main groups according to the tree topology and classification of the sulfotransferases in Arabidopsis. Four SOTs of tomato along StSOT09 were classified in group I and showed a high genetic distance. Six StSOTs and five SOTs of tomato were located in group II, and all sorghum SOT proteins were grouped with StSOT01, StSOT02, StSOT04, StSOT05, and StSOT25 from potato and AtSOT16, AtSOT17 and AtSOT18 from Arabidopsis and four tomato SOTs in group III. Interestingly, all sorghum SOT proteins were separated from dicot SOTs. Group IV was the largest group, and most SOTs of potato, Arabidopsis, and tomato were located in this group (Figure 2).
Figure 2. Phylogenetic relationships of SOT proteins from potato, tomato, Arabidopsis, and sorghum. The four main clusters were detected based on the ML method in the phylogenetic tree. Abbreviations: St, potato; Solyc, tomato; Sobic, sorghum; At, Arabidopsis.
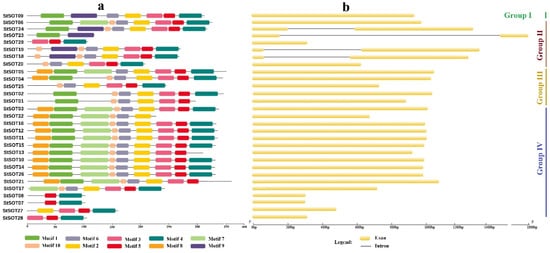
Eight conserved motifs were predicted in the StSOT protein sequences via the MEME program (
Figure 3a and
Supplementary Materials Table S2). The StSOT proteins belonging to the same phylogenetic group shared an approximately similar conserved motif composition. Five out of the eight predicted motifs, namely motif 1, motif 2, motif 3, motif 4, and motif 6, were identified as having a Sulfotransfer_1 domain (
Supplementary Materials Table S2). Motif 1 and motif 6 possessed the critical N-terminal PSB loop and C-terminal PB region, respectively, which are critical for the sulfotransferase activity of SOT proteins (
Supplementary Materials Figure S1). The sequences related to these two important motifs are significantly conserved; this high conservation can be found in both cytosolic and membrane sulfotransferases (
Supplementary Materials Figure S1).
Figure 3. Conserved motifs predicted in the StSOT protein sequences (a). Exon–intron structure predicted in the StSOT family genes (b). Two important functional 5′ PSB and 3′ PB regions were detected in the motif 1 and motif 6, respectively.
The N-terminal region 5′ PSB in motif 1 is related to the PSB-loop and helix 3 sections in the sulfotransferase protein structure that encompasses five successive residues engaged in an interaction with the PAPS compound 5′-phosphate region. In this study, the amino acid residues in this motif that are engaged in sulfotransferase catalytic activity include completely conserved Lys-103 and relatively conserved Thr-106 that can be substituted by the functionally similar residues Ser and Cys (
Figure 3a and
Supplementary Materials Figure S1). Our results revealed that genes within each subfamily have significant similarities in exon and intron numbers. For example, all
StSOT genes had an intronless structure except for
StSOT18,
StSOT19,
StSOT23, and
StSOT24, which contained two exons and one intron and were classified into the phylogenetic group II (
Figure 3b).
4. Genomic Distribution, Duplication Assay, and Synteny Relationships of StSOT Genes
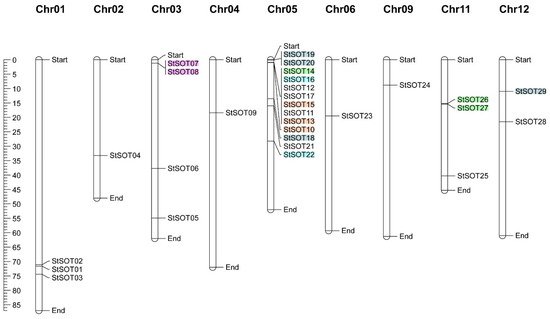
All StSOT gene family members were successfully mapped onto 9 out of 12 chromosomes in the potato genome. The chromosomal map revealed an unequal distribution of the gene family members throughout the chromosomes (Figure 4). Chromosome 5 harbored the largest number of StSOTs (13 genes), while only one StSOT each was predicted to be localized on chromosomes 2, 4, 6, and 9. Nine segmentally duplicated gene pairs categorized into five groups (including duplication and triplication events) were recognized in the StSOT gene family. These groups are indicated with different colors in Figure 4, revealing paralogous pairs. The highest numbers of duplicated/triplicated genes were distributed on chromosome 5, with three duplications and three triplications clustered into the four gene groups (Table 2).
Figure 4. Chromosomal map of StSOT family genes in the potato genome. Five series of duplicated/triplicated StSOTs are indicated in different colors. The scale is in mega bases.
Table 2. Duplicated gene pairs in the StSOT gene family and Ka/Ks analysis. Multiple duplication/triplication events were identified in five categories (in different colors in the chromosomal map in Figure 4).
| Duplicated Gene Pairs |
Duplication Type |
Ka |
Ks |
Ka/Ks |
Date (Million Years Ago) a |
| 1 |
StSOT07-StSOT08 |
Segmental |
0.0213 |
0.075 |
0.284 |
5.769 |
| 2 |
StSOT10-StSOT13 |
Segmental |
0.003 |
0.006 |
0.448 |
0.461 |
| StSOT10-StSOT13-StSOT15 |
0.010 |
0.042 |
0.244 |
3.230 |
| 3 |
StSOT26-StSOT27 |
Segmental |
0.014 |
0.057 |
0.254 |
4.384 |
| StSOT14-StSOT26-StSOT27 |
0.010 |
0.033 |
0.317 |
2.538 |
| 4 |
StSOT16-StSOT22 |
Segmental |
0.015 |
0.063 |
0.252 |
4.846 |
| 5 |
StSOT19-StSOT20 |
Segmental |
0.016 |
0.029 |
0.544 |
2.230 |
| StSOT18-StSOT19-StSOT20 |
0.010 |
0.045 |
0.228 |
3.461 |
| StSOT19- StSOT20-StSOT29 |
0.006 |
0.024 |
0.275 |
1.846 |
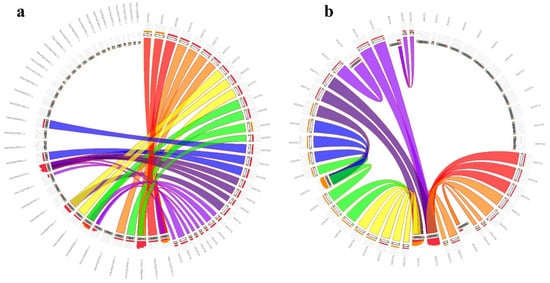
Intraspecies synteny results revealed that many of the duplicated blocks were collinear, such as StSOT07–StSOT08 and StSOT26–StSOT27. The Ka/Ks magnitudes related to the paralogous pairs ranged from 0.228 to 0.448. According to these ratios, the duplication events were estimated to have occurred between 0.461 to 5.769 million years ago (MYA). The Ka/Ks ratios < 1 in duplicated gene pairs from StSOT family in potato suggested that these genes have been impressed by purifying selection (Table 2). Synteny analysis has also been performed across the potato and some related plant genomes, which can determine the probable functions of the potato StSOT genes (Figure 5). According to the results, all StSOT genes showed synteny relationships with their orthologs in the tomato (approximately 35%) and Arabidopsis (approximately 32%) genomes. The maximum orthology percentage of the StSOT on the potato genome was revealed with tomato. These wide synteny relations at the gene level were considered as confirmation for their close evolutionary relationships. These findings demonstrated the vast rearrangement events of potato chromosomes during the genome evolution process.
Figure 5. Synteny relationships of StSOT genes with orthologs from (a) tomato and (b) Arabidopsis.
5. Identification of Cis-Regulatory Elements in StSOT Promoters
In the present study, the
StSOT promoter regions in the potato genome were investigated to identify the putative
cis-regulatory elements. Several kinds of
cis-elements for responses to various phytohormones and abiotic stimulus conditions were identified (
Supplementary Materials Table S3). The promoter common
cis-elements, such as the core element TATA-box, CAAT-box, and circadian control element, were identified in all
StSOT genes. The ABRE (abscisic acid responsiveness), ERE (ethylene responsiveness), and MeJA (Methyl jasmonate responsiveness) factors were predicted as frequently encountered hormone-responding
cis-elements in most
StSOT promoters. The light-responsive G-Box and Box 4, wounding-stress-responsive WUN-motif, anaerobic inducible ARE, and stress-responsive MYB elements were identified as the other regulatory
cis-elements frequently occurring in the
StSOT promoter areas, suggesting important roles of this gene family in stress responses. The TC-rich repeats (regulating defensive reactions), LTR (low-temperature responsive), TCA-element (salicylic acid-responsive), TGA-element (auxin-responsive), and W-Box (WRKY transcription factors binding region, important for abiotic stimuli responses) were identified as abiotic and hormone-stress-responsive elements predicted in
StSOT08,
StSOT11,
StSOT13,
StSOT16,
StSOT22, and
StSOT26. Multiple regulatory
cis-elements related to phytohormones and environmental stimuli were identified in most
StSOT genes, suggesting the critical roles of these genes in potato growth and responses to stress conditions.
6. Predicted miRNAs for StSOT Genes
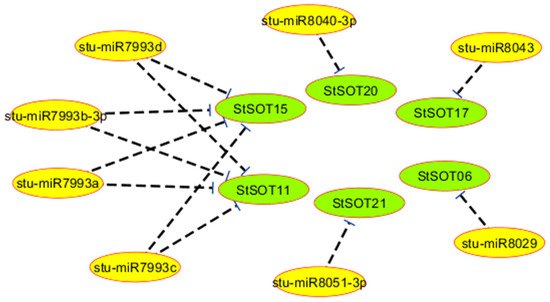
Six StSOT transcripts were predicted to be regulated by various miRNAs. For example, the transcripts StSOT06, StSOT17, StSOT20, and StSOT21 were targeted by stu-miR8029, stu-miR8043, stu-miR8040-3p, and stu-miR8051-3p, respectively (Table 3). Interestingly, four miRNAs, including stu-miR7993a-d, were predicted to target both StSOT11 and StSOT15 for inhibition of translation (Table 3 and Figure 6). Furthermore, the targeted regions of StSOTs by these miRNAs were predicted into the Sulfotransfer_1 domain region, indicating that the StSOT genes are regulated by the identified miRNAs. Remarkably, the identified miRNAs targeted the StSOT genes in group IV, illustrating important similarities in their cellular functions during potato growth, development, and degradation. Moreover, targeting of StSOT genes by various miRNA isoforms may indicate an important role of these genes during various cellular processes in addition to S assimilation activity.
Figure 6. Interaction network between micro-RNAs and StSOT genes.
Table 3. Predicted miRNA-targeted StSOT transcripts in the potato genome.
| miRNA Accession |
Target Gene |
miRNA Aligned Fragment |
Inhibition Type |
| stu-miR8029 |
StSOT06 |
CGAGGUUUUGUUUCUUUUUACCGA |
Translation |
| stu-miR7993a |
StSOT11 |
UCAAUUCAAUUGGUGUAUUUUAUA |
Translation |
| stu-miR7993b-3p |
StSOT11 |
UCAAUUCAAUUGGUGUAUUUUAUA |
Translation |
| stu-miR7993c |
StSOT11 |
UCAAUUCAAUUGGUGUAUUUUAUA |
Translation |
| stu-miR7993d |
StSOT11 |
UCAAUUCAAUUGGUGUAUUUUAUA |
Translation |
| stu-miR7993d |
StSOT15 |
UCAAUUCAAUUGGUGUAUUUUAUA |
Translation |
| stu-miR7993c |
StSOT15 |
UCAAUUCAAUUGGUGUAUUUUAUA |
Translation |
| stu-miR7993a |
StSOT15 |
UCAAUUCAAUUGGUGUAUUUUAUA |
Translation |
| stu-miR7993b-3p |
StSOT15 |
UCAAUUCAAUUGGUGUAUUUUAUA |
Translation |
| stu-miR8040-3p |
StSOT20 |
CUAGUAUUAAUGUUAAUAUUC |
Cleavage |
| stu-miR8043 |
StSOT17 |
CCGGUUUCAGGUUAAUAUAGU |
Cleavage |
| stu-miR8051-3p |
StSOT21 |
UUAUCAUACCAUCUUCUUUAU |
Cleavage |
7. Protein–Protein Interactions
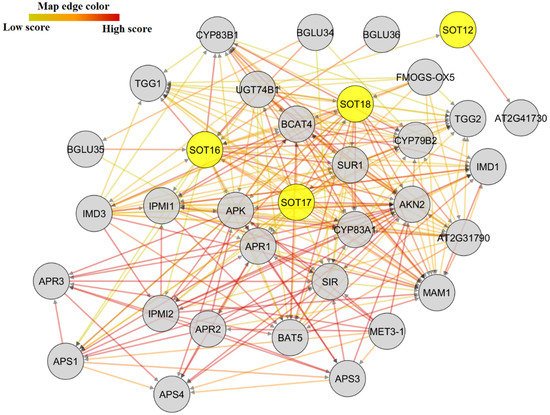
The interactome data revealed that SOT proteins interact with proteins involved in transmembrane transport, heme binding, iron–sulfur cluster binding, and transition of phosphate groups (
Figure 7 and
Supplementary Materials Table S4). SOT16, SOT17, and SOT18, which regulate S compounds and secondary metabolite biosynthetic processes, were likely part of an interaction network with a glucosyltransferase protein that contains transmembrane transporter activity and may respond to stimuli through ion homeostasis. APS (pseudouridine synthase/archaeosine transglycosylase-like family protein), APR (Adenine phosphoribosyl reductase), APK (Adenylyl-sulfate kinase), and MET3-1 precorrin methyl transferase were identified as other transferases working with StSOTs in the biosynthesis of S compounds and secondary metabolites (
Supplementary Materials Table S4), which can mediate potato growth and stimuli resistance. The interaction of StSOTs with adenylyl-sulfate kinases can control sulfate assimilation and regulation of S-containing amino acid metabolic processes that are essential for plant reproduction and viability. The APR proteins in the network with StSOTs can adjust iron–sulfur complexes and reduce sulfate for Cys biosynthesis and can be induced by sulfate starvation. The annotation of the SUR, CYP, and AKN proteins that interact with StSOTs revealed the involvement of these interactions in secondary metabolite biosynthetic processes and sulfate assimilation, which modulate plant growth and development and responses to diverse stimuli. The SIR protein was also predicted to be engaged in metal ion transition and secondary metabolite biosynthetic processes that can regulate potato cellular response to stress and sulfate starvation (
Supplementary Materials Table S4).
Figure 7. Protein–protein interaction network of SOT proteins, using Arabidopsis interactome data through STRING server v11, and improved by using Cytoscape.
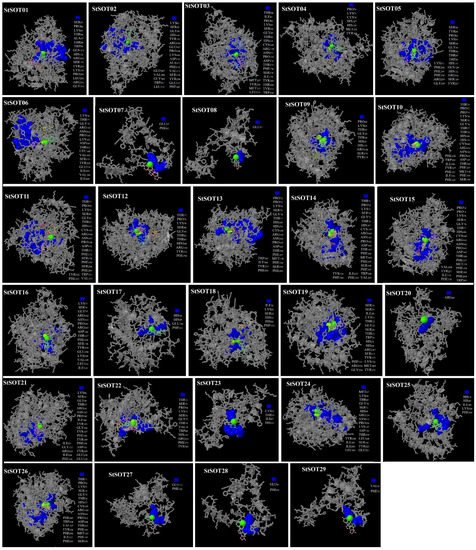
8. Predicted 3D Modeling, Binding Sites, and Validation of StSOT Proteins
The 3D models of StSOT proteins were prepared through the Phyre2 program, under >90% confidence, according to the templates 5mek (as a cytosolic sulfotransferase) and 1q44 and 1fmj (as the P-loop containing PAPS sulfotransferases in
Arabidopsis). The 3D structure of StSOTs exhibited the conserved typical frames consisting of β3-α8 (as the PSB loop in the proteins 5′ region) and β8-α6 (as the 3′PB motif) (
Figure 8 and
Supplementary Materials Figure S2). In the model validation, the Ramachandran plot analysis revealed that the qualities of the StSOT protein models varied from 80% to 95%, suggesting the good quality of the predicted 3D models and reliability (
Table 4). For further verification, the ProSA server was utilized for evaluation of probable errors within the protein models, indicating the existence of negative z-values in a conformation zone for the predicted models, which can be experimentally distinguished through both X-ray and NMR spectroscopy (
Table 4). A remarkable proportion of residues in each protein model was included in the lowest energy regions, indicating decreasing energies in various parts of these putative StSOT proteins.
Figure 8. Three-dimensional docking analysis of StSOT protein ligand-binding sites. The binding residues, metallic heterogeneous and non-metallic heterogeneous are shown in blue spacefill, green spacefill, and colorful wireframe, respectively.
Table 4. Properties of secondary and tertiary structures of StSOT proteins, validation, and channel numbers.
| Protein Name |
α-Helixes (%) |
β-Sheets (%) |
Coils (%) |
Turns (%) |
Channel Number |
Ramachandran Plot (%) |
z-Values |
| StSOT01 |
132 (44%) |
50 (16%) |
114 (38%) |
76 (25%) |
7 |
93.50% |
−8.4 |
| StSOT02 |
161 (46%) |
41 (11%) |
143 (41%) |
92 (26%) |
9 |
93.90% |
−8.73 |
| StSOT03 |
141 (41%) |
50 (14%) |
146 (43%) |
84 (24%) |
8 |
90.10% |
−8.15 |
| StSOT04 |
148 (43%) |
46 (13%) |
150 (43%) |
88 (25%) |
7 |
93.90% |
−8.15 |
| StSOT05 |
142 (40%) |
39 (11%) |
169 (48%) |
68 (19%) |
12 |
92.80% |
−8.61 |
| StSOT06 |
152 (46%) |
39 (11%) |
135 (41%) |
80 (24%) |
12 |
94.10% |
−8.16 |
| StSOT07 |
47 (46%) |
0 (0%) |
54 (53%) |
32 (31%) |
5 |
90.90% |
−1.85 |
| StSOT08 |
50 (49%) |
3 (2%) |
48 (47%) |
20 (19%) |
4 |
92.90% |
−2.01 |
| StSOT09 |
148 (47%) |
44 (14%) |
121 (38%) |
76 (24%) |
10 |
93.20% |
−8.71 |
| StSOT10 |
151 (45%) |
47 (14%) |
132 (40%) |
72 (21%) |
10 |
94.20% |
−8.45 |
| StSOT11 |
140 (41%) |
40 (11%) |
155 (46%) |
84 (25%) |
11 |
94.00% |
−8.52 |
| StSOT12 |
146 (43%) |
42 (12%) |
147 (43%) |
84 (25%) |
12 |
92.50% |
−8.66 |
| StSOT13 |
120 (38%) |
36 (11%) |
152 (49%) |
96 (31%) |
13 |
81.70% |
−7.64 |
| StSOT14 |
145 (44%) |
46 (13%) |
138 (41%) |
80 (24%) |
5 |
94.50% |
−8.6 |
| StSOT15 |
152 (46%) |
50 (15%) |
128 (38%) |
88 (26%) |
3 |
95.10% |
−7.93 |
| StSOT16 |
148 (44%) |
42 (12%) |
142 (42%) |
76 (22%) |
12 |
91.50% |
−9.05 |
| StSOT17 |
115 (47%) |
20 (8%) |
105 (43%) |
64 (26%) |
12 |
95.40% |
−6.17 |
| StSOT18 |
128 (47%) |
30 (11%) |
111 (41%) |
44 (16%) |
7 |
93.60% |
−7.99 |
| StSOT19 |
132 (49%) |
31 (11%) |
105 (39%) |
64 (23%) |
11 |
95.90% |
−7.92 |
| StSOT20 |
103 (49%) |
12 (5%) |
94 (44%) |
44 (21%) |
12 |
94.20% |
−6.67 |
| StSOT21 |
143 (39%) |
43 (11%) |
173 (48%) |
76 (21%) |
10 |
91.30% |
−7.93 |
| StSOT22 |
94 (41%) |
29 (12%) |
103 (45%) |
72 (31%) |
13 |
79.90% |
−5.5 |
| StSOT23 |
37 (31%) |
25 (21%) |
56 (47%) |
36 (30%) |
5 |
92.20% |
−4.01 |
| StSOT24 |
146 (46%) |
35 (11%) |
135 (42%) |
68 (21%) |
9 |
89.80% |
−8.12 |
| StSOT25 |
113 (46%) |
21 (8%) |
110 (45%) |
60 (24%) |
5 |
93.00% |
−5.86 |
| StSOT26 |
154 (46%) |
45 (13%) |
130 (39%) |
96 (29%) |
6 |
93.30% |
−8.77 |
| StSOT27 |
83 (51%) |
3 (1%) |
74 (46%) |
32 (20%) |
4 |
94.30% |
−4.56 |
| StSOT28 |
49 (46%) |
0 (0%) |
56 (53%) |
24 (22%) |
5 |
80.60% |
−3.48 |
| StSOT29 |
49 (46%) |
0 (0%) |
57 (53%) |
24 (22%) |
5 |
94.20% |
−2.78 |
The highest numbers of protein channels were predicted in StSOT05, StSOT06, StSOT11, StSOT12, StSOT13, StSOT16, StSOT17, StSOT19, StSOT20, and StSOT22, with channel numbers of 11 to 13 (Table 4). Interestingly, some StSOT proteins with considerable similarity in their channel regions, such as StSOT05–StSOT06 and StSOT10–StSOT21, were also included in the same phylogenetic group. Accordingly, this may suggest that the evolutionary divergence of StSOTs can modulate gene characteristics to function in various molecular pathways.
Various numbers of ligand and ligand-binding amino acid residues were identified in the StSOT protein structures (
Supplementary Materials Table S5). Some metallic and non-metallic heterogeneous were predicted in the center of the binding region in all candidate protein models (
Figure 8). Ser, Pro, Gly, Lys, Tyr, and Arg were predicted as the binding residues in almost all of the ligand-binding regions in the candidate StSOT proteins, which suggest the importance of these residues in positioning on the DNA molecule and in the performance of cellular functions. The Ca, Zn, and Mg ions were identified as the metallic heterogeneous in the StSOT functional domains. Although some binding residues were predicted to be outside of the specific domain, our docking assay indicated that most of these functional regions were included in the Sulfotransfer_1 domain. The binding residues and their metallic or non-metallic interacting heterogeneous revealed that some variations suggest the functional specificity of
StSOT genes, in addition to their common functions under stimuli exposure and responding to variations in cell metabolism.
 +1 credit