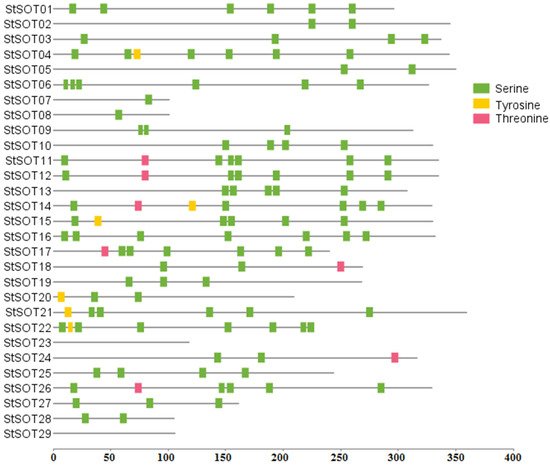
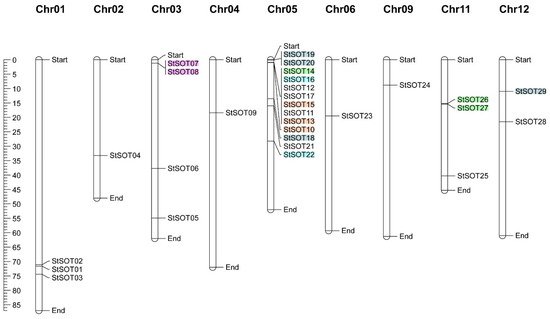
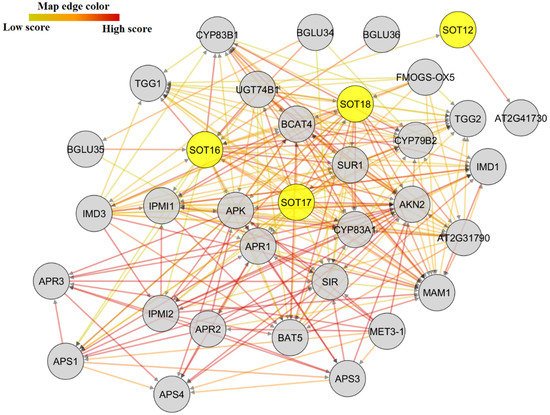
Various kinds of primary metabolisms in plants are modulated through sulfate metabolism, and sulfotransferases (SOTs), which are engaged in sulfur metabolism, catalyze sulfonation reactions. In this study, a genome-wide approach was utilized for the recognition and characterization of SOT family genes in the significant nutritional crop potato (Solanum tuberosum L.). Twenty-nine putative StSOT genes were identified in the potato genome and were mapped onto the nine S. tuberosum chromosomes. The protein motifs structure revealed two highly conserved 5′-phosphosulfate-binding (5′ PSB) regions and a 3′-phosphate-binding (3′ PB) motif that are essential for sulfotransferase activities. The protein–protein interaction networks also revealed an interesting interaction between SOTs and other proteins, such as PRTase, APS-kinase, protein phosphatase, and APRs, involved in sulfur compound biosynthesis and the regulation of flavonoid and brassinosteroid metabolic processes. This suggests the importance of sulfotransferases for proper potato growth and development and stress responses. Notably, homology modeling of StSOT proteins and docking analysis of their ligand-binding sites revealed the presence of proline, glycine, serine, and lysine in their active sites. An expression essay of StSOT genes via potato RNA-Seq data suggested engagement of these gene family members in plants’ growth and extension and responses to various hormones and biotic or abiotic stimuli. Our predictions may be informative for the functional characterization of the SOT genes in potato and other nutritional crops.
- sulfur
- sulfotransferase
- potato
- bioinformatics
- protein structure
- stimuli coping
1. Introduction
2. Identification of StSOT Genes
| Gene ID | Gene Symbol | Protein Length (aa) | MW (KDa) | Isoelectric Point | Subcellular Localization |
|---|
| Protein Name | α-Helixes (%) | β-Sheets (%) | Coils (%) | Turns (%) | Channel Number | Ramachandran Plot (%) | z-Values |
|---|---|---|---|---|---|---|---|
| PGSC0003DMG400000144 | StSOT01 | 296 | 34.38 | 6.54 | Nuclear, Cyt., Extra. | ||
| PGSC0003DMG400027779 | StSOT02 | 345 | 40.01 | 7.12 | Cyt. | ||
| PGSC0003DMG400003287 | StSOT03 | 337 | 38.80 | 5.73 | Cyt. | ||
| PGSC0003DMG400031776 | StSOT04 | 344 | 40.10 | 5.4 | Cyt. | ||
| PGSC0003DMG400024622 | StSOT05 | 350 | 40.15 | 6.54 | Cyt. | ||
| PGSC0003DMG400018798 | StSOT06 | 326 | 37.56 | 5.62 | Cyt. | ||
| PGSC0003DMG400026753 | StSOT07 | 101 | 11.83 | 5.74 | Nuclear, Cyt. | ||
| PGSC0003DMG400026752 | StSOT08 | 101 | 11.98 | 7.68 | Nuclear, Cyt. | ||
| 12.10 | |||||||
| 8.99 | |||||||
| Cyt., Mitochondrial, Nuclear | |||||||
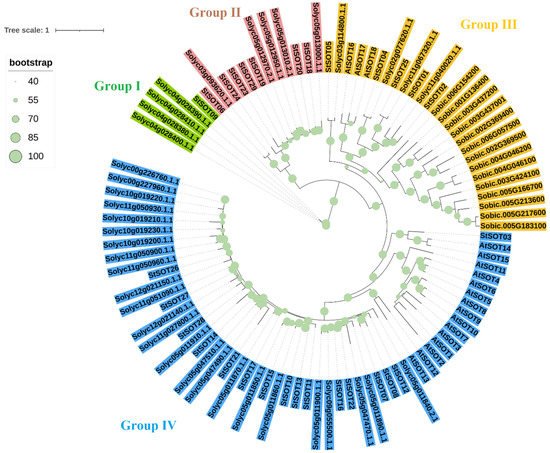
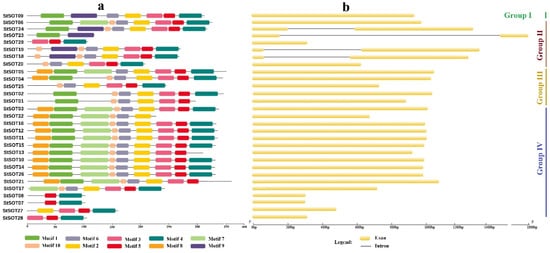
3. Phylogenetic Relationships, Conserved Motifs/Residues, and Gene Structure of StSOTs
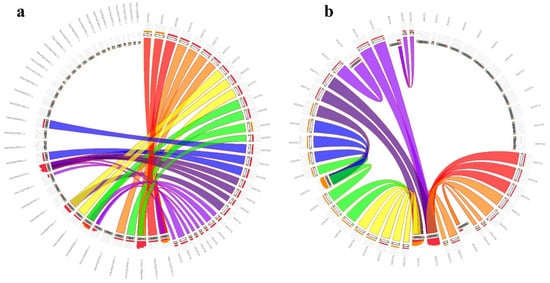
4. Genomic Distribution, Duplication Assay, and Synteny Relationships of StSOT Genes
| Duplicated Gene Pairs | Duplication Type | Ka | Ks | Ka | / | Ks | Date (Million Years Ago) | a | |||||
|---|---|---|---|---|---|---|---|---|---|---|---|---|---|
| 1 | StSOT07-StSOT08 | Segmental | 0.0213 | 0.075 | 0.284 | 5.769 | |||||||
| StSOT01 | 132 (44%) | 50 (16%) | 114 (38%) | 76 (25%) | 7 | 93.50% | −8.4 | ||||||
| 2 | StSOT10-StSOT13 | Segmental | 0.003 | 0.006 | 0.448 | 0.461 | |||||||
| StSOT02 | 161 (46%) | 41 (11%) | 143 (41%) | 92 (26%) | 9 | 93.90% | −8.73 | StSOT10-StSOT13-StSOT15 | 0.010 | 0.042 | 0.244 | 3.230 | |
| StSOT03 | 141 (41%) | 50 (14%) | 146 (43%) | 84 (24%) | 8 | 90.10% | 3 | StSOT26-StSOT27 | Segmental | 0.014 | 0.057 | 0.254 | 4.384 |
| −8.15 | StSOT14-StSOT26-StSOT27 | 0.010 | 0.033 | ||||||||||
| StSOT04 | 148 (43%) | 0.317 | 2.538 | ||||||||||
| 46 (13%) | 4 | StSOT16-StSOT22 | Segmental | 0.015 | 0.063 | 0.252 | 4.846 | ||||||
| 5 | StSOT19-StSOT20 | Segmental | 0.016 | 0.029 | 0.544 | 2.230 | |||||||
| StSOT18-StSOT19-StSOT20 | 0.010 | 0.045 | 0.228 | 3.461 | PGSC0003DMG400039363 | StSOT09 | 313 | 36.15 | 6.27 | Cyt. | |||
| StSOT19- StSOT20-StSOT29 | 0.006 | 0.024 | 0.275 | 1.846 | PGSC0003DMG400005584 | StSOT10 | 330 | 38.49 | 6.6 | Cyt. | |||
| PGSC0003DMG400028349 | StSOT11 | 335 | 39.05 | 6.8 | Cyt. | ||||||||
| 150 (43%) | 88 (25%) | 7 | 93.90% | −8.15 | PGSC0003DMG400028301 | StSOT12 | 335 | 39.17 | 7.11 | Cyt. | |||
| PGSC0003DMG400025717 | StSOT13 | 308 | 35.90 | 6.83 | Cyt. | ||||||||
| PGSC0003DMG400036271 | StSOT14 | 329 | 38.38 | 6.42 | Cyt. | ||||||||
| PGSC0003DMG400046427 | StSOT15 | 330 | 38.58 | 7.13 | Cyt. | ||||||||
| PGSC0003DMG400028302 | StSOT16 | 332 | 38.66 | 6.72 | Cyt. | ||||||||
| PGSC0003DMG400028350 | StSOT17 | 240 | 28.31 | 6.31 | Cyt. | ||||||||
| PGSC0003DMG400015051 | StSOT18 | 269 | 31.41 | 7.71 | Cyt. | ||||||||
| PGSC0003DMG400028341 | StSOT19 | 268 | 31.24 | 7.72 | Cyt. | ||||||||
| PGSC0003DMG403028340 | StSOT20 | 209 | 24.68 | 7.67 | Cyt. | ||||||||
| PGSC0003DMG400002358 | StSOT21 | 359 | 41.56 | 7.03 | Cyt. | ||||||||
| PGSC0003DMG400014962 | StSOT22 | 226 | 26.06 | 6.59 | Nuclear, Extra. | ||||||||
| PGSC0003DMG400029882 | StSOT23 | 118 | 13.63 | 6.5 | Cyt., Mitochondrial | ||||||||
| PGSC0003DMG400020968 | StSOT24 | 316 | 36.90 | 7.16 | Cyt. | ||||||||
| PGSC0003DMG400039919 | StSOT25 | 244 | 28.49 | 5.51 | Cyt. | ||||||||
| PGSC0003DMG400046295 | StSOT26 | 329 | 38.25 | 5.83 | Cyt. | ||||||||
| PGSC0003DMG400046521 | StSOT27 | 161 | 19.20 | 5.76 | Cyt. | ||||||||
| PGSC0003DMG400014947 | StSOT28 | 105 | 12.24 | 4.95 | Cyt., Nuclear | ||||||||
| PGSC0003DMG400009660 | StSOT29 | 106 | |||||||||||
5. Identification of Cis-Regulatory Elements in StSOT Promoters
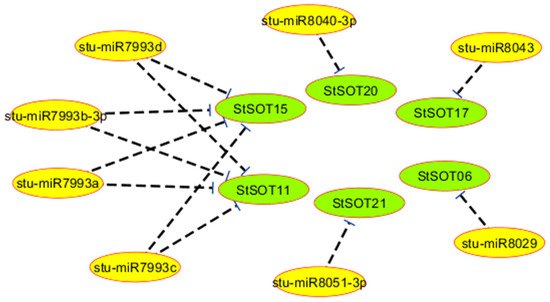
6. Predicted miRNAs for StSOT Genes
| miRNA Accession | Target Gene | miRNA Aligned Fragment | Inhibition Type | ||||||||
|---|---|---|---|---|---|---|---|---|---|---|---|
| stu-miR8029 | StSOT06 | CGAGGUUUUGUUUCUUUUUACCGA | Translation | ||||||||
| stu-miR7993a | StSOT11 | UCAAUUCAAUUGGUGUAUUUUAUA | Translation | ||||||||
| stu-miR7993b-3p | StSOT11 | UCAAUUCAAUUGGUGUAUUUUAUA | Translation | ||||||||
| stu-miR7993c | StSOT11 | UCAAUUCAAUUGGUGUAUUUUAUA | Translation | ||||||||
| stu-miR7993d | StSOT11 | UCAAUUCAAUUGGUGUAUUUUAUA | Translation | ||||||||
| stu-miR7993d | StSOT15 | ||||||||||
| StSOT05 | 142 (40%) | 39 (11%) | 169 (48%) | 68 (19%) | 12 | 92.80% | −8.61 | UCAAUUCAAUUGGUGUAUUUUAUA | Translation | ||
| StSOT06 | 152 (46%) | 39 (11%) | 135 (41%) | 80 (24%) | 12 | 94.10% | −8.16 | stu-miR7993c | StSOT15 | ||
| StSOT07 | UCAAUUCAAUUGGUGUAUUUUAUA | Translation | |||||||||
| 47 (46%) | 0 (0%) | 54 (53%) | 32 (31%) | 5 | 90.90% | −1.85 | stu-miR7993a | StSOT15 | UCAAUUCAAUUGGUGUAUUUUAUA | ||
| StSOT08 | Translation | ||||||||||
| 50 (49%) | 3 (2%) | 48 (47%) | 20 (19%) | 4 | 92.90% | −2.01 | stu-miR7993b-3p | StSOT15 | UCAAUUCAAUUGGUGUAUUUUAUA | Translation | |
| StSOT09 | 148 (47%) | 44 (14%) | 121 (38%) | 76 (24%) | 10 | 93.20% | −8.71 | stu-miR8040-3p | StSOT20 | CUAGUAUUAAUGUUAAUAUUC | Cleavage |
| StSOT10 | 151 (45%) | 47 (14%) | 132 (40%) | 72 (21%) | 10 | 94.20% | −8.45 | stu-miR8043 | StSOT17 | CCGGUUUCAGGUUAAUAUAGU | Cleavage |
| stu-miR8051-3p | StSOT21 | UUAUCAUACCAUCUUCUUUAU | Cleavage |
7. Protein–Protein Interactions
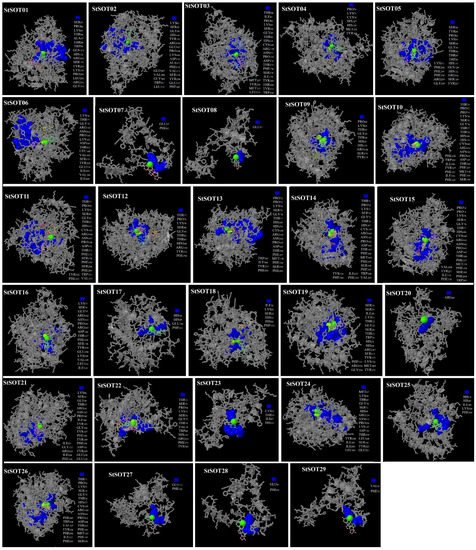
8. Predicted 3D Modeling, Binding Sites, and Validation of StSOT Proteins
| StSOT11 | |||||||
| 140 (41%) | |||||||
| 40 (11%) | |||||||
| 155 (46%) | |||||||
| 84 (25%) | |||||||
| 11 | 94.00% | −8.52 | |||||
| StSOT12 | 146 (43%) | 42 (12%) | 147 (43%) | 84 (25%) | 12 | 92.50% | −8.66 |
| StSOT13 | 120 (38%) | 36 (11%) | 152 (49%) | 96 (31%) | 13 | 81.70% | −7.64 |
| StSOT14 | 145 (44%) | 46 (13%) | 138 (41%) | 80 (24%) | 5 | 94.50% | −8.6 |
| StSOT15 | 152 (46%) | 50 (15%) | 128 (38%) | 88 (26%) | 3 | 95.10% | −7.93 |
| StSOT16 | 148 (44%) | 42 (12%) | 142 (42%) | 76 (22%) | 12 | 91.50% | −9.05 |
| StSOT17 | 115 (47%) | 20 (8%) | 105 (43%) | 64 (26%) | 12 | 95.40% | −6.17 |
| StSOT18 | 128 (47%) | 30 (11%) | 111 (41%) | 44 (16%) | 7 | 93.60% | −7.99 |
| StSOT19 | 132 (49%) | 31 (11%) | 105 (39%) | 64 (23%) | 11 | 95.90% | −7.92 |
| StSOT20 | 103 (49%) | 12 (5%) | 94 (44%) | 44 (21%) | 12 | 94.20% | −6.67 |
| StSOT21 | 143 (39%) | 43 (11%) | 173 (48%) | 76 (21%) | 10 | 91.30% | −7.93 |
| StSOT22 | 94 (41%) | 29 (12%) | 103 (45%) | 72 (31%) | 13 | 79.90% | −5.5 |
| StSOT23 | 37 (31%) | 25 (21%) | 56 (47%) | 36 (30%) | 5 | 92.20% | −4.01 |
| StSOT24 | 146 (46%) | 35 (11%) | 135 (42%) | 68 (21%) | 9 | 89.80% | −8.12 |
| StSOT25 | 113 (46%) | 21 (8%) | 110 (45%) | 60 (24%) | 5 | 93.00% | −5.86 |
| StSOT26 | 154 (46%) | 45 (13%) | 130 (39%) | 96 (29%) | 6 | 93.30% | −8.77 |
| StSOT27 | 83 (51%) | 3 (1%) | 74 (46%) | 32 (20%) | 4 | 94.30% | −4.56 |
| StSOT28 | 49 (46%) | 0 (0%) | 56 (53%) | 24 (22%) | 5 | 80.60% | −3.48 |
| StSOT29 | 49 (46%) | 0 (0%) | 57 (53%) | 24 (22%) | 5 | 94.20% | −2.78 |
References
- Takahashi, H.; Buchner, P.; Yoshimoto, N.; Hawkesford, M.J.; Shiu, S.-H. Evolutionary relationships and functional diversity of plant sulfate transporters. Front. Plant Sci. 2012, 2, 119. [Google Scholar] [CrossRef] [PubMed]
- d’Hooghe, P.; Dubousset, L.; Gallardo, K.; Kopriva, S.; Avice, J.-C.; Trouverie, J. Evidence for proteomic and metabolic adaptations associated with alterations of seed yield and quality in sulfur-limited Brassica napus L. Mol. Cell. Proteom. 2014, 13, 1165–1183. [Google Scholar] [CrossRef] [PubMed]
- Klikocka, H.; Haneklaus, S.; Bloem, E.; Schnug, E. Influence of sulfur fertilization on infection of potato tubers with Rhizoctonia solani and Streptomyces scabies. J. Plant Nutr. 2005, 28, 819–833. [Google Scholar] [CrossRef]
- Gupta, U.C.; Sanderson, J.B. Effect of sulfur, calcium, and boron on tissue nutrient concentration and potato yield. J. Plant Nutr. 1993, 16, 1013–1023. [Google Scholar] [CrossRef]
- Varin, L.; Marsolais, F.; Richard, M.; Rouleau, M. Biochemistry and molecular biology of plant sulfotransferases. FASEB J. 1997, 11, 517–525. [Google Scholar] [CrossRef]
- Schmidt, A. Distribution of APS-sulfotransferase activity among higher plants. Plant Sci. Lett. 1975, 5, 407–415. [Google Scholar] [CrossRef]
- Glendening, T.M.; Poulton, J.E. Partial Purification and Characterization of a 3′-Phosphoadenosine 5′-Phosphosulfate: Desulfoglucosinolate Sulfotransferase from Cress (Lepidium sativum). Plant Physiol. 1990, 94, 811–818. [Google Scholar] [CrossRef]
- Klein, M.; Papenbrock, J. The multi-protein family of Arabidopsis sulphotransferases and their relatives in other plant species. J. Exp. Bot. 2004, 55, 1809–1820. [Google Scholar] [CrossRef]
- Rausch, T.; Wachter, A. Sulfur metabolism: A versatile platform for launching defence operations. Trends Plant Sci. 2005, 10, 503–509. [Google Scholar] [CrossRef]
- Finn, R.D.; Bateman, A.; Clements, J.; Coggill, P.; Eberhardt, R.Y.; Eddy, S.R.; Heger, A.; Hetherington, K.; Holm, L.; Mistry, J. Pfam: The protein families database. Nucleic Acids Res. 2014, 42, D222–D230. [Google Scholar] [CrossRef]
- Varin, L.; DeLuca, V.; Ibrahim, R.K.; Brisson, N. Molecular characterization of two plant flavonol sulfotransferases. Proc. Natl. Acad. Sci. USA 1992, 89, 1286–1290. [Google Scholar] [CrossRef] [PubMed]
- Klein, M.; Reichelt, M.; Gershenzon, J.; Papenbrock, J. The three desulfoglucosinolate sulfotransferase proteins in Arabidopsis have different substrate specificities and are differentially expressed. FEBS J. 2006, 273, 122–136. [Google Scholar] [CrossRef] [PubMed]
- Komori, R.; Amano, Y.; Ogawa-Ohnishi, M.; Matsubayashi, Y. Identification of tyrosylprotein sulfotransferase in Arabidopsis. Proc. Natl. Acad. Sci. USA 2009, 106, 15067–15072. [Google Scholar] [CrossRef] [PubMed]
- Marsolais, F.; Sebastià, C.H.; Rousseau, A.; Varin, L. Molecular and biochemical characterization of BNST4, an ethanol-inducible steroid sulfotransferase from Brassica napus, and regulation of BNST genes by chemical stress and during development. Plant Sci. 2004, 166, 1359–1370. [Google Scholar] [CrossRef]
- Chen, R.; Jiang, Y.; Dong, J.; Zhang, X.; Xiao, H.; Xu, Z.; Gao, X. Genome-wide analysis and environmental response profiling of SOT family genes in rice (Oryza sativa). Genes Genom. 2012, 34, 549–560. [Google Scholar] [CrossRef]
- Zang, Y.; Kim, H.U.; Kim, J.A.; Lim, M.; Jin, M.; Lee, S.C.; Kwon, S.; Lee, S.; Hong, J.K.; Park, T. Genome-wide identification of glucosinolate synthesis genes in Brassica rapa. FEBS J. 2009, 276, 3559–3574. [Google Scholar] [CrossRef]
- Baek, D.; Pathange, P.; CHUNG, J.; Jiang, J.; Gao, L.; Oikawa, A.; Hirai, M.Y.; Saito, K.; Pare, P.W.; Shi, H. A stress-inducible sulphotransferase sulphonates salicylic acid and confers pathogen resistance in Arabidopsis. Plant Cell Environ. 2010, 33, 1383–1392. [Google Scholar] [CrossRef]
- Lacomme, C.; Roby, D. Molecular cloning of a sulfotransferase in Arabidopsis thaliana and regulation during development and in response to infection with pathogenic bacteria. Plant Mol. Biol. 1996, 30, 995–1008. [Google Scholar] [CrossRef]
- Rouleau, M.; Marsolais, F.; Richard, M.; Nicolle, L.; Voigt, B.; Adam, G.; Varin, L. Inactivation of brassinosteroid biological activity by a salicylate-inducible steroid sulfotransferase from Brassica napus. J. Biol. Chem. 1999, 274, 20925–20930. [Google Scholar] [CrossRef]
- Bednarek, P. Sulfur-containing secondary metabolites from Arabidopsis thaliana and other Brassicaceae with function in plant immunity. ChemBioChem 2012, 13, 1846. [Google Scholar] [CrossRef]
- Barczak, B.; Nowak, K. Effect of sulphur fertilisation on the content of macroelements and their ionic ratios in potato tubers. J. Elem. 2015, 20, 37–47. [Google Scholar] [CrossRef]
- Hopkins, L.; Parmar, S.; Błaszczyk, A.; Hesse, H.; Hoefgen, R.; Hawkesford, M.J. O-acetylserine and the regulation of expression of genes encoding components for sulfate uptake and assimilation in potato. Plant Physiol. 2005, 138, 433–440. [Google Scholar] [CrossRef] [PubMed]
- Zhang, S.; Xu, Z.; Sun, H.; Sun, L.; Shaban, M.; Yang, X.; Zhu, L. Genome-wide identification of papain-like cysteine proteases in Gossypium hirsutum and functional characterization in response to Verticillium dahliae. Front. Plant Sci. 2019, 10, 134. [Google Scholar] [CrossRef]
- Niño, M.C.; Kang, K.K.; Cho, Y.G. Genome-wide transcriptional response of papain-like cysteine protease-mediated resistance against Xanthomonas oryzae pv. oryzae in rice. Plant Cell Rep. 2020, 39, 457–472. [Google Scholar] [CrossRef]
- Ding, Q.; Yang, X.; Pi, Y.; Li, Z.; Xue, J.; Chen, H.; Li, Y.; Wu, H. Genome-wide identification and expression analysis of extensin genes in tomato. Genomics 2020, 112, 4348–4360. [Google Scholar] [CrossRef]
- Fan, S.; Zhang, D.; Zhang, L.; Gao, C.; Xin, M.; Tahir, M.M.; Li, Y.; Ma, J.; Han, M. Comprehensive analysis of GASA family members in the Malus domestica genome: Identification, characterization, and their expressions in response to apple flower induction. BMC Genom. 2017, 18, 827. [Google Scholar] [CrossRef] [PubMed]
- Faraji, S.; Filiz, E.; Kazemitabar, S.K.; Vannozzi, A.; Palumbo, F.; Barcaccia, G.; Heidari, P. The AP2/ERF Gene Family in Triticum durum: Genome-Wide Identification and Expression Analysis under Drought and Salinity Stresses. Genes 2020, 11, 1464. [Google Scholar] [CrossRef]
- Waseem, M.; Ahmad, F.; Habib, S.; Li, Z. Genome-wide identification of the auxin/indole-3-acetic acid (Aux/IAA) gene family in pepper, its characterisation, and comprehensive expression profiling under environmental and phytohormones stress. Sci. Rep. 2018, 8, 12008. [Google Scholar] [CrossRef]
- Heidari, P.; Ahmadizadeh, M.; Izanlo, F.; Nussbaumer, T. In silico study of the CESA and CSL gene family in Arabidopsis thaliana and Oryza sativa: Focus on post-translation modifications. Plant Gene 2019, 19, 100189. [Google Scholar] [CrossRef]
- Rezaee, S.; Ahmadizadeh, M.; Heidari, P. Genome-wide characterization, expression profiling, and post-transcriptional study of GASA gene family. Gene Rep. 2020, 20, 100795. [Google Scholar] [CrossRef]
- Faraji, S.; Hasanzadeh, S.; Heidari, P. Comparative in silico analysis of Phosphate transporter gene family, PHT, in Camelina sativa gemome. Gene Rep. 2021, 101351. [Google Scholar] [CrossRef]
- Hell, R.; Dahl, C.; Knaff, D.; Leustek, T. Sulfur Metabolism in Phototrophic Organisms; Springer: Berlin/Heidelberg, Germany, 2008. [Google Scholar]
- Klaassen, C.D.; Boles, J.W. The importance of 3′-phosphoadenosine 5′-phosphosulfate (PAPS) in the regulation of sulfation. FASEB J. 1997, 11, 404–418. [Google Scholar] [CrossRef]
- Kakuta, Y.; Pedersen, L.G.; Pedersen, L.C.; Negishi, M. Conserved structural motifs in the sulfotransferase family. Trends Biochem. Sci. 1998, 23, 129–130. [Google Scholar] [CrossRef]
- Visser, R.G.F.; Bachem, C.W.B.; de Boer, J.M.; Bryan, G.J.; Chakrabati, S.K.; Feingold, S.; Gromadka, R.; van Ham, R.C.H.J.; Huang, S.; Jacobs, J.M.E. Sequencing the potato genome: Outline and first results to come from the elucidation of the sequence of the world’s third most important food crop. Am. J. Potato Res. 2009, 86, 417–429. [Google Scholar] [CrossRef]
- Diambra, L.A. Genome sequence and analysis of the tuber crop potato. Nature 2011, 475, 7355. [Google Scholar]
- Sheshadri, S.A.; Nishanth, M.J.; Simon, B. Stress-mediated cis-element transcription factor interactions interconnecting primary and specialized metabolism in planta. Front. Plant Sci. 2016, 7, 1725. [Google Scholar] [CrossRef]
- Zhang, Z.; Li, J.; Zhao, X.-Q.; Wang, J.; Wong, G.K.-S.; Yu, J. KaKs_Calculator: Calculating Ka and Ks Through Model Selection and Model Averaging. Genom. Proteom. Bioinform. 2006, 4, 259–263. [Google Scholar] [CrossRef]
- Abdullah; Faraji, S.; Mehmood, F.; Malik, H.M.T.; Ahmed, I.; Heidari, P.; Poczai, P. The GASA Gene Family in Theobroma cacao: Genome Wide Identification and Expression Analyses. Agronomy 2021, 11, 1425. [Google Scholar] [CrossRef]
- Heidari, P.; Faraji, S.; Ahmadizadeh, M.; Ahmar, S.; Mora-Poblete, F. New insights into structure and function of TIFY genes in Zea mays and Solanum lycopersicum: A genome-wide comprehensive analysis. Front. Genet. 2021, 12, 534. [Google Scholar] [CrossRef] [PubMed]
- Fujii, S.; Kazama, T.; Yamada, M.; Toriyama, K. Discovery of global genomic re-organization based on comparison of two newly sequenced rice mitochondrial genomes with cytoplasmic male sterility-related genes. BMC Genom. 2010, 11, 209. [Google Scholar] [CrossRef]
- Musavizadeh, Z.; Najafi-Zarrini, H.; Kazemitabar, S.K.; Hashemi, S.H.; Faraji, S.; Barcaccia, G.; Heidari, P. Genome-Wide Analysis of Potassium Channel Genes in Rice: Expression of the OsAKT and OsKAT Genes under Salt Stress. Genes 2021, 12, 784. [Google Scholar] [CrossRef] [PubMed]
- Xuan, Y.H.; Piao, H.L.; Je, B.I.; Park, S.J.; Park, S.H.; Huang, J.; Zhang, J.B.; Peterson, T.; Han, C. Transposon Ac/Ds-induced chromosomal rearrangements at the rice OsRLG5 locus. Nucleic Acids Res. 2011, 39, e149. [Google Scholar] [CrossRef]
- Ahmadizadeh, M.; Chen, J.-T.; Hasanzadeh, S.; Ahmar, S.; Heidari, P. Insights into the genes involved in the ethylene biosynthesis pathway in Arabidopsis thaliana and Oryza sativa. J. Genet. Eng. Biotechnol. 2020, 18, 62. [Google Scholar] [CrossRef]
- Biłas, R.; Szafran, K.; Hnatuszko-Konka, K.; Kononowicz, A.K. Cis-regulatory elements used to control gene expression in plants. Plant Cell Tissue Organ Cult. 2016, 127, 269–287. [Google Scholar] [CrossRef]
- Faraji, S.; Ahmadizadeh, M.; Heidari, P. Genome-wide comparative analysis of Mg transporter gene family between Triticum turgidum and Camelina sativa. BioMetals 2021, 34, 639–660. [Google Scholar] [CrossRef]
- Cui, Q.; Yu, Z.; Purisima, E.O.; Wang, E. Principles of microRNA regulation of a human cellular signaling network. Mol. Syst. Biol. 2006, 2, 46. [Google Scholar] [CrossRef] [PubMed]
- Heidari, P.; Mazloomi, F.; Nussbaumer, T.; Barcaccia, G. Insights into the SAM synthetase gene family and its roles in tomato seedlings under abiotic stresses and hormone treatments. Plants 2020, 9, 586. [Google Scholar] [CrossRef]
- Amrutha, R.N.; Sekhar, P.N.; Varshney, R.K.; Kishor, P.B.K. Genome-wide analysis and identification of genes related to potassium transporter families in rice (Oryza sativa L.). Plant Sci. 2007, 172, 708–721. [Google Scholar] [CrossRef]
- Braun, P.; Aubourg, S.; Van Leene, J.; De Jaeger, G.; Lurin, C. Plant protein interactomes. Annu. Rev. Plant Biol. 2013, 64, 161–187. [Google Scholar] [CrossRef]
- Fukao, Y. Protein-protein interactions in plants. Plant Cell Physiol. 2012, 53, 617–625. [Google Scholar] [CrossRef]
- Kazemi, E.; Zargooshi, J.; Kaboudi, M.; Heidari, P.; Kahrizi, D.; Mahaki, B.; Mohammadian, Y.; Khazaei, H.; Ahmed, K. A genome-wide association study to identify candidate genes for erectile dysfunction. Brief. Bioinform. 2021, 22, bbaa338. [Google Scholar] [CrossRef]
- Hiruma, K.; Fukunaga, S.; Bednarek, P.; Piślewska-Bednarek, M.; Watanabe, S.; Narusaka, Y.; Shirasu, K.; Takano, Y. Glutathione and tryptophan metabolism are required for Arabidopsis immunity during the hypersensitive response to hemibiotrophs. Proc. Natl. Acad. Sci. USA 2013, 110, 9589–9594. [Google Scholar] [CrossRef]
- Ishihara, A.; Hashimoto, Y.; Tanaka, C.; Dubouzet, J.G.; Nakao, T.; Matsuda, F.; Nishioka, T.; Miyagawa, H.; Wakasa, K. The tryptophan pathway is involved in the defense responses of rice against pathogenic infection via serotonin production. Plant J. 2008, 54, 481–495. [Google Scholar] [CrossRef]
- Heidari, P.; Abdullah; Faraji, S.; Poczai, P. Magnesium transporter Gene Family: Genome-Wide Identification and Characterization in Theobroma cacao, Corchorus capsularis and Gossypium hirsutum of Family Malvaceae. Agronomy 2021, 11, 1651. [Google Scholar] [CrossRef]
- Mazid, M.; Khan, T.A.; Mohammad, F. Role of secondary metabolites in defense mechanisms of plants. Biol. Med. 2011, 3, 232–249. [Google Scholar]
- Jain, M. Next-generation sequencing technologies for gene expression profiling in plants. Brief. Funct. Genom. 2012, 11, 63–70. [Google Scholar] [CrossRef]
- Ghelis, T. Signal processing by protein tyrosine phosphorylation in plants. Plant Signal. Behav. 2011, 6, 942–951. [Google Scholar] [CrossRef] [PubMed]
- Ahmadizadeh, M.; Heidari, P. Bioinformatics study of transcription factors involved in cold stress. Biharean Biol. 2014, 8, 83–86. [Google Scholar]
- Goodstein, D.M.; Shu, S.; Howson, R.; Neupane, R.; Hayes, R.D.; Fazo, J.; Mitros, T.; Dirks, W.; Hellsten, U.; Putnam, N. Phytozome: A comparative platform for green plant genomics. Nucleic Acids Res. 2012, 40, D1178–D1186. [Google Scholar] [CrossRef] [PubMed]
- Gasteiger, E.; Hoogland, C.; Gattiker, A.; Duvaud, S.; Wilkins, M.R.; Appel, R.D.; Bairoch, A. Protein Identification and Analysis Tools on the ExPASy Server. In The Proteomics Protocols Handbook; Humana Press: Totowa, NJ, USA, 2005; pp. 571–607. [Google Scholar]
- Bernsel, A.; Viklund, H.; Falk, J.; Lindahl, E.; von Heijne, G.; Elofsson, A. Prediction of membrane-protein topology from first principles. Proc. Natl. Acad. Sci. USA 2008, 105, 7177–7181. [Google Scholar] [CrossRef] [PubMed]
- Blom, N.; Sicheritz-Pontén, T.; Gupta, R.; Gammeltoft, S.; Brunak, S. Prediction of post-translational glycosylation and phosphorylation of proteins from the amino acid sequence. Proteomics 2004, 4, 1633–1649. [Google Scholar] [CrossRef] [PubMed]
- Yu, C.-S.; Cheng, C.-W.; Su, W.-C.; Chang, K.-C.; Huang, S.-W.; Hwang, J.-K.; Lu, C.-H. CELLO2GO: A web server for protein subCELlular LOcalization prediction with functional gene ontology annotation. PLoS ONE 2014, 9, e99368. [Google Scholar] [CrossRef]
- Notredame, C.; Higgins, D.G.; Heringa, J. T-Coffee: A novel method for fast and accurate multiple sequence alignment. J. Mol. Biol. 2000, 302, 205–217. [Google Scholar] [CrossRef] [PubMed]
- Kumar, S.; Stecher, G.; Li, M.; Knyaz, C.; Tamura, K. MEGA X: Molecular Evolutionary Genetics Analysis across Computing Platforms. Mol. Biol. Evol. 2018, 35, 1547–1549. [Google Scholar] [CrossRef]
- Bailey, T.L.; Boden, M.; Buske, F.A.; Frith, M.; Grant, C.E.; Clementi, L.; Ren, J.; Li, W.W.; Noble, W.S. MEME Suite: Tools for motif discovery and searching. Nucleic Acids Res. 2009, 37, W202–W208. [Google Scholar] [CrossRef] [PubMed]
- Hu, B.; Jin, J.; Guo, A.-Y.; Zhang, H.; Luo, J.; Gao, G. GSDS 2.0: An upgraded gene feature visualization server. Bioinformatics 2015, 31, 1296–1297. [Google Scholar] [CrossRef]
- Voorrips, R.E. MapChart: Software for the Graphical Presentation of Linkage Maps and QTLs. J. Hered. 2002, 93, 77–78. [Google Scholar] [CrossRef]
- Larkin, M.A.; Blackshields, G.; Brown, N.P.; Chenna, R.; McGettigan, P.A.; McWilliam, H.; Valentin, F.; Wallace, I.M.; Wilm, A.; Lopez, R. Clustal W and Clustal X version 2.0. Bioinformatics 2007, 23, 2947–2948. [Google Scholar] [CrossRef]
- Yang, Z.; Gu, S.; Wang, X.; Li, W.; Tang, Z.; Xu, C. Molecular evolution of the CPP-like gene family in plants: Insights from comparative genomics of Arabidopsis and rice. J. Mol. Evol. 2008, 67, 266–277. [Google Scholar] [CrossRef]
- Krzywinski, M.; Schein, J.; Birol, I.; Connors, J.; Gascoyne, R.; Horsman, D.; Jones, S.J.; Marra, M.A. Circos: An information aesthetic for comparative genomics. Genome Res. 2009, 19, 1639–1645. [Google Scholar] [CrossRef]
- Lescot, M.; Déhais, P.; Thijs, G.; Marchal, K.; Moreau, Y.; Van De Peer, Y.; Rouzé, P.; Rombauts, S. PlantCARE, a database of plant cis-acting regulatory elements and a portal to tools for in silico analysis of promoter sequences. Nucleic Acids Res. 2002, 30, 325–327. [Google Scholar] [CrossRef]
- Dai, X.; Zhuang, Z.; Zhao, P.X. psRNATarget: A plant small RNA target analysis server (2017 release). Nucleic Acids Res. 2018, 46, W49–W54. [Google Scholar] [CrossRef]
- Franz, M.; Lopes, C.T.; Huck, G.; Dong, Y.; Sumer, O.; Bader, G.D. Cytoscape. js: A graph theory library for visualisation and analysis. Bioinformatics 2016, 32, 309–311. [Google Scholar]
- Szklarczyk, D.; Gable, A.L.; Lyon, D.; Junge, A.; Wyder, S.; Huerta-Cepas, J.; Simonovic, M.; Doncheva, N.T.; Morris, J.H.; Bork, P.; et al. STRING v11: Protein–protein association networks with increased coverage, supporting functional discovery in genome-wide experimental datasets. Nucleic Acids Res. 2019, 47, D607–D613. [Google Scholar] [CrossRef] [PubMed]
- Kelley, L.A.; Mezulis, S.; Yates, C.M.; Wass, M.N.; Sternberg, M.J.E. The Phyre2 web portal for protein modeling, prediction and analysis. Nat. Protoc. 2015, 10, 845–858. [Google Scholar] [CrossRef] [PubMed]
- Lovell, S.C.; Davis, I.W.; Arendall III, W.B.; De Bakker, P.I.W.; Word, J.M.; Prisant, M.G.; Richardson, J.S.; Richardson, D.C. Structure validation by Cα geometry: ϕ, ψ and Cβ deviation. Proteins Struct. Funct. Bioinform. 2003, 50, 437–450. [Google Scholar] [CrossRef]
- Willard, L.; Ranjan, A.; Zhang, H.; Monzavi, H.; Boyko, R.F.; Sykes, B.D.; Wishart, D.S. VADAR: A web server for quantitative evaluation of protein structure quality. Nucleic Acids Res. 2003, 31, 3316–3319. [Google Scholar] [CrossRef]
- Kim, J.-K.; Cho, Y.; Lee, M.; Laskowski, R.A.; Ryu, S.E.; Sugihara, K.; Kim, D.-S. BetaCavityWeb: A webserver for molecular voids and channels. Nucleic Acids Res. 2015, 43, W413–W418. [Google Scholar] [CrossRef]
- Wiederstein, M.; Sippl, M.J. ProSA-web: Interactive web service for the recognition of errors in three-dimensional structures of proteins. Nucleic Acids Res. 2007, 35, W407–W410. [Google Scholar] [CrossRef] [PubMed]
- Wass, M.N.; Kelley, L.A.; Sternberg, M.J.E. 3DLigandSite: Predicting ligand-binding sites using similar structures. Nucleic Acids Res. 2010, 38, W469–W473. [Google Scholar] [CrossRef]
- Trapnell, C.; Williams, B.A.; Pertea, G.; Mortazavi, A.; Kwan, G.; Van Baren, M.J.; Salzberg, S.L.; Wold, B.J.; Pachter, L. Transcript assembly and quantification by RNA-Seq reveals unannotated transcripts and isoform switching during cell differentiation. Nat. Biotechnol. 2010, 28, 511–515. [Google Scholar] [CrossRef] [PubMed]
- Babicki, S.; Arndt, D.; Marcu, A.; Liang, Y.; Grant, J.R.; Maciejewski, A.; Wishart, D.S. Heatmapper: Web-enabled heat mapping for all. Nucleic Acids Res. 2016, 44, W147–W153. [Google Scholar] [CrossRef] [PubMed]