2.1. Scientific Production
In the Scopus database, 1535 documents are found, in which 3672 keywords are employed by 4893 authors. The authors of single-authored documents are 79; the authors of multi-authored documents are 4814; the coefficient, showing co-authors per documents, is 4.08; and the collaboration index is 3.46.
In the scientific database Web of Science, a smaller number of documents (434) is identified, written by 1810 authors as the authors of single-authored documents are 27 and the authors of multi-authored documents are 1783. The coefficient, presenting co-authors per documents, is 4.72, and the collaboration index is 3.38.
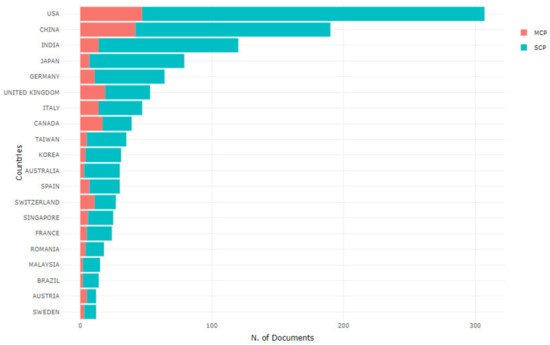
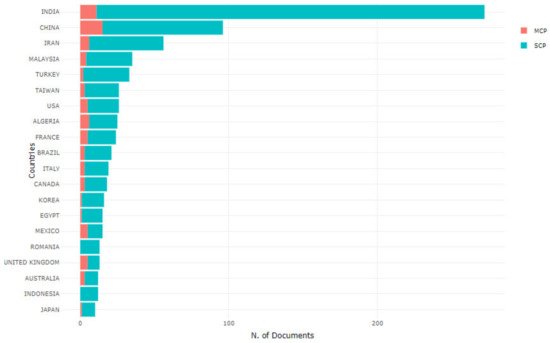
It seems that a big part of the indexed documents in Scopus and Web of Science are prepared in collaboration among several authors as the countries of the corresponding authors with the biggest contribution according to Scopus are: USA, China, India, Japan, and Germany (Figure 1). The parameter Multiple Countries Publication (MCP) measures the international collaboration as at least one co-author should be from another country. The parameter Single Country Publication (SCP) indicates that the corresponding author and his co-authors are from one country.
Figure 1. Countries of the corresponding authors with the biggest contribution to the explored topic according to Scopus and collaboration parameters.
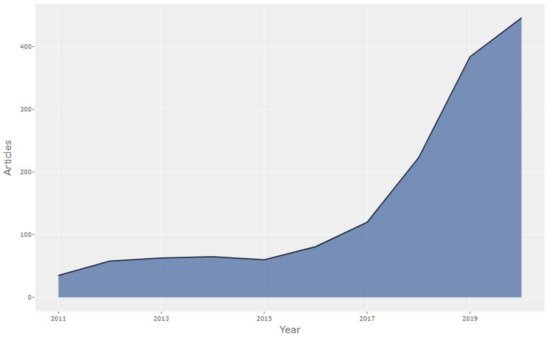
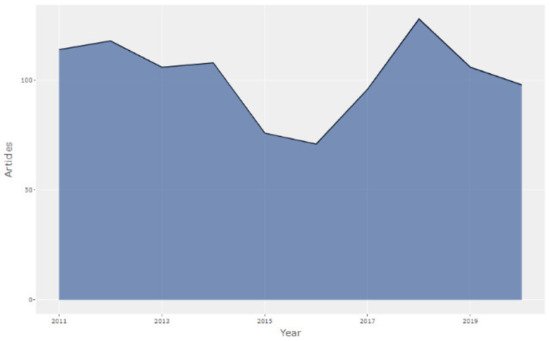
The annual scientific production in the period from 2011 to 2020 is presented in Figure 2: for 2011, 35 documents are indexed in Scopus; for 2012, 58; 2013, 63; 2014, 65; 2015, 60; 2016, 81; 2017, 120; 2018, 223; 2019, 384; 2020, 446. The observed tendency is described with an increasing curve that can be explained with enhanced interest to this topic by researchers. No jumps causing turning points are visible on the curves. Contrariwise, the curve smoothly raises as the calculated annual growth rate is 32.68%. The annual scientific production indexed in Web of Science is also described with a smoothly increasing curve as the found documents for 2011 year are 8; for 2012 and 2013, 16; 2014, 15; 2015, 16; 2016, 33; 2017, 44; 2018, 54; 2019, 107; 2020, 121.
Figure 2. Annual scientific production according to Scopus.
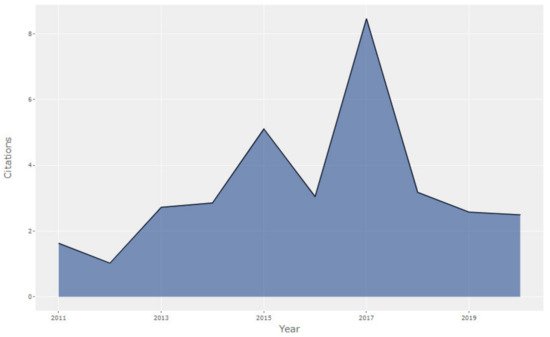
The USA, China, UK, India, Canada, Switzerland, Italy, Japan, Germany, and the Netherlands are among the most cited countries. The maximal value of the average citations per documents, indexed in Scopus, is 8.5, obtained for 2017 (Figure 3).
Figure 3. Average article citations per year according to Scopus.
2.2. Characteristics of Sources
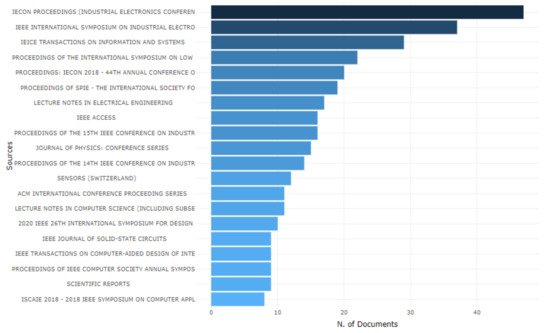
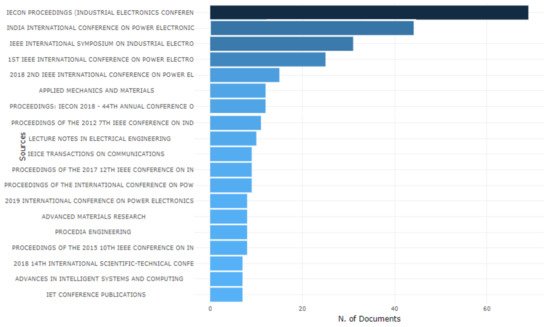
Receiving information about the sources of published papers and their impact gives an opportunity for detailed investigation into the topics of research interest. The intention is concrete papers and their discussed problems to be further explored for outlining some important key research points and main scientific themes. For this purpose, the results from the bibliographic analysis are used to point out the most influential sources. According to the Scopus database, the papers are published mainly in different conference proceedings, journals and books; the twenty most relevant sources are presented on Figure 4. After the source grouping, it is evident that the most relevant proceedings are from the following scientific forums:
Figure 4. The most relevant sources according to Scopus.
-
Industrial Electronics Conference,
-
IEEE International Symposium on Industrial Electronics,
-
International Symposium on Low Power Electronics and Design,
-
Annual Conference of the IEEE Industrial Electronics Society,
-
SPIE conferences, organized by the International Society for Optical Engineering,
and the most preferred journals and books are:
-
IEICE Transactions on Information and Systems,
-
Lecture Notes in Electrical Engineering,
-
IEEE Access,
-
Sensors,
-
Lecture Notes in Computer Science,
-
IEEE Journal of Solid-State Circuits,
-
Scientific Reports.
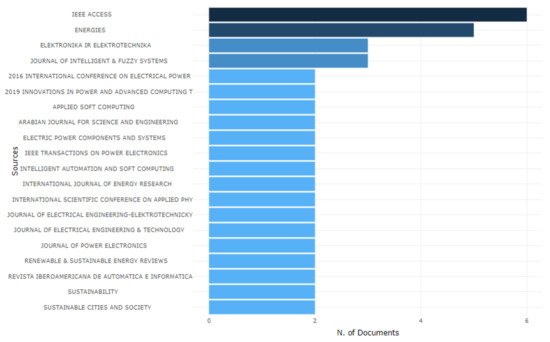
According to the bibliographic data extracted from Web of Science, the top sources are the following scientific journals: IEEE Access, Scientific Reports, Journal of Instrumentation, Sensors, ACS Applied Materials & Interfaces, Applied Sciences-Basel, Electronics, Elektronika ir Elektrotechnika, IEEE Consumer Electronics Magazine, IEEE Journal of Solid-State Circuits. The obtained results show that the conference proceedings include a smaller collection of the scientific papers in comparison to the journal contributions.
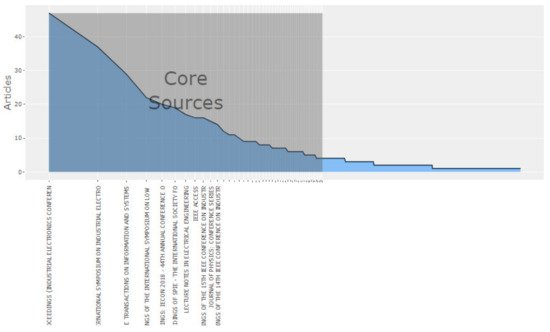
Bradford’s law is depicted on Figure 5 (according to Scopus). It presents the number of sources in the first zone (so called core sources), which have the biggest contribution for papers publication in the explored scientific area. According to this law, the journals are grouped in three zones, as the number n of the published papers related to the examined topic forms a geometric series: 1:n:n2:n3. In the case of the query “machine learning and electronics”, the first zone includes 49 sources, mainly journals and conference proceedings, as the number of all sources is 821. The curve, which describes Bradford’s law and is constructed according to the Web of Science database, has a similar form; in the first zone, there are 57 sources from 347.
Figure 5. Bradford’s Law according to Scopus.
It is noticeable that the number of sources with open access among the most relevant ones remains low; according to Scopus, only IEICE Transactions on Information and Systems and Journal of Physics: Conference Series have open access. According to Web of Science: Sensors, ACS Applied Materials & Interfaces, Applied Sciences-Basel, Electronics, and Elektronika ir Elektrotechnika are open access.
The source importance could be evaluated through different parameters; one of the most popular is the Hirsch index (h-index). The h-index is a measure, showing the number of published papers h as each paper must be cited at least h times. The sources with the highest impact concerning h-index are summarized in Table 1 according to Scopus and Web of Science. The results are gathered separately, searching in Scopus and Web of Science. Then, the sources are combined and arranged in the direction of higher to lower h-index.
Table 1. h-index of sources according to Scopus and Web of Science.
| Source |
h-Index |
| Nature Communications (Scopus) |
365 |
| Physical Review A (Scopus) |
283 |
| IEEE Journal of Solid-State Circuits (Scopus) |
215 |
| Scientific Reports (Scopus) |
213 |
| Proceedings of SPIE—The International Society for Optical Engineering (Scopus) |
176 |
| Sensors (Switzerland) (Scopus and Web of Science) |
172 |
| Neural Networks (Scopus) |
148 |
| Neurocomputing (Scopus) |
143 |
| IEEE Access (Scopus and Web of Science) |
127 |
| IEEE Transactions on Computer-Aided Design of Integrated Circuits and Systems (Scopus) |
119 |
| Energies (Web of Science) |
93 |
| Journal of Physics: Conference Series (Scopus) |
85 |
| IECON Proceedings (Industrial Electronics Conference) (Scopus) |
71 |
| Proceedings of the International Symposium on Low Power Electronics and Design (Scopus) |
61 |
| IEEE International Symposium on Industrial Electronics (Scopus) |
53 |
| Applied Sciences (Web of Science) |
52 |
| IEICE Transactions on Information and Systems (Scopus) |
49 |
| Electronics (Web of Science) |
36 |
| Elektronika ir Elektrotechnika (Web of Science) |
26 |
| Proceedings of IEEE Computer Society Annual Symposium On VLSI, ISVLSI (Scopus) |
26 |
2.4. Thematic Evolution
The scientific knowledge dynamics and knowledge evolution are grasped through the generation of some thematic maps, which are created after applying the clustering algorithm Louvain regarding the most utilized 500 authors’ keywords. Each thematic map consists of four quadrants as each quadrant shows one or more main themes/clusters. The first quadrant includes so-called “motor” clusters, the second quadrant collects “highly developed and insolated” themes, the third quadrant “emerging or declining” clusters and the fourth quadrant “basic and transversal” themes. Additionally, a thematic map is characterized by two main parameters: (1) centrality, which is related to the theme importance and (2) density, which concerns the theme development. Each cluster on the thematic map is presented through a bubble, whose name is a word with the highest occurrence in this cluster. The bigger bubbles are characterized by a higher frequency of word occurrence. The themes evolution can be studied as the examined period (2011–2020 year) is divided to time slices. Here, four time-slices are formed, taking into account the curve form of the annual scientific production (see Figure 2): time slice 1 reflects on the period 2011–2014, time slice 2 summarizes the 2015–2016 years, time slice 3 includes 2017–2018 years and time slice 4 describes 2019–2020 years.
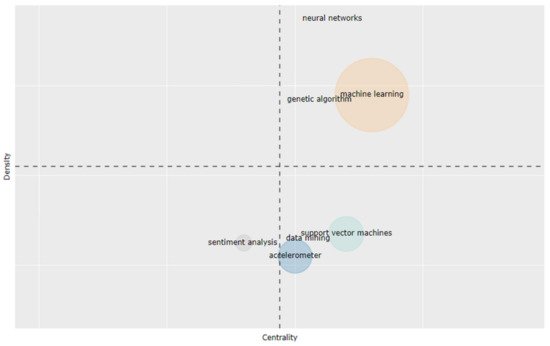
In the first time slice, presented on Figure 7, the “motor” cluster is machine learning, which includes several other important keywords such as: classification, fault diagnosis, computer vision, pattern recognition, feature extraction, human-computer interaction, condition monitoring, defect prediction, consumer electronics. Neural networks and genetic algorithms are also classified as “motor” themes. In the “emerging or declining” quadrant is the theme sentiment analysis. The “basic and transversal” themes are: support vector machines (other valuable keywords in this cluster are wireless sensor networks and anomaly detection), accelerometer and data mining. It can be noticed that a big part of the cluster names are keywords typical for machine and deep learning scientific fields, data science and computational linguistics (sentiment analysis). Only the accelerometer (electronic device used for example in vehicle control system) cluster pertains to the electronics’ domain.
Figure 7. Thematic map, time slice 1.
This time slice characterizes the period from 2011 to 2014 year, when the “motor” clusters are machine learning, neural networks and genetic algorithms. The machine learning cluster is presented with the biggest bubble in comparison to the other clusters on the map, which indicates the biggest research interest and contribution to this topic. Support vector machine is a machine learning algorithm and is separated in a different cluster, placed into the “basic and transversal” themes. It means that especially this algorithm is so popular in the first observed time slice among researchers, and it is utilized in different scientific works. The cluster accelerometer is not placed in the center that is related to its not-so-big importance for research according to the parameter centrality.
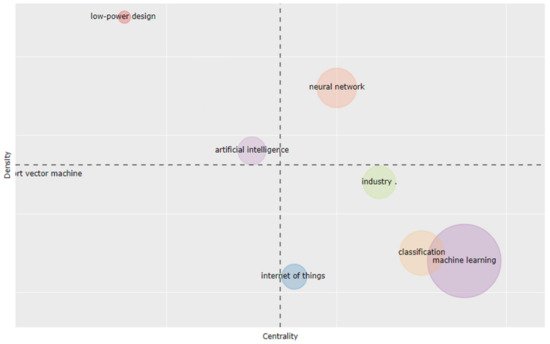
In time slice 2 (Figure 8), the “motor” theme is related to neural network and the “highly developed and insolated” themes are connected to the keywords low-power design and artificial intelligence. The theme support vector machine is seen as a “emerging or declining” cluster. In this case, it is a “declining” cluster because in the next time slices it does not appear as a separate cluster as this keyword is included in other clusters. In the fourth quadrant, “basic and transversal” themes include Internet of Things (IoT), industry 4.0, machine learning and classification. In time slice 1, the keyword classification was part of the cluster machine learning, while here it forms a separate cluster. The closest cluster to the center of the coordinate system is artificial intelligence that could be explained with the theme “importance and progressive development” in this time slice.
Figure 8. Thematic map, time slice 2.
It seems that during these two years (2015 and 2016), the popularity of machine learning for solving a wide variety of problems in electronics increases as it is converted from “motor” cluster to “basic and transversal”. Algorithms for classification are separated in different clusters that draw their importance from the investigated domain. Internet of Things and Industry 4.0 are formed as different clusters as the first one is more developed, taking into account the parameter Density. The “motor” cluster in this time slice is neural network, which is connected to its possibility for deciding deep learning tasks. The bubble is bigger than this in time slice 1, which shows a higher number of scientific papers that utilize neural network apparatus.
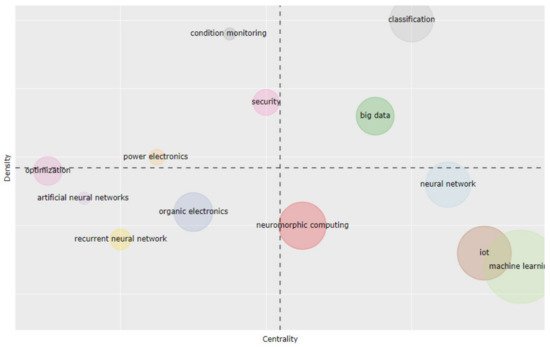
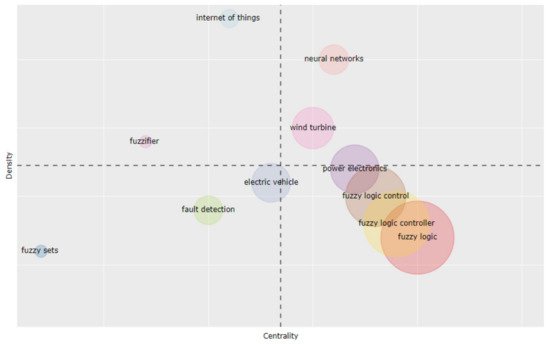
In the third time slice (Figure 9) the “motor” theme is classification, which includes keywords feature extraction, fault detection and big data. The second quadrant “highly developed and insolated” themes consist of three clusters: condition monitoring, security and power electronics, as the optimization cluster is placed on the boundary between the second and third quadrant. In the third quadrant, “emerging or declining” clusters are grouped in artificial neural networks, recurrent neural networks and organic electronics themes. The fourth quadrant “basic and transversal” theme includes neural network, IoT, machine learning and neuromorphic computing.
Figure 9. Thematic map, time slice 3.
In this time period (2017–2018), the cluster machine learning continues to be popular in scientific society and is placed in the “basic and transversal” quadrant. The cluster classification is removed from the “basic and transversal” themes, becoming the “motor” topic. The opposite can be said for neural networks, whose cluster is moved from “motor” themes to the “basic and transversal” quadrant. Obviously, the research attention is focused on big data and how the classification problems could be decided.
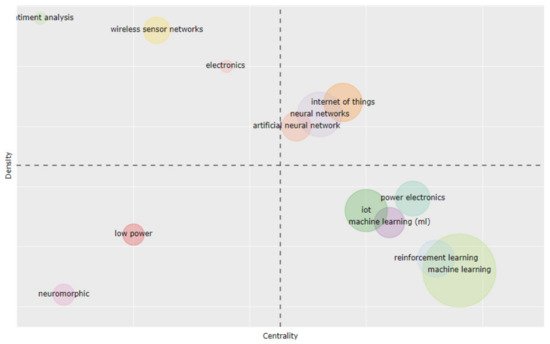
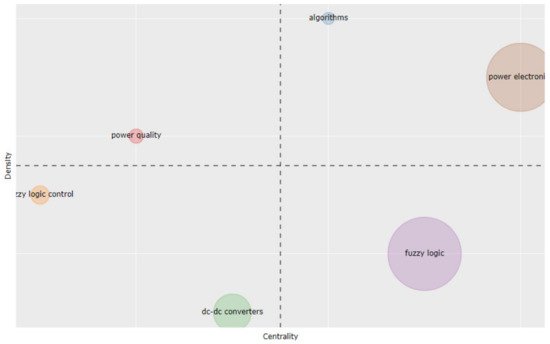
The “motor” clusters in time slice 4 (Figure 10) are formed around the keywords Internet of Things, neural networks and artificial neural networks. The wireless sensor networks, electronics and sentiment analysis are classified as “highly developed and insolated” themes. The “emerging or declining” clusters are topics related to low power and neuromorphic. The fourth quadrant includes “basic and transversal” themes: power electronics, IoT, machine learning and reinforcement learning. It can be observed that in this time slice, more sector names are keywords, typical for the electronics domain. It means that the mutual connection among keywords from the scientific areas of machine learning and electronics is strengthened in comparison to the previous time slices.
Figure 10. Thematic map, time slice 4.
In this period (2019–2020), the machine learning cluster remains its place in the “basic and transversal” quadrant, continuing to be in the center of the scientific interest. The classification cluster is absorbed by the machine learning cluster, stopping to present a separate research topic. A new cluster, reinforcement learning, is formed, which is detached from the machine learning cluster. Neural networks are again among the “motor” themes, confirming their importance in scientific development.
If we consider the time slice position of the theme machine learning on the thematic maps and investigate it, its changeable mode is visible. In time slice 1, machine learning is a “motor” theme; in the next three time slices, it is classified into the “basic and transversal” cluster. Its position in the fourth quadrant is also changeable. The motion is visible from a more central to more peripheral place and again back to a more central position. This cluster content is also changeable as some merges and divergences with other themes are noted.
The cluster neural networks is also characterized by its dynamics. In the first time slice, although it is placed among the “motor” clusters, it is presented with a very small point that indicates smaller scientific production devoted to this research topic. The interest in the neural networks increases in the next time slices, as during periods 2 and 4, they form bigger “motor” clusters. In time slice 3, two clusters related to neural networks emerge: artificial neural networks and recurrent neural networks, which are placed in “emerging or declining” themes.
While the clusters low-power design and Internet of Things emerge in time slice 2, the cluster power electronics is formed in time slice 3 and the new cluster electronics occurs in time slice 4.
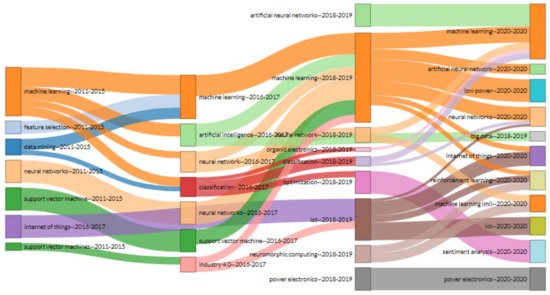
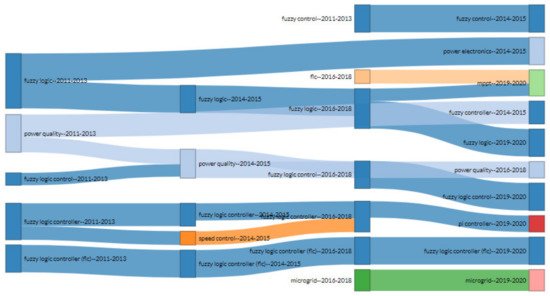
The thematic evolution map (Figure 11) shows the complex process and metamorphoses of a starting field of science to its merging or splitting with other scientific areas. Additionally, new emerging scientific sections are depicted.
Figure 11. Thematic evolution.
In summary, the findings from the performed bibliometric analysis and literature review in this section are presented through a developed conceptual framework (Figure 12). It outlines the current research areas that benefit in parallel from scientific achievements in machine learning and electronics in order to different intelligent hardware-based solutions to be created, improved or optimized. Several supervised and unsupervised machine learning techniques, algorithms for deep learning and reinforcement learning as well as evolutionary and genetic algorithms are used for the development of new methods that are capable of improving existing events, systems and processes or to propose novel solutions.
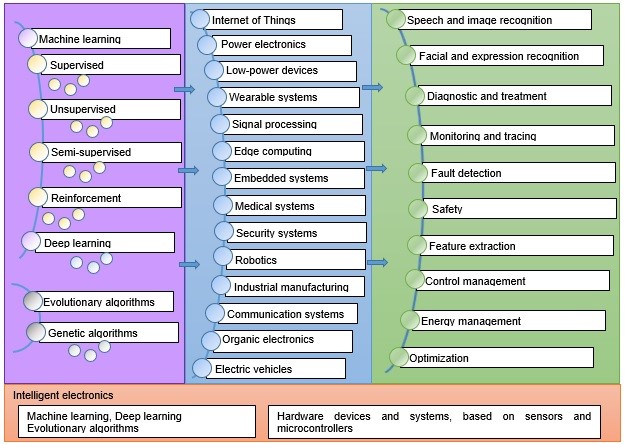
Figure 12. Conceptual framework about utilization of machine learning in electronics.
 +1 credit