Machine learning is a part of artificial intelligence science and works in close collaboration with data science. The main aim is the collected big data to be processed and studied in such a way to give meaningful knowledge when problems have to be solved or decisions have to be made. Fuzzy logic is another scientific field that is used for modeling, description and evaluation of objects and systems with different levels of complexity, which are characterized with uncertainty, fuzziness and vagueness of their parameters and properties. The application of machine learning and fuzzy logic in electronics is studied to outline the current research topics, scientific achievements and directions for future exploration.
1. Introduction
In the last three decades, there has been a tremendous expansion of digitalization and electronization. Nowadays, even the “digital native born” are familiar with the usage of electronic devices, smart phones and all kinds of intelligent systems, which are integral parts of our daily life. Everyone is immersed in the ocean of information and communication technologies and utilized artificial intelligence solutions in the form of software or hardware approaches. The simulation of human intelligence by machines is called artificial intelligence. These are programs, applications and interfaces that create the predefined reality with the preliminary known or predicted best situations.
Machine learning is a part of artificial intelligence science and works in close collaboration with data science
[1][2][1,2]. The main aim is for the collected big data to be processed and studied in such a way to give meaningful knowledge when problems have to be solved or decisions have to be made. The reviled patterns and anomalies lead to further understanding of a wide variety of events, processes, or phenomena. Machine learning is also responsible for the development and improvement of algorithms, dealing with more general or more specific tasks, with possibilities for application in different contexts
[3]. Deep learning, as a subarea of machine learning, which utilizes neural-network-based algorithms, is often the preferred method for resolving scientific and real-world problems
[4].
Every day, a large amount of data is generated and stored by companies, organizations and research departments as some of them need further processing for knowledge extraction, summarization, or conceptualization. Electronics science and industry is no exception
[5]. Both of them try to take all benefits and advantages of machine learning to automate, improve and support multiple engineering tasks
[6]. This requires more research efforts in software and hardware engineering for satisfaction of some intelligence levels. The collected data after experiments or simulations could be used for further explanation regarding the electrical behavior of electronic devices, for the prediction of some circuit functions or for the analysis of their different parameters and characteristics. Finding the precise position of object
[7], map creation from sensors data
[8] and manipulation of deformable objects
[9] are a small part of the research problems that require the application of machine learning techniques. The intention of this work is to identify the most common applications of machine learning for solving simpler or more complex problems in electronics.
Fuzzy logic is another scientific field that is used for modeling, description and evaluation of objects and systems with different levels of complexity, which are characterized with uncertainty, fuzziness and vagueness of their parameters and properties
[10]. The employed logical rules together with the created knowledge base lead to fuzzy or crisp inference that could point out one or another solution. In electronics, fuzzy logic is most often used for modeling and improvement of electronic devices, systems and processes, considering the dynamic changes of conditions and environmental settings
[11]. Algorithms and techniques for fuzzy logic realization are in continuous evolvement, striving to assist a wide variety of engineering activities. Some software and hardware systems are developed on the base of fuzzy logic in assistance and support of engineers who are responsible for the design, analysis, testing and diagnosis of electronics modules and devices.
2. Machine Learning Utilization
2.1. Scientific Production
In the Scopus database, 1535 documents are found, in which 3672 keywords are employed by 4893 authors. The authors of single-authored documents are 79; the authors of multi-authored documents are 4814; the coefficient, showing co-authors per documents, is 4.08; and the collaboration index is 3.46.
In the scientific database Web of Science, a smaller number of documents (434) is identified, written by 1810 authors as the authors of single-authored documents are 27 and the authors of multi-authored documents are 1783. The coefficient, presenting co-authors per documents, is 4.72, and the collaboration index is 3.38.
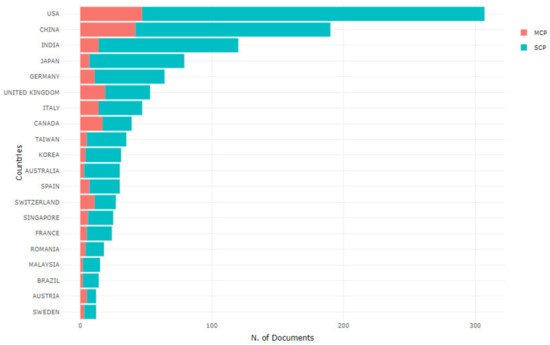
It seems that a big part of the indexed documents in Scopus and Web of Science are prepared in collaboration among several authors as the countries of the corresponding authors with the biggest contribution according to Scopus are: USA, China, India, Japan, and Germany (
Figure 12). The parameter Multiple Countries Publication (MCP) measures the international collaboration as at least one co-author should be from another country. The parameter Single Country Publication (SCP) indicates that the corresponding author and his co-authors are from one country.
Figure 12. Countries of the corresponding authors with the biggest contribution to the explored topic according to Scopus and collaboration parameters.
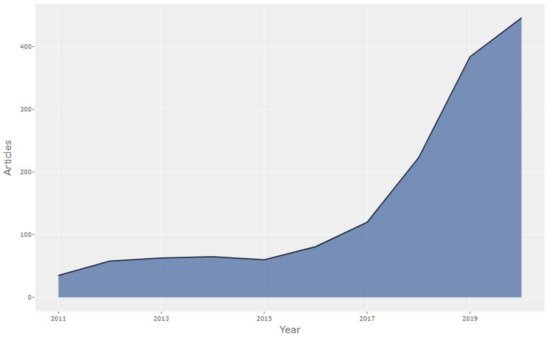
The annual scientific production in the period from 2011 to 2020 is presented in
Figure 23: for 2011, 35 documents are indexed in Scopus; for 2012, 58; 2013, 63; 2014, 65; 2015, 60; 2016, 81; 2017, 120; 2018, 223; 2019, 384; 2020, 446. The observed tendency is described with an increasing curve that can be explained with enhanced interest to this topic by researchers. No jumps causing turning points are visible on the curves. Contrariwise, the curve smoothly raises as the calculated annual growth rate is 32.68%. The annual scientific production indexed in Web of Science is also described with a smoothly increasing curve as the found documents for 2011 year are 8; for 2012 and 2013, 16; 2014, 15; 2015, 16; 2016, 33; 2017, 44; 2018, 54; 2019, 107; 2020, 121.
Figure 23. Annual scientific production according to Scopus.
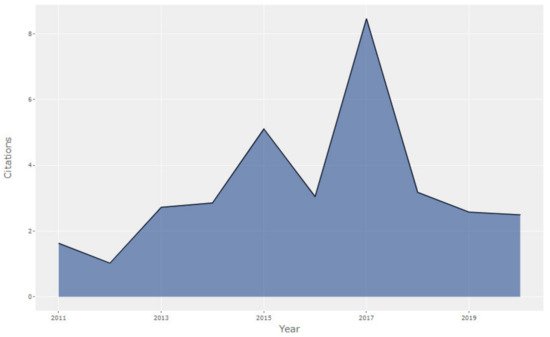
The USA, China, UK, India, Canada, Switzerland, Italy, Japan, Germany, and the Netherlands are among the most cited countries. The maximal value of the average citations per documents, indexed in Scopus, is 8.5, obtained for 2017 (
Figure 34).
Figure 34. Average article citations per year according to Scopus.
2.2. Characteristics of Sources
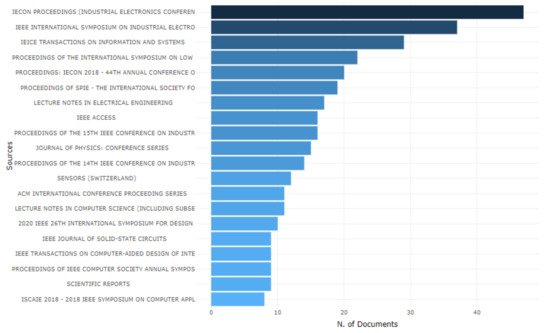
Receiving information about the sources of published papers and their impact gives an opportunity for detailed investigation into the topics of research interest. The intention is concrete papers and their discussed problems to be further explored for outlining some important key research points and main scientific themes. For this purpose, the results from the bibliographic analysis are used to point out the most influential sources. According to the Scopus database, the papers are published mainly in different conference proceedings, journals and books; the twenty most relevant sources are presented on
Figure 45. After the source grouping, it is evident that the most relevant proceedings are from the following scientific forums:
Figure 45. The most relevant sources according to Scopus.
-
Industrial Electronics Conference,
-
IEEE International Symposium on Industrial Electronics,
-
International Symposium on Low Power Electronics and Design,
-
Annual Conference of the IEEE Industrial Electronics Society,
-
SPIE conferences, organized by the International Society for Optical Engineering,
and the most preferred journals and books are:
-
IEICE Transactions on Information and Systems,
-
Lecture Notes in Electrical Engineering,
-
IEEE Access,
-
Sensors,
-
Lecture Notes in Computer Science,
-
IEEE Journal of Solid-State Circuits,
-
Scientific Reports.
According to the bibliographic data extracted from Web of Science, the top sources are the following scientific journals: IEEE Access, Scientific Reports, Journal of Instrumentation, Sensors, ACS Applied Materials & Interfaces, Applied Sciences-Basel, Electronics, Elektronika ir Elektrotechnika, IEEE Consumer Electronics Magazine, IEEE Journal of Solid-State Circuits. The obtained results show that the conference proceedings include a smaller collection of the scientific papers in comparison to the journal contributions.
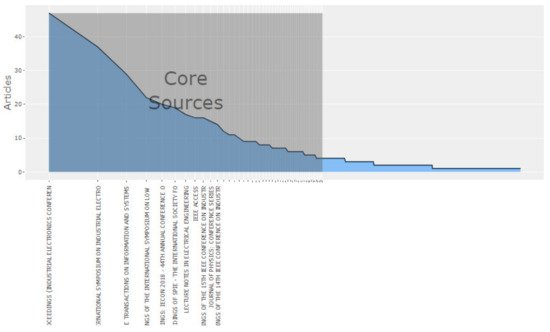
Bradford’s law is depicted on
Figure 56 (according to Scopus). It presents the number of sources in the first zone (so called core sources), which have the biggest contribution for papers publication in the explored scientific area. According to this law, the journals are grouped in three zones, as the number n of the published papers related to the examined topic forms a geometric series: 1:n:n
2:n
3. In the case of the query “
machine learning and
electronics”, the first zone includes 49 sources, mainly journals and conference proceedings, as the number of all sources is 821. The curve, which describes Bradford’s law and is constructed according to the Web of Science database, has a similar form; in the first zone, there are 57 sources from 347.
Figure 56. Bradford’s Law according to Scopus.
It is noticeable that the number of sources with open access among the most relevant ones remains low; according to Scopus, only IEICE Transactions on Information and Systems and Journal of Physics: Conference Series have open access. According to Web of Science: Sensors, ACS Applied Materials & Interfaces, Applied Sciences-Basel, Electronics, and Elektronika ir Elektrotechnika are open access.
The source importance could be evaluated through different parameters; one of the most popular is the Hirsch index (h-index). The h-index is a measure, showing the number of published papers h as each paper must be cited at least h times. The sources with the highest impact concerning h-index are summarized in
Table 1 according to Scopus and Web of Science. The results are gathered separately, searching in Scopus and Web of Science. Then, the sources are combined and arranged in the direction of higher to lower h-index.
Table 1. h-index of sources according to Scopus and Web of Science.
| Source |
h-Index |
| Nature Communications (Scopus) |
365 |
| deep learning—73 |
Physical Review A (Scopus) |
283 |
| neural networks—50 |
artificial intelligence—41 |
IEEE Journal of Solid-State Circuits (Scopus) |
215 |
| Scientific Reports (Scopus) |
and
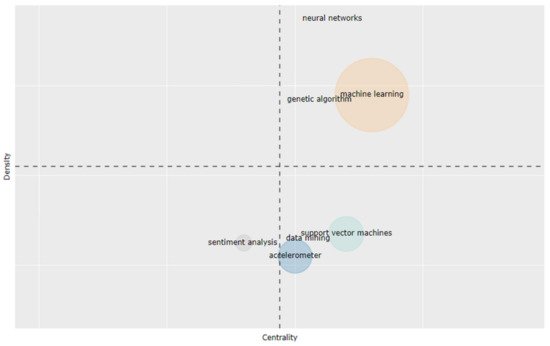
data mining. It can be noticed that a big part of the cluster names are keywords typical for machine and deep learning scientific fields, data science and computational linguistics (sentiment analysis). Only the
accelerometer (electronic device used for example in vehicle control system) cluster pertains to the electronics’ domain.
Figure 78. Thematic map, time slice 1.
This time slice characterizes the period from 2011 to 2014 year, when the “motor” clusters are
machine learning,
neural networks and
genetic algorithms. The
machine learning cluster is presented with the biggest bubble in comparison to the other clusters on the map, which indicates the biggest research interest and contribution to this topic.
Support vector machine is a machine learning algorithm and is separated in a different cluster, placed into the “basic and transversal” themes. It means that especially this algorithm is so popular in the first observed time slice among researchers, and it is utilized in different scientific works. The cluster
accelerometer is not placed in the center that is related to its not-so-big importance for research according to the parameter centrality.
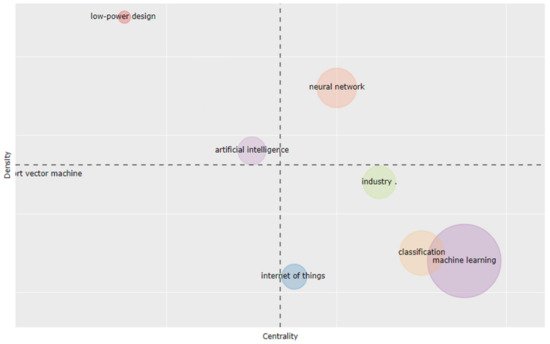
In time slice 2 (
Figure 89), the “motor” theme is related to
neural network and the “highly developed and insolated” themes are connected to the keywords
low-power design and
artificial intelligence. The theme
support vector machine is seen as a “emerging or declining” cluster. In this case, it is a “declining” cluster because in the next time slices it does not appear as a separate cluster as this keyword is included in other clusters. In the fourth quadrant, “basic and transversal” themes include
Internet of Things (IoT), industry 4.0, machine learning and
classification. In time slice 1, the keyword
classification was part of the cluster
machine learning, while here it forms a separate cluster. The closest cluster to the center of the coordinate system is
artificial intelligence that could be explained with the theme “importance and progressive development” in this time slice.
Figure 89. Thematic map, time slice 2.
It seems that during these two years (2015 and 2016), the popularity of
machine learning for solving a wide variety of problems in electronics increases as it is converted from “motor” cluster to “basic and transversal”. Algorithms for
classification are separated in different clusters that draw their importance from the investigated domain.
Internet of Things and
Industry 4.0 are formed as different clusters as the first one is more developed, taking into account the parameter Density. The “motor” cluster in this time slice is
neural network, which is connected to its possibility for deciding deep learning tasks. The bubble is bigger than this in time slice 1, which shows a higher number of scientific papers that utilize neural network apparatus.
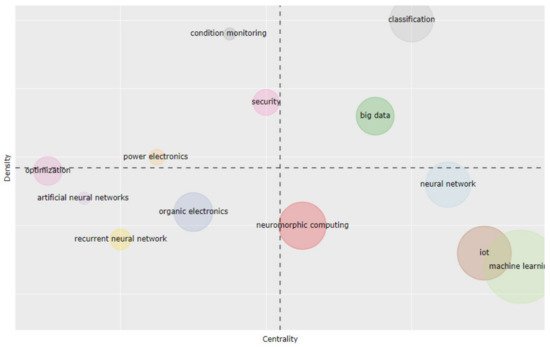
In the third time slice (
Figure 910) the “motor” theme is
classification, which includes keywords
feature extraction, fault detection and
big data. The second quadrant “highly developed and insolated” themes consist of three clusters:
condition monitoring, security and
power electronics, as the
optimization cluster is placed on the boundary between the second and third quadrant. In the third quadrant, “emerging or declining” clusters are grouped in
artificial neural networks, recurrent neural networks and
organic electronics themes. The fourth quadrant “basic and transversal” theme includes
neural network, IoT, machine learning and
neuromorphic computing.
Figure 910. Thematic map, time slice 3.
In this time period (2017–2018), the cluster
machine learning continues to be popular in scientific society and is placed in the “basic and transversal” quadrant. The cluster
classification is removed from the “basic and transversal” themes, becoming the “motor” topic. The opposite can be said for
neural networks, whose cluster is moved from “motor” themes to the “basic and transversal” quadrant. Obviously, the research attention is focused on
big data and how the
classification problems could be decided.
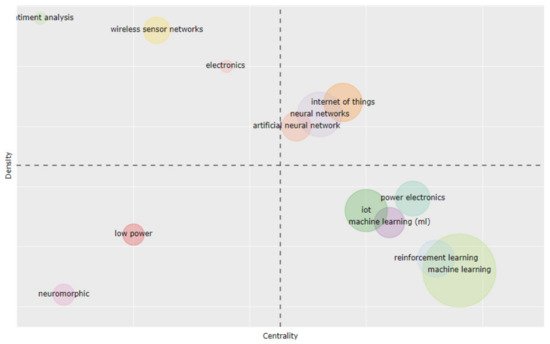
The “motor” clusters in time slice 4 (
Figure 110) are formed around the keywords
Internet of Things, neural networks and
artificial neural networks. The
wireless sensor networks,
electronics and
sentiment analysis are classified as “highly developed and insolated” themes. The “emerging or declining” clusters are topics related to
low power and
neuromorphic. The fourth quadrant includes “basic and transversal” themes:
power electronics, IoT, machine learning and
reinforcement learning. It can be observed that in this time slice, more sector names are keywords, typical for the electronics domain. It means that the mutual connection among keywords from the scientific areas of machine learning and electronics is strengthened in comparison to the previous time slices.
Figure 101. Thematic map, time slice 4.
In this period (2019–2020), the
machine learning cluster remains its place in the “basic and transversal” quadrant, continuing to be in the center of the scientific interest. The
classification cluster is absorbed by the
machine learning cluster, stopping to present a separate research topic. A new cluster,
reinforcement learning, is formed, which is detached from the
machine learning cluster.
Neural networks are again among the “motor” themes, confirming their importance in scientific development.
If we consider the time slice position of the theme
machine learning on the thematic maps and investigate it, its changeable mode is visible. In time slice 1,
machine learning is a “motor” theme; in the next three time slices, it is classified into the “basic and transversal” cluster. Its position in the fourth quadrant is also changeable. The motion is visible from a more central to more peripheral place and again back to a more central position. This cluster content is also changeable as some merges and divergences with other themes are noted.
The cluster
neural networks is also characterized by its dynamics. In the first time slice, although it is placed among the “motor” clusters, it is presented with a very small point that indicates smaller scientific production devoted to this research topic. The interest in the
neural networks increases in the next time slices, as during periods 2 and 4, they form bigger “motor” clusters. In time slice 3, two clusters related to neural networks emerge:
artificial neural networks and
recurrent neural networks, which are placed in “emerging or declining” themes.
While the clusters
low-power design and
Internet of Things emerge in time slice 2, the cluster
power electronics is formed in time slice 3 and the new cluster
electronics occurs in time slice 4.
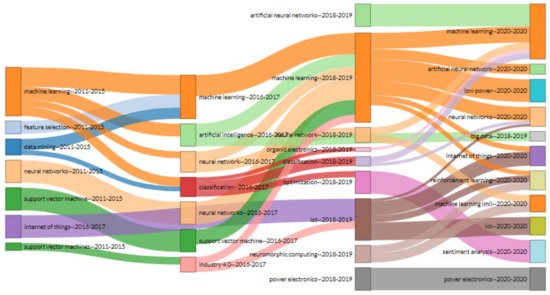
The thematic evolution map (
Figure 112) shows the complex process and metamorphoses of a starting field of science to its merging or splitting with other scientific areas. Additionally, new emerging scientific sections are depicted.
Figure 112. Thematic evolution.
In summary, the findings from the performed bibliometric analysis and literature review in this section are presented through a developed conceptual framework (Figure 12Figure 13). It outlines the current research areas that benefit in parallel from scientific achievements in machine learning and electronics in order to different intelligent hardware-based solutions to be created, improved or optimized. Several supervised and unsupervised machine learning techniques, algorithms for deep learning and reinforcement learning as well as evolutionary and genetic algorithms are used for the development of new methods that are capable of improving existing events, systems and processes or to propose novel solutions.
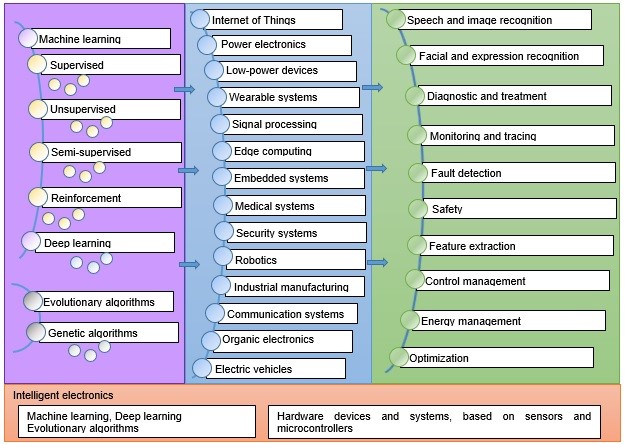
Figure 123. Conceptual framework about utilization of machine learning in electronics.
3. Application of Fuzzy Logic
This section summarizes and analyses the findings obtained after applying the bibliometric method and literature review regarding the fuzzy logic applications in electronics.
For this purpose, a second query is formed, consisting of the keywords
fuzzy logic and
electronics, and the search is conducted in the author’s keywords, abstract and title of the papers, indexed in Scopus and Web of Science.
3.1. Scientific Production
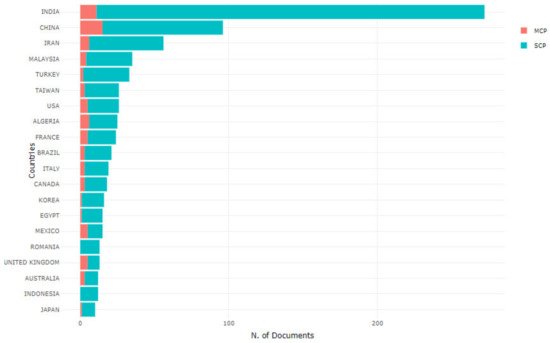
The returned results in the Scopus database include 1021 documents and the number of returned documents in Web of Science is 199. The indexed papers in Scopus have 2617 authors who utilize 2577 authors’ keywords. The authors of single-authored documents are 36 and the authors of multi-authored documents are 2581 as the coefficient describing co-authors per documents is 3.15 and the collaboration index is 2.74. In Web of Science, there are nine authors of single-authored documents and 618 authors of multi-authored documents; the average co-authors per documents is 3.35 and the collaboration index is 3.39. It is obvious that the bigger part of the published papers is collaborative work. Most often, the corresponding author and his co-authors are from one country as it is indicated through the Single Country Publication (SCP) parameter (
Figure 134). The international collaboration when at least one co-author is from another country, measured through the Multiple Countries Publication (MCP) parameter, is not so typical for this research topic. The authors from India, China, Iran, Malaysia and Turkey have the biggest contribution according to Scopus.
Figure 134. Corresponding author’s country and collaboration according to Scopus.
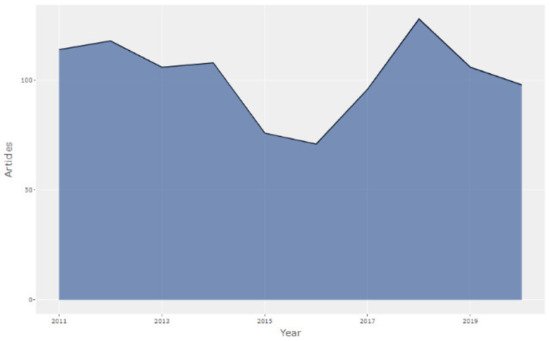
The graphics of the annual scientific production is characterized with up and down points as the maximal value is obtained in 2018 year when 128 documents are included in Scopus and the minimal value is identified in 2016 year when 71 documents are indexed (
Figure 145). Similar irregular graphics are constructed for the annual scientific production indexed in Web of Science. These strongly uneven graphics explain the negative values of the annual growth rate: −1.67% for documents indexed in Scopus and −22% for documents added in Web of Science.
Figure 145. Annual scientific production according to Scopus.
3.2. Characteristics of Sources
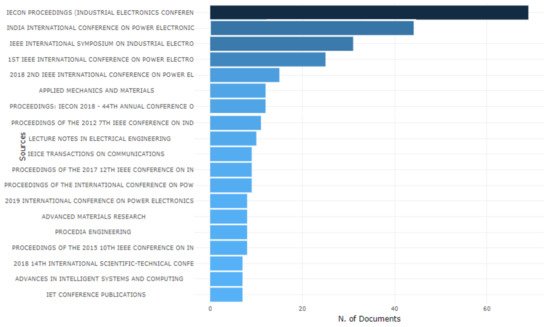
The twenty most relevant sources with published scientific papers in the explored topic according to Scopus are presented in
Figure 156. They could be categorized into two groups: proceedings of scientific forums:
Figure 156. Most relevant sources according to Scopus.
-
IECON Proceedings (Industrial Electronics Conference),
-
INDIA International Conference on Power Electronics IICPE,
-
IEEE International Symposium on Industrial Electronics,
-
IEEE International Conference on Power Electronics Intelligent Control and Energy Systems ICPEICES,
and scientific journals and books:
-
Applied Mechanics and Materials,
-
Lecture Notes in Electrical Engineering,
-
IEICE Transactions on Communications
-
Advanced Materials Research,
-
Procedia Engineering.
| Internet of Things—34 |
| 213 |
| support vector machine—27 |
Proceedings of SPIE—The International Society for Optical Engineering (Scopus) |
176 |
| low power—23 |
| clustering—19 |
feature extraction—17 |
Sensors (Switzerland) (Scopus and Web of Science) |
172 |
| Neural Networks (Scopus) |
148 |
| support vector machine—10 |
| organic electronics—9 |
Keywords plus could additionally contribute to the “big picture” creation and better paper focus understanding, concerned topics and discussed problems. Keywords plus are automatically generated, pointing out the words that are most often included in the titles of the referenced papers.
Table 3 presents the keywords plus and their occurrences according to the Scopus database.
Table 3. Keywords plus occurrences according to Scopus.
| Keyword Plus and Their Occurrences |
| learning systems—692 |
machine learning—508 |
| artificial intelligence—329 |
low power electronics—280 |
| learning algorithms—254 |
neural networks—220 |
| industrial electronics—213 |
energy efficiency—120 |
| classification of information—118 |
deep learning—115 |
| convolutional neural networks—17 |
| electric inverters—81 | energy efficiency—17 |
| forecasting—112 |
Internet of Things—112 |
low power electronics—71 |
anomaly detection—16 |
fpga—15 |
| power electronics—104 |
Neurocomputing (Scopus) |
143 |
| IEEE Access (Scopus and Web of Science) |
| 85 |
| support vector machines—103 |
reinforcement learning—16 |
edge computing—15 |
| pattern recognition—15 |
| electronics industry—100 |
electronics—94 |
127 |
| random forest—14 |
| data mining—90 |
IEEE Transactions on Computer-Aided Design of Integrated Circuits and Systems (Scopus) |
sentiment analysis—14119 |
| power electronics—14 |
Energies (Web of Science) |
93 |
| decision trees—76 |
fault diagnosis—13 |
IECON Proceedings (Industrial Electronics Conference) (Scopus) |
71 |
| computer vision—13 |
Journal of Physics: Conference Series (Scopus) |
| neuromorphic computing—13 |
image processing—12 |
| spiking neural networks—11 |
Proceedings of the International Symposium on Low Power Electronics and Design (Scopus) |
61 |
| IEEE International Symposium on Industrial Electronics (Scopus) |
53 |
| Applied Sciences (Web of Science) |
52 |
| wireless sensor networks—11 |
IEICE Transactions on Information and Systems (Scopus) |
49 |
| Electronics (Web of Science) |
36 |
| Elektronika ir Elektrotechnika (Web of Science) |
26 |
| Proceedings of IEEE Computer Society Annual Symposium On VLSI, ISVLSI (Scopus) |
26 |
2.3. Trending Research Topics
The important key points in research are identified after more detailed exploration of the used authors’ keywords. For this purpose,
Table 2 summarizes thirty keywords used in the papers with the biggest frequency of occurrences according to Scopus. The author’s keywords are defined as keywords that are written by authors who believe that these keywords in the best way describe the discussed content in the paper.
Table 2. Author’s keywords and their occurrences according to Scopus.
| Author’s Keywords and Frequency of Occurrences |
| machine learning—522 |
| robotics—10 |
| Internet of Things—10 |
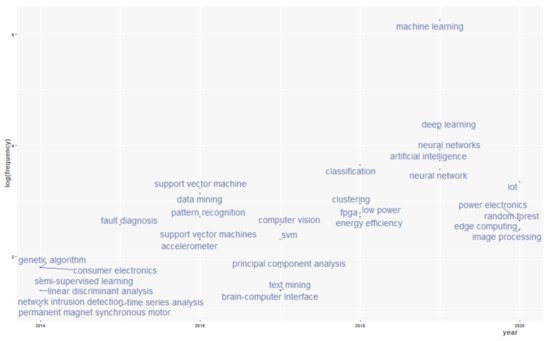
Trending research topics are drawn after the analysis of authors’ keywords and constructed visual view.
Figure 67 shows the trending map for a period of 7 years—from 2014 to 2020 according to the Scopus database. The trending topics for 2020 year are described with the authors’ keywords:
Internet of Things,
power electronics,
image processing,
edge computing,
random forest algorithm.
Figure 67. Trending topics according to Scopus.
2.4. Thematic Evolution
The scientific knowledge dynamics and knowledge evolution are grasped through the generation of some thematic maps, which are created after applying the clustering algorithm Louvain regarding the most utilized 500 authors’ keywords. Each thematic map consists of four quadrants as each quadrant shows one or more main themes/clusters. The first quadrant includes so-called “motor” clusters, the second quadrant collects “highly developed and insolated” themes, the third quadrant “emerging or declining” clusters and the fourth quadrant “basic and transversal” themes. Additionally, a thematic map is characterized by two main parameters: (1) centrality, which is related to the theme importance and (2) density, which concerns the theme development. Each cluster on the thematic map is presented through a bubble, whose name is a word with the highest occurrence in this cluster. The bigger bubbles are characterized by a higher frequency of word occurrence. The themes evolution can be studied as the examined period (2011–2020 year) is divided to time slices. Here, four time-slices are formed, taking into account the curve form of the annual scientific production (see
Figure 23): time slice 1 reflects on the period 2011–2014, time slice 2 summarizes the 2015–2016 years, time slice 3 includes 2017–2018 years and time slice 4 describes 2019–2020 years.
In the first time slice, presented on
Figure 78, the “motor” cluster is machine learning, which includes several other important keywords such as:
classification,
fault diagnosis,
computer vision,
pattern recognition,
feature extraction,
human-computer interaction,
condition monitoring,
defect prediction,
consumer electronics.
Neural networks and
genetic algorithms are also classified as “motor” themes. In the “emerging or declining” quadrant is the theme
sentiment analysis. The “basic and transversal” themes are:
support vector machines (other valuable keywords in this cluster are
wireless sensor networks and
anomaly detection),
accelerometer
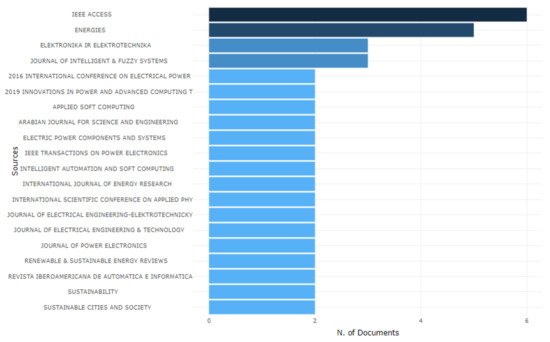
The twenty most related sources found in Web of Science are presented in
Figure 167 as they consist of mainly scientific journals such as:
Figure 167. The most relevant sources according to Web of Science.
-
IEEE Access,
-
Energies,
-
Elektronika Ir Elektrotechnika,
-
Journal of Intelligent & Fuzzy Systems,
-
Applied Soft Computing.
When the Bradford’s law is applied to the publications, indexed in Scopus, then 25 sources from 466 are found to be in the first zone, which are characterized by the biggest contribution. According to Web of Science, 34 sources are in the first zone from 169.
A summarization about the sources with the highest impact (h-index) according to Scopus and Web of Science is presented in
Table 4. It can be seen that the results from Scopus point out the conference proceedings as sources with the highest h-index in comparison to the results from Web of Science where the scientific journals are found to be with the highest impact.
Table 4. Sources indexed in Scopus and Web of Science with the highest h-index.
| Source |
h-Index |
| Applied Soft Computing (Web of Science) |
143 |
| IEEE Access (Web of Science) |
127 |
| Energies (Web of Science) |
93 |
| Procedia Engineering (Scopus) |
74 |
| IECON Proceedings (Industrial Electronics Conference) (Scopus) |
71 |
| IEICE Transactions on Communications (Scopus) |
56 |
| IEEE International Symposium on Industrial Electronics (Scopus) |
53 |
| algorithms—63 |
power quality—54 |
Applied Sciences (Web of Science) |
52 |
| Proceedings of the International Conference on Power Electronics and Drive Systems (Scopus) |
38 |
| Electronics (Web of Science) |
36 |
| Turkish Journal of Electrical Engineering and Computer Sciences (Web of Science) |
| neural networks—52 |
photovoltaic cells—51 |
30 |
| Journal of Electrical Engineering and Technology (Web of Science) |
| electric drives—51 |
electric power transmission networks—50 |
27 |
| Elektronika ir Elektrotechnika (Web of Science) |
| wind power—50 |
electric machine control—49 |
26 |
| Proceedings of the 2012 7th IEEE Conference on Industrial Electronics and Applications, ICIEA 2012 (Scopus) |
15 |
3.3. Trending Research Topics
For purposes of conceptualization the explored scientific area, deeper analysis of the author’s keywords and keywords plus is performed as the results are summarized in
Table 5 and
Table 6 (according to Scopus). It can be noticed that more utilized keywords are related to control, different types of fuzzy controllers, converters, electric vehicles and power management.
Table 5. Authors’ keywords according to Scopus.
| Author’s Keywords and Occurrences |
Table 6. Keywords plus according to Scopus.
| Keywords Plus and Occurrences |
| fuzzy logic—279 |
fuzzy logic controller—93 |
| fuzzy logic control—60 |
fuzzy logic controller flc—37 |
| fuzzy control—37 |
pi controller—36 |
| fuzzy logic—904 |
power electronics—371 |
| microgrid—18 |
| controllers—328 |
computer circuits—283 |
power quality—27 |
| fuzzy logic controllers—261 |
industrial electronics—214 |
power electronics—26 |
| fuzzy logic control—118 |
fuzzy inference—110 |
mppt (maximum power point tracker)—19 |
neural network—17 |
wind turbine—17 |
| power control—94 |
pid controller—14 |
induction motor—14 |
| energy management—12 |
photovoltaic—12 |
| DC–DC converters—88 |
boost converter—11 |
artificial intelligence—11 |
| DC–DC converter—11 |
electric vehicle—11 |
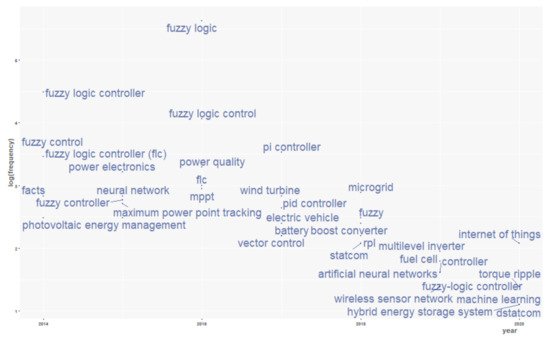
The constructed visual map about trending topics after analysis of the authors’ keywords is presented on
Figure 178. For 2020, the trending themes are related to the keywords:
Internet of Things, fuzzy-logic controller, torque ripple (an effect in electric motors)
, dstatcom (it is distribution static compensator used for controlling the power quality of distribution power systems)
, machine learning, hybrid energy storage system.
Figure 178. Trending topics according to Scopus.
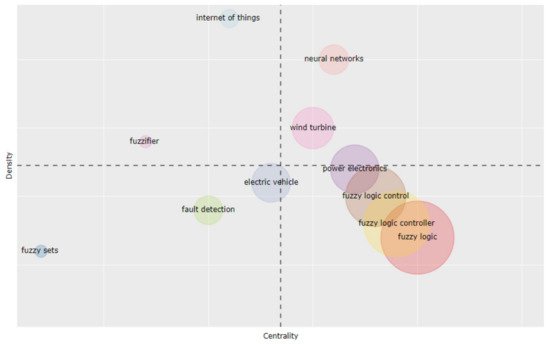
3.4. Thematic Evolution
Figure 189 presents the created thematic map for a ten-year period according to Scopus. The “motor” clusters are
wind turbine and
neural network as the cluster
power electronics is on the border between “motor” and “basic and transversal” themes. In the second quadrant are “highly developed and insolated” themes such as
Internet of Things and
fuzzifier. The clusters
fuzzy sets, fault detection and
electric vehicle occur in the third quadrant “emerging or declining” themes as the last mention cluster is in a central position. Among the “basic and transversal” themes are:
fuzzy logic, fuzzy logic control and
fuzzy logic controller. The biggest cluster is
fuzzy logic that contains keywords such as:
neural network, genetic algorithm, pid controller, induction motor, particle swarm optimization.
Figure 189. Thematic map based on the authors’ keywords.
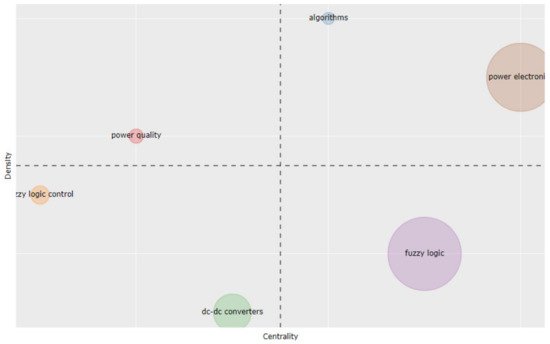
The thematic map, based on keywords plus, are shown on
Figure 1920. In comparison to the previous thematic map, based on author’s keywords, the similar clusters are
fuzzy logic and
fuzzy logic control and the different themes are:
power electronics, algorithms, power quality, DC–DC convertors.
Figure 1920. Thematic map, based on keywords plus.
The thematic map based on titles of the indexed papers in Scopus is presented on
Figure 201. It can be seen that the most utilized words in the title of papers are:
fuzzy,
motor,
electronics,
converter,
networks,
application,
power,
system.
Figure 201. Thematic map based on titles.
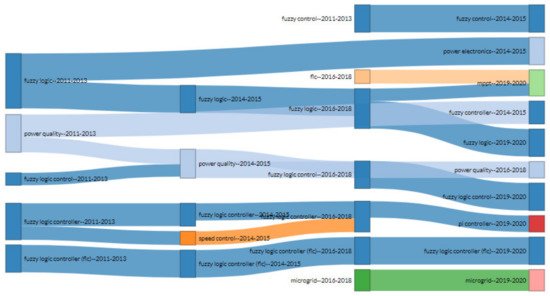
The evolution of themes, their splitting and merging, is presented on
Figure 221. This graphic is created according to the Scopus database. It can be seen that the
fuzzy logic theme diverges into three branches:
fuzzy logic,
power electronics and
fuzzy controller. At the same time, two new branches appear:
fuzzy control and
mppt (maximum power point tracker).
Figure 221. Thematic evolution.
In summary, fuzzy logic is a theory that finds wide applications in the realization of hardware-based systems for control, power management, monitoring and diagnostics, fault detection, prediction and optimization.
References
- Sarker, I.H. Machine Learning: Algorithms, Real-World Applications and Research Directions. SN Comput. Sci. 2021, 2, 160. https://doi.org/10.1007/s42979-021-00592-x.
- L’Heureux, A.; Grolinger, K.; ElYamany, H.F.; Capretz, M.A.M. Machine Learning With Big Data: Challenges and Approaches. IEEE Access 2017, 5, 7776–7797. https://doi.org/10.1109/ACCESS.2017.2696365.
- Amornsamankul, S.; Pimpunchat, B.; Triampo, W.; Charoenpong, J.; Nuttavut, N. A Comparison of Machine Learning Algorithms and Their Applications. J. Simul. Syst. Sci. Technol. 2019, 19, 20. https://doi.org/10.5013/IJSSST.a.20.04.08.
- Shrestha, A.; Mahmood, A. Review of Deep Learning Algorithms and Architectures. IEEE Access 2019, 7, 53040–53065. https://doi.org/10.1109/ACCESS.
- Lv, S.; Kim, H.; Zheng, B.; Jin, H. A Review of Data Mining with Big Data towards Its Applications in the Electronics Industry. Sci. 2018, 7, 582. https://doi.org/10.3390/app8040582.
- Elfadel, I.M., Boning, D.S., Li, X. (Eds.) Machine Learning in VLSI Computer-Aided Design; Springer International Publishing: Berlin/Heidelberg, Germany, 2019; ISBN: 978-3-030-04666-8.
- Hensel, S.; Marinov, M.B.; Schmitt, M. Object Detection and Mapping with Unmanned Aerial Vehicles Using Convolutional Neural Networks. In Future Access Enablers for Ubiquitous and Intelligent Infrastructures; Perakovic, D., Knapcikova, L., Eds.; FABULOUS 2021. Lecture Notes of the Institute for Computer Sciences. Social Informatics and Telecommunications Engineering; Springer: Cham, Switzerland, 2021; Volume 382. https://doi.org/10.1007/978-3-030-78459-1_19.
- Hensel, S.; Marinov, M.B.; Schwilk, T.; Nikolov, D. Application of Gaussian Process Estimation for Magnetic Field Mapping. In Future Access Enablers for Ubiquitous and Intelligent Infrastructures; Perakovic, D., Knapcikova, L., Eds.; FABULOUS 2021; Lecture Notes of the Institute for Computer Sciences, Social Informatics and Telecommunications Engineering; Springer: Cham, Switzerland, 2021; Volume 382. https://doi.org/10.1007/978-3-030-78459-1_21.
- Hu, Z.; Han, T.; Sun, P.; Pan, J.; Manocha, D. 3D Deformable Object Manipulation using Deep Neural Networks. IEEE Robot. Autom. Lett. 2019, 4, 4255–4261. https://doi.org/10.1109/LRA.2019.2930476.
- Ross, T.J. Fuzzy Logic with Engineering Applications, 4th ed.; Wiley-Blackwell: Hoboken, NJ, USA, 2016; ISBN: 978-1-119-23586-6.
- Dumitrescu, C.; Ciotirnae, P.; Vizitiu, C. Fuzzy Logic for Intelligent Control System Using Soft Computing Applications. Sensors 2021, 21, 2617. https://doi.org/10.3390/s21082617.