 +1 credit
Video Upload Options
Ambient mass spectrometry imaging (AMSI) has attracted much attention in recent years. As a kind of unlabeled molecular imaging technique, AMSI can enable in situ visualization of a large number of compounds in biological tissue sections in ambient conditions. In this review, the developments of various AMSI techniques are discussed according to one-step and two-step ionization strategies. In addition, recent applications of AMSI for lipid and metabolite analysis (from 2016 to 2021) in disease diagnosis, animal model research, plant science, drug metabolism and toxicology research, etc., are summarized. Finally, further perspectives of AMSI in spatial resolution, sensitivity, quantitative ability, convenience and software development are proposed.
1. Introduction
Mass spectrometry imaging (MSI) is a powerful analytical method, which is able to visualize the spatial distribution of a large number of compounds from the complex sample surface in a single experiment [1]. Generally in MSI experiments, the sample sections should be carefully prepared and then scanned and ionized by various desorption/ionization methods. The ion intensity of each individual compound at the target mass-to-charge ratio (m/z) are extracted from each pixel’s mass spectrum and combined into a heat map revealing the relative distribution of that compound throughout the sample surface. Compared with conventional tagprobe labeling optical imaging methods, MSI enables the un-targeted imaging of multiple compounds without the need for labeling.
Ambient mass spectrometry refers to those ionization techniques operated in an atmospheric environment with little or no sample preparation [2][3]. It was firstly introduced by Cooks et al. in 2004 with the invention of desorption electrospray ionization (DESI) [4]. Due to its high sensitivity, high speed and easy operation at native conditions, ambient mass spectrometry was widely used in MSI, and ambient mass spectrometry imaging (AMSI) has been developed to be an important branch of MSI. In AMSI, compounds are desorbed from the sample surface at ambient conditions, ionized by charged microdroplets, photons or plasma, and then introduced into the mass spectrometer for further detection. Up to now, AMSI techniques based on different ionization methods have been proposed for the improvement of sensitivity and spatial resolution, and they have been widely applied in disease diagnosis, drug metabolism, toxicology research, forensic investigation and plant science [5][6][7][5–7]. Lipid and metabolite are the small-molecule entities that have key roles for the establishment of physiological function within the biological systems. The MSI of a global lipid and the metabolite profile from a biological tissue can help with an enhanced understanding of disease molecular mechanisms, the discovery of biomarkers and the elucidation the mechanisms of drug action[8].
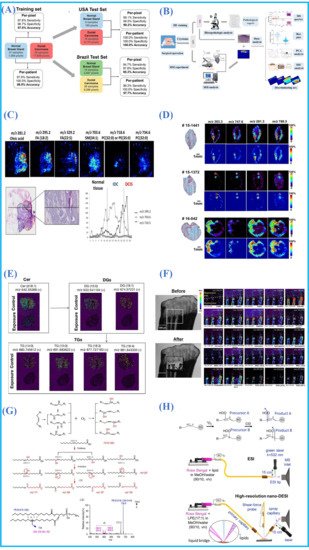
Several excellent reviews on different topics of AMSI have been reported. For example, Xue et al. summarized AMSI techniques from the aspects of ion source devices, ionization mechanism, resolution, sensitivity and applications in 2019 [9]. Xiao et al. introduced the important applications of the AMSI technique in pharmacology, drug metabolism, clinical diagnosis and toxicological evaluation in 2020 [10]. In this review, we will summarize the developments of AMSI technologies according to one-step/two-step ionization strategies and their application advances in lipid and metabolite from 2016 to 2021. In addition, the prospects of AMSI techniques and their applications for biological samples in the near future are discussed. Figure 1 shows the schemes of AMSI for lipid and metabolite analysis in this work.

2. Development of AMSI Techniques
In AMSI, the process of target analytes on the sample surface being desorbed and simultaneously ionized is called the one-step ionization strategy, whereas when the desorbed analytes are post-ionized by another ionization source this is called the two-step ionization strategy.
2.1. One-Step Ionization Strategy
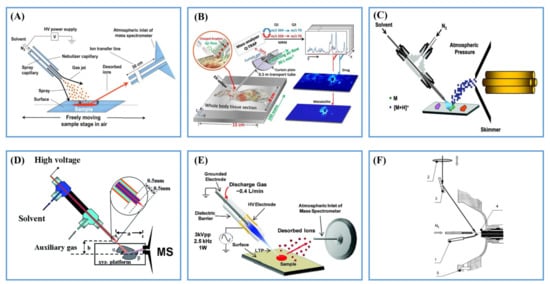
2.1.1. Desorption Electrospray Ionization (DESI)
2.1.2. Desorption Atmospheric Pressure Chemical Ionization (DAPCI) and Low-Temperature Plasma (LTP)
2.1.3. Atmospheric Pressure Matrix-Assisted Laser Desorption/Ionization (AP-MALDI)2.2. Two-Step Ionization Strategy
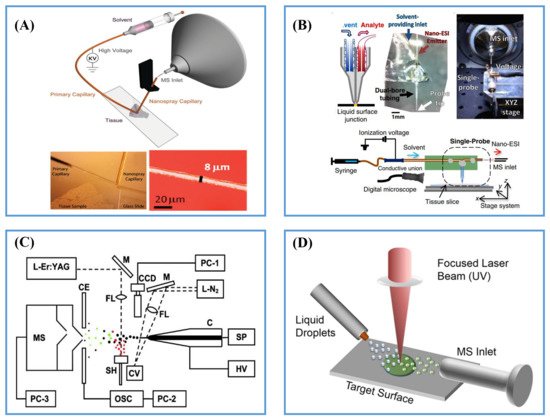
In the two-step ionization strategy, desorption and ionization of analytes are separated into two steps: (1) generating analyte-containing droplets/particles/gastification products from target samples; (2) post-ionizing the desorbed neutral species. The first step is normally fulfilled by thermal desorption, laser desorption and droplet pick-up, etc. As is well known to us, some compounds can be ionized during the initial laser desorption and microdroplets pick-up processes. However, due to the matrix effect in the microenvironment of biological tissues, most of the desorbed molecules are not ionized [16]. In the second step, the desorbed neutral species can be post-ionized by using charged microdroplets, plasma or photons in ambient conditions.
2.2.1. Post-Ionization by ESI
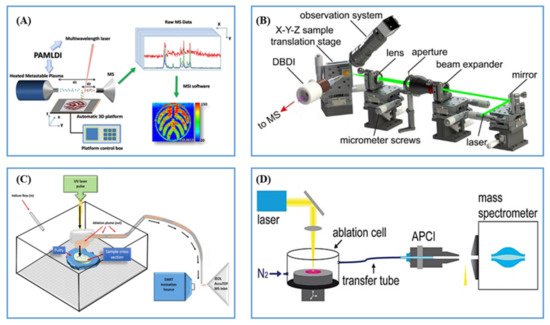
2.2.2. Post-Ionization by Plasma Ionization
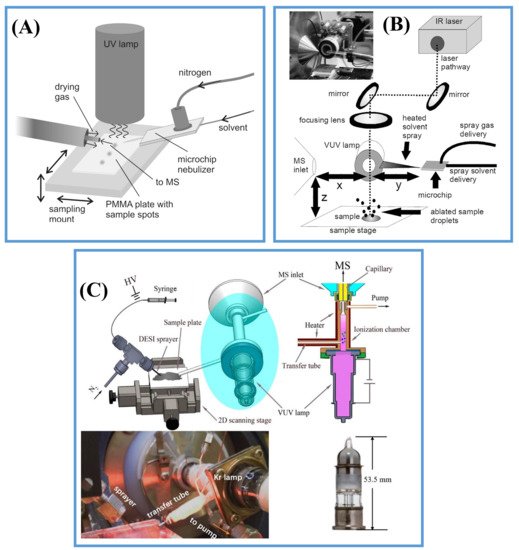
2.2.3. Post-Ionization by Photoionization (PI)
3. Applications in Lipids and Metabolites
3.1. Lipids
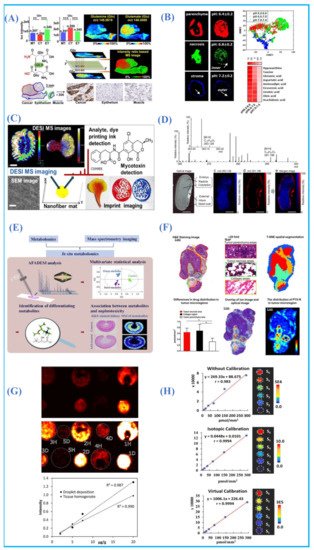
Lipids are components of the cell membrane, and they play a vital role in cell membrane fluidity, neurotransmitter transmission and transport and energy supply[28][29] Lipid compositions can reflect histological type and cell growth state; hence, the alteration of lipid metabolism is linked to the occurrence of several human diseases[30], such as Alzheimer’s disease, breast cancer [31] and basal cell carcinoma [32]. Lipidomic analysis can provide valuable information for understanding the molecular pathological mechanisms of many diseases, diagnosis and differentiation of diseases and assessment of resection margins during clinical surgery, etc.[6][33][34][35]. It should be noted that the spatial distribution of proteins could also be visualized by the fluorescent labeling method, termed immunohistochemistry and immunofluorescence, whereas few other technologies can image lipids [36]. In past years, it has been demonstrated that AMSI techniques can be performed to visualize the spatial distribution of the sample surface compounds in the native state, and that they have a high sensitivity to lipids and other small molecules in diseased tissues, animal models and plants, etc.
3.2. Metabolites
Molecular metabolites such as neurotransmitters, amino acids and vitamins play an important role in biosynthesis, energy production and supply, signal transduction and regulation and cognitive processes [44][45][46]. Changes in small molecules metabolites are often closely related to the nervous system and disease states, such as depression, Alzheimer’s disease, movement disorders, being overweight, obesity and so on[47][48][49][50][51]. Therefore, a comprehensive and detailed understanding of the relative abundance and spatial distribution of small-molecule metabolites in organisms is an outstanding contribution to further understanding the metabolic reorganization of tumors, elucidating the metabolic mechanism in the process of disease development and searching for potential metabolic markers for disease diagnosis. As an unlabeled molecular imaging method, AMSI technique can obtain spatial distribution information of many small-molecule metabolites in a single experiment with little or without any pretreatment. For the imaging of labile metabolites in ambient conditions, the labile group could be protected via in situ chemical derivatization[52] .
References
- Chen, K.; Baluya, D.; Tosun, M.; Li, F.; Maletic-Savatic, M. Imaging Mass Spectrometry: A New Tool to Assess Molecular Underpinnings of Neurodegeneration. Metabolites 2019, 9, 135. [Google Scholar] [CrossRef] [PubMed]
- Kuo, T.-H.; Dutkiewicz, E.P.; Pei, J.; Hsu, C.-C. Ambient Ionization Mass Spectrometry Today and Tomorrow: Embracing Challenges and Opportunities. Anal. Chem. 2020, 92, 2353–2363. [Google Scholar] [CrossRef] [PubMed]
- Cooks, R.G.; Zheng, O.; Zoltan, T.; Wiseman, J.M. Ambient Mass Spectrometry. Science 2006, 311, 1566–1570. [Google Scholar] [CrossRef] [PubMed]
- Takáts, Z.; Wiseman, J.M.; Gologan, B.; Cooks, R.G. Mass Spectrometry Sampling under Ambient Conditions with Desorption Electrospray Ionization. Science 2004, 306, 471–473. [Google Scholar] [CrossRef]
- Karlsson, O.; Hanrieder, J. Imaging mass spectrometry in drug development and toxicology. Arch. Toxicol. 2017, 91, 2283–2294. [Google Scholar] [CrossRef]
- Calligaris, D.; Caragacianu, D.; Liu, X.; Norton, I.; Thompson, C.J.; Richardson, A.L.; Golshan, M.; Easterling, M.L.; Santagata, S.; Dillon, D.A.; et al. Application of desorption electrospray ionization mass spectrometry imaging in breast cancer margin analysis. Proc. Natl. Acad. Sci. USA 2014, 111, 15184–15189. [Google Scholar] [CrossRef]
- Hu, W.; Han, Y.; Sheng, Y.; Wang, Y.; Pan, Q.; Nie, H. Mass spectrometry imaging for direct visualization of components in plants tissues. J. Sep. Sci. 2021, 44, 3462–3476. [Google Scholar] [CrossRef]
- Miura, D.; Yoshinori, F.; Hiroyuki, W. In Situ Metabolomic Mass Spectrometry Imaging: Recent Advances and Difficulties. J. Proteom. 2012, 75, 5052–5060. [Google Scholar] [CrossRef]
- Xue, J.; Bai, Y.; Liu, H. Recent advances in ambient mass spectrometry imaging. TrAC Trends Anal. Chem. 2019, 120, 115659. [Google Scholar] [CrossRef]
- Xiao, Y.; Deng, J.; Yao, Y.; Fang, L.; Yang, Y.; Luan, T. Recent Advances of Ambient Mass Spectrometry Imaging for Biological Tissues: A Review. Anal. Chim. Acta 2020, 1117, 74–88. [Google Scholar] [CrossRef]
- Luo, Z.; He, J.; Chen, Y.; He, J.; Gong, T.; Tang, F.; Wang, X.; Zhang, R.; Huang, L.; Zhang, L.; et al. Air Flow-Assisted Ionization Imaging Mass Spectrometry Method for Easy Whole-Body Molecular Imaging under Ambient Conditions. Anal. Chem. 2013, 85, 2977–2982. [Google Scholar] [CrossRef]
- Haddad, R.; Milagre, H.; Catharino, R.; Eberlin, M.N. Easy Ambient Sonic-Spray Ionization Mass Spectrometry Combined with Thin-Layer Chromatography. Anal. Chem. 2008, 80, 2744–2750. [Google Scholar] [CrossRef]
- Ouyang, Y.; Liu, J.; Nie, B.; Dong, N.; Chen, X.; Chen, L.; Wei, Y. Differential diagnosis of human lung tumors using surface desorption atmospheric pressure chemical ionization imaging mass spectrometry. RSC Adv. 2017, 7, 56044–56053. [Google Scholar] [CrossRef]
- Harper, J.D.; Charipar, N.A.; Mulligan, C.C.; Zhang, X.; Cooks, R.G.; Ouyang, Z. Low-Temperature Plasma Probe for Ambient Desorption Ionization. Anal. Chem. 2008, 80, 9097–9104. [Google Scholar] [CrossRef]
- Laiko, V.V.; Moyer, S.C.; Cotter, R.J. Atmospheric Pressure MALDI/Ion Trap Mass Spectrometry. Anal. Chem. 2000, 72, 5239–5243. [Google Scholar] [CrossRef]
- Soltwisch, J.; Kettling, H.; Vens-Cappell, S.; Wiegelmann, M.; Müthing, J.; Dreisewerd, K. Mass spectrometry imaging with laser-induced postionization. Science 2015, 348, 211–215. [Google Scholar] [CrossRef] [PubMed]
- Laskin, J.; Heath, B.S.; Roach, P.J.; Cazares, L.; Semmes, O.J. Tissue Imaging Using Nanospray Desorption Electrospray Ionization Mass Spectrometry. Anal. Chem. 2012, 84, 141–148. [Google Scholar] [CrossRef]
- Rao, W.; Pan, N.; Yang, Z. High Resolution Tissue Imaging Using the Single-probe Mass Spectrometry under Ambient Conditions. J. Am. Soc. Mass Spectrom. 2015, 26, 986–993. [Google Scholar] [CrossRef]
- Nemes, P.; Vertes, A. Laser Ablation Electrospray Ionization for Atmospheric Pressure, in Vivo, and Imaging Mass Spectrometry. Anal. Chem. 2007, 79, 8098–8106. [Google Scholar] [CrossRef]
- Lee, J.K.; Jansson, E.T.; Nam, H.G.; Zare, R.N. High-Resolution Live-Cell Imaging and Analysis by Laser Desorption/Ionization Droplet Delivery Mass Spectrometry. Anal. Chem. 2016, 88, 5453–5461. [Google Scholar] [CrossRef]
- Feng, B.; Zhang, J.; Chang, C.; Li, L.; Li, M.; Xiong, X.; Guo, C.; Tang, F.; Bai, Y.; Liu, H. Ambient Mass Spectrometry Imaging: Plasma Assisted Laser Desorption Ionization Mass Spectrometry Imaging and Its Applications. Anal. Chem. 2014, 86, 4164–4169. [Google Scholar] [CrossRef]
- Lu, Q.; Xu, Z.; You, X.; Ma, S.; Zenobi, R. Atmospheric Pressure Mass Spectrometry Imaging Using Laser Ablation, Followed by Dielectric Barrier Discharge Ionization. Anal. Chem. 2021, 93, 6232–6238. [Google Scholar] [CrossRef] [PubMed]
- Fowble, K.L.; Teramoto, K.; Cody, R.B.; Edwards, D.; Guarrera, D.; Musah, R.A. Development of Laser Ablation Direct Analysis in Real Time Imaging Mass Spectrometry: Application to Spatial Distribution Mapping of Metabolites Along the Biosynthetic Cascade Leading to Synthesis of Atropine and Scopolamine in Plant Tissue. Anal. Chem. 2017, 89, 3421–3429. [Google Scholar] [CrossRef] [PubMed]
- Herdering, C.; Reifschneider, O.; Wehe, C.A.; Sperling, M.; Karst, U. Ambient Molecular Imaging by Laser Ablation Atmospheric Pressure Chemical Ionization Mass Spectrometry. Rapid Commun. Mass Spectrom. 2013, 27, 2595–2600. [Google Scholar] [CrossRef]
- Haapala, M.; Pól, J.; Saarela, V.; Arvola, V.; Kotiaho, T.; Ketola, R.A.; Franssila, S.; Kauppila, T.J.; Kostiainen, R. Desorption Atmospheric Pressure Photoionization. Anal. Chem. 2007, 79, 7867–7872. [Google Scholar] [CrossRef]
- Vaikkinen, A.; Shrestha, B.; Kauppila, T.J.; Vertes, A.; Kostiainen, R. Infrared Laser Ablation Atmospheric Pressure Photoionization Mass Spectrometry. Anal. Chem. 2012, 84, 1630–1636. [Google Scholar] [CrossRef]
- Liu, C.; Qi, K.; Yao, L.; Xiong, Y.; Zhang, X.; Zang, J.; Tian, C.; Xu, M.; Yang, J.; Lin, Z.; et al. Imaging of Polar and Nonpolar Species Using Compact Desorption Electrospray Ionization/Postphotoionization Mass Spectrometry. Anal. Chem. 2019, 91, 6616–6623. [Google Scholar] [CrossRef]
- Han, X.; Yang, K.; Gross, R.W. Multi-dimensional mass spectrometry-based shotgun lipidomics and novel strategies for lipidomic analyses. Mass Spectrom. Rev. 2012, 31, 134–178. [Google Scholar] [CrossRef]
- Deng, J.; Yang, Y.; Luo, L.; Xiao, Y.; Luan, T. Lipid analysis and lipidomics investigation by ambient mass spectrometry. TrAC Trends Anal. Chem. 2020, 128, 115924. [Google Scholar] [CrossRef]
- Yang, L.; Li, M.; Shan, Y.; Shen, S.; Bai, Y.; Liu, H. Recent advances in lipidomics for disease research. J. Sep. Sci. 2016, 39, 38–50. [Google Scholar] [CrossRef]
- Santoro, A.L.; Drummond, R.D.; Da Silva, I.T.; Ferreira, S.S.; Juliano, L.; Vendramini, P.H.; Lemos, M.B.D.C.; Eberlin, M.N.; De Andrade, V.P. In Situ DESI-MSI Lipidomic Profiles of Breast Cancer Molecular Subtypes and Precursor Lesions. Cancer Res. 2020, 80, 1246–1257. [Google Scholar] [CrossRef]
- Margulis, K.; Chiou, A.S.; Aasi, S.Z.; Tibshirani, R.J.; Tang, J.Y.; Zare, R.N. Distinguishing Malignant from Benign Microscopic Skin Lesions Using Desorption Electrospray Ionization Mass Spectrometry Imaging. Proc. Natl. Acad. Sci. USA 2018, 115, 6347–6352. [Google Scholar] [CrossRef]
- Eberlin, L.S.; Dill, A.L.; Golby, A.J.; Ligon, K.L.; Wiseman, J.M.; Cooks, R.G.; Agar, N.Y. Discrimination of Human Astrocytoma Subtypes by Lipid Analysis Using Desorption Electrospray Ionization Imaging Mass Spectrometry. Angew. Chem. Int. Ed. 2010, 49, 5953–5956. [Google Scholar] [CrossRef]
- Calligaris, D.; Feldman, D.R.; Norton, I.; Olubiyi, O.; Changelian, A.N.; Machaidze, R.; Vestal, M.L.; Laws, E.R.; Dunn, I.F.; Santagata, S.; et al. MALDI mass spectrometry imaging analysis of pituitary adenomas for near-real-time tumor delineation. Proc. Natl. Acad. Sci. USA 2015, 112, 9978–9983. [Google Scholar] [CrossRef]
- Eberlin, L.S.; Margulis, K.; Planell-Mendez, I.; Zare, R.N.; Tibshirani, R.; Longacre, T.A.; Jalali, M.; Norton, J.A.; Poultsides, G.A. Pancreatic Cancer Surgical Resection Margins: Molecular Assessment by Mass Spectrometry Imaging. PLoS Med. 2016, 13, e1002108. [Google Scholar] [CrossRef]
- Castellanos, A.; Hernandez, M.G.; Tomic-Canic, M.; Jozic, I.; Fernandez-Lima, F. Multimodal, in Situ Imaging of Ex Vivo Human Skin Reveals Decrease of Cholesterol Sulfate in the Neoepithelium during Acute Wound Healing. Anal. Chem. 2020, 92, 1386–1394. [Google Scholar] [CrossRef]
- Porcari, A.M.; Zhang, J.; Garza, K.Y.; Rodrigues-Peres, R.M.; Lin, J.Q.; Young, J.H.; Tibshirani, R.; Nagi, C.; Paiva, G.R.; Carter, S.A.; et al. Multicenter Study Using Desorption-Electrospray-Ionization-Mass-Spectrometry Imaging for Breast-Cancer Diagnosis. Anal. Chem. 2018, 90, 11324–11332. [Google Scholar] [CrossRef]
- Qi, K.; Lv, Y.; Ren, Y.; Wang, X.; Wu, L.; Wang, J.; Zhang, X.; He, Y.; Zhang, C.; Liu, C.; et al. Cholesterol was identified as a biomarker in human melanocytic nevi using DESI and DESI/PI mass spectrometry imaging. Talanta 2021, 231, 122380. [Google Scholar] [CrossRef]
- Mao, X.; He, J.; Li, T.; Lu, Z.; Sun, J.; Meng, Y.; Abliz, Z.; Chen, J. Application of imaging mass spectrometry for the molecular diagnosis of human breast tumors. Sci. Rep. 2016, 6, 21043. [Google Scholar] [CrossRef]
- Zeng, T.; Guo, W.; Jiang, L.; Luo, Q.; Shi, Z.; Lei, B.; Zhang, J.; Cai, Z. Integration of omics analysis and atmospheric pressure MALDI mass spectrometry imaging reveals the cadmium toxicity on female ICR mouse. Sci. Total Environ. 2021, 801, 149803. [Google Scholar] [CrossRef]
- Kim, J.Y.; Lee, S.Y.; Kim, H.; Park, J.-W.; Lim, D.-K.; Moon, D.W. Biomolecular Imaging of Regeneration of Zebrafish Caudal Fins Using High Spatial Resolution Ambient Mass Spectrometry. Anal. Chem. 2018, 90, 12723–12730. [Google Scholar] [CrossRef]
- Zhang, J.; Huo, X.; Guo, C.; Ma, X.; Huang, H.; He, J.; Wang, X.; Tang, F. Rapid Imaging of Unsaturated Lipids at an Isomeric Level Achieved by Controllable Oxidation. Anal. Chem. 2021, 93, 2114–2124. [Google Scholar] [CrossRef]
- Unsihuay, D.; Su, P.; Hu, H.; Qiu, J.; Kuang, S.; Li, Y.; Sun, X.; Dey, S.K.; Laskin, J. Imaging and Analysis of Isomeric Unsaturated Lipids through Online Photochemical Derivatization of Carbon-Carbon Double Bonds. Angew. Chem. Int. Ed. 2021, 60, 7559–7563. [Google Scholar] [CrossRef]
- Cao, Q.; Wang, Y.; Chen, B.; Ma, F.; Hao, L.; Li, G.; Ouyang, C.; Li, L. Visualization and Identification of Neurotransmitters in Crustacean Brain via Multifaceted Mass Spectrometric Approaches. ACS Chem. Neurosci. 2019, 10, 1222–1229. [Google Scholar] [CrossRef] [PubMed]
- Kroll, J.L.; Steele, A.M.; Pinkham, A.E.; Choi, C.; Khan, D.A.; Patel, S.V.; Chen, J.R.; Aslan, S.; Brown, E.S.; Ritz, T. Hippocampal metabolites in asthma and their implications for cognitive function. NeuroImage Clin. 2018, 19, 213–221. [Google Scholar] [CrossRef] [PubMed]
- Rinschen, M.M.; Ivanisevic, J.; Giera, M.; Siuzdak, G. Identification of bioactive metabolites using activity metabolomics. Nat. Rev. Mol. Cell Biol. 2019, 20, 353–367. [Google Scholar] [CrossRef] [PubMed]
- Wang, R.; Satizabal, C.L.; Beiser, A.S.; Vasan, R.S.; DeCarli, C.; Gerszten, R.E.; Yang, Q.; Seshadri, S. Circulating metabolites associated with brain MRI markers of Alzheimer’s disease. Alzheimers Dement. 2020, 16, e044283. [Google Scholar] [CrossRef]
- Ozden, A.; Angelos, H.; Feyza, A.; Elizabeth, W.; John, P. Altered plasma levels of arginine metabolites in depression. J. Psychiatr. Res. 2020, 120, 21–28. [Google Scholar] [CrossRef]
- Doummar, D.; Moussa, F.; Nougues, M.-C.; Ravelli, C.; Louha, M.; Whalen, S.; Burglen, L.; Rodriguez, D.; De Villemeur, T.B. Monoamine neurotransmitters and movement disorders in children and adults. Rev. Neurol. 2018, 174, 581–588. [Google Scholar] [CrossRef]
- Cani, P.D. Microbiota and metabolites in metabolic diseases. Nat. Rev. Endocrinol. 2019, 15, 69–70. [Google Scholar] [CrossRef]
- Crabtree, G.W.; Gogos, J.A. Role of Endogenous Metabolite Alterations in Neuropsychiatric Disease. ACS Chem. Neurosci. 2018, 9, 2101–2113. [Google Scholar] [CrossRef]
- Zhuang, M.; Hou, Z.; Chen, P.; Liang, G.; Huang, G. Introducing charge tag via click reaction in living cells for single cell mass spectrometry. Chem. Sci. 2020, 11, 7308–7312. [Google Scholar] [CrossRef]
- Sun, C.; Li, T.; Song, X.; Huang, L.; Zang, Q.; Xu, J.; Bi, N.; Jiao, G.; Hao, Y.; Chen, Y.; et al. Spatially resolved metabolomics to discover tumor-associated metabolic alterations. Proc. Natl. Acad. Sci. USA 2018, 116, 52–57. [Google Scholar] [CrossRef]
- Song, X.; Zang, Q.; Zare, R.N. Hydrogen–Deuterium Exchange Desorption Electrospray Ionization Mass Spectrometry Visualizes an Acidic Tumor Microenvironment. Anal. Chem. 2021, 93, 10411–10417. [Google Scholar] [CrossRef]
- Hemalatha, R.G.; Ganayee, M.A.; Pradeep, T. Electrospun Nanofiber Mats as “Smart Surfaces” for Desorption Electrospray Ionization Mass Spectrometry (Desi Ms)-Based Analysis and Imprint Imaging. Anal. Chem. 2016, 88, 5710–5717. [Google Scholar] [CrossRef]
- Enomoto, H.; Sensu, T.; Sato, K.; Sato, F.; Paxton, T.; Yumoto, E.; Miyamoto, K.; Asahina, M.; Yokota, T.; Yamane, H. Visualisation of Abscisic Acid and 12-Oxo-Phytodienoic Acid in Immature Phaseolus vulgaris L. Seeds Using Desorption Electrospray Ionisation-Imaging Mass Spectrometry. Sci. Rep. 2017, 7, 42977. [Google Scholar] [CrossRef]
- Wang, Z.; He, B.; Liu, Y.; Huo, M.; Fu, W.; Yang, C.; Wei, J.; Abliz, Z. In situ metabolomics in nephrotoxicity of aristolochic acids based on air flow-assisted desorption electrospray ionization mass spectrometry imaging. Acta Pharm. Sin. B 2020, 10, 1083–1093. [Google Scholar] [CrossRef]
- Zhang, J.; Du, Q.; Song, X.; Gao, S.; Pang, X.; Li, Y.; Zhang, R.; Abliz, Z.; He, J. Evaluation of the tumor-targeting efficiency and intratumor heterogeneity of anticancer drugs using quantitative mass spectrometry imaging. Theranostics 2020, 10, 2621–2630. [Google Scholar] [CrossRef]
- Hansen, H.T.; Janfelt, C. Aspects of Quantitation in Mass Spectrometry Imaging Investigated on Cryo-Sections of Spiked Tissue Homogenates. Anal. Chem. 2016, 88, 11513–11520. [Google Scholar] [CrossRef]
- Song, X.; He, J.; Pang, X.; Zhang, J.; Sun, C.; Huang, L.; Li, C.; Zang, Q.; Li, X.; Luo, Z.; et al. Virtual Calibration Quantitative Mass Spectrometry Imaging for Accurately Mapping Analytes across Heterogenous Biotissue. Anal. Chem. 2019, 91, 2838–2846. [Google Scholar] [CrossRef]

