Your browser does not fully support modern features. Please upgrade for a smoother experience.
Submitted Successfully!
 +1 credit
Thank you for your contribution! You can also upload a video entry or images related to this topic.
For video creation, please contact our Academic Video Service.
Video Upload Options
We provide professional Academic Video Service to translate complex research into visually appealing presentations. Would you like to try it?
Cite
If you have any further questions, please contact Encyclopedia Editorial Office.
Liu, G. Animal Diet Analysis. Encyclopedia. Available online: https://encyclopedia.pub/entry/16601 (accessed on 27 July 2026).
Liu G. Animal Diet Analysis. Encyclopedia. Available at: https://encyclopedia.pub/entry/16601. Accessed July 27, 2026.
Liu, Gang. "Animal Diet Analysis" Encyclopedia, https://encyclopedia.pub/entry/16601 (accessed July 27, 2026).
Liu, G. (2021, December 01). Animal Diet Analysis. In Encyclopedia. https://encyclopedia.pub/entry/16601
Liu, Gang. "Animal Diet Analysis." Encyclopedia. Web. 01 December, 2021.
Copy Citation
Diet analysis is a critical content of animal ecology and the diet analysis methods have been constantly improving and updating. Traditional diet analysis methods include direct observation of foraging behavior, the cafeteria diet, microscopic identification of prey remains in fecal and stomach contents. The molecular-based analysis of animal diets has recently become popular, as they confer high resolution and accuracy, which is mainly achieved through the cloning sequencing or the next generation sequencing (NGS) on the amplification of prey DNA in dietary samples.
next generation sequencing (NGS)
diet analysis
DNA metabarcoding
trophic link
1. Introduction to Diet Analysis
What an animal eats is perhaps the most ecologically important background information we can understand the species’ nutrition ecology [1][2], and diet analysis is one of the important contents of animal ecology [3][4]. It is the prerequisite for evaluating the host health, understanding the relationship between animal and environment, exploring predator-prey dynamics, uncovering trophic interactions, explaining behavioral plasticity and even faciliating pest management [5][6][7][8][9][10]. It also benefits constructing habitat selection and utilization models, determining foraging strategies and nutrient flows, assessing species’ survival status and ecosystem function, discovering the mechanistic processes behind complex food web dynamics and other hot issues [11][12]. How to accurately and precisely identify the diet compositions and proportions of different prey items remains a challenge before introducing molecular techniques. It is very important to have reliable dietary data before exploring biological and evolutionary questions involved with food intake [13].
Dietary intake is relatively very difficult to be measured reliably in humans because approaches of diet analysis typically rely on self-reporting, which can be incomplete and biased [14]. Traditional diet analysis methods include direct observation of foraging behavior, the cafeteria diet, microscopic identification of prey remains in fecal and stomach contents [15][16]. The operation of field behavior observation is poor and the results are qualitatively descriptive [15], and the cafeteria diet method is more suitable for studying animal diet preferences in captive environment [17]. The stomach contents analysis is a destructive approach and clearly less acceptable in mammalian studies [18]. Microscopic analysis has a high requirement on the microscopic identification technology and the work is labor intensive, and it has low resolution on diet items with similar micro-morphological tissues [19]. Both methods of plant alkane fingerprint and near-infrared reflectance spectroscopy are mainly used in the nutrient research of herbivores, but cannot determine the diet composition [20]. Stable isotope analysis has advantages in determining the structure of food webs and analyzing energy flows, however, it still is difficult to investigate the fine-scale diet patterns often sought in food web studies [21][22].
The molecular-based analysis of animal diets has recently become popular, as they confer high resolution and accuracy, which is mainly achieved through the cloning sequencing or the next generation sequencing (NGS) on the amplification of prey DNA in dietary samples [23][24]. Both approaches need to be combined with DNA metabarcoding using general or group-specific primers. The cloning approach has more obvious advantages than non-DNA based diet analysis methods, but has its own limitations, for example, sequencing more clones will greatly increase the workload and the cost, but the effect may not necessarily be improved [25][26][27]. With the development of NGS, this technology is gradually extended to diet analysis, and its unique advantages make relevant dietary studies emerge, covering mammals, birds, amphibians, fish and even invertebrates [28][29][30]. However, applying NGS into diet analysis has not been paid more attention as conservation genomics and ecological metagenomics, and it is still not as widely used as might be expected [31].
2. Conceptual Framework of Diet Analysis Using NGS
The overall framework of analyzing animals’ diet based on NGS is: Collect samples (faeces or gut contents) used for prey DNA extraction; Extract prey DNA in animal pellets and remains; Select the corresponding DNA barcodes with both high universality and high resolution; Construct reference databases from potential dietary species; Conduct PCR amplification on extracted DNA; Sequence the PCR products using NGS platforms; Blast NGS generated DNA sequences with the constructed DNA barcode database consisting of local potential food resources and/or the public database; Identify food taxa according to the sequence coverage and similarity (Figure 1).
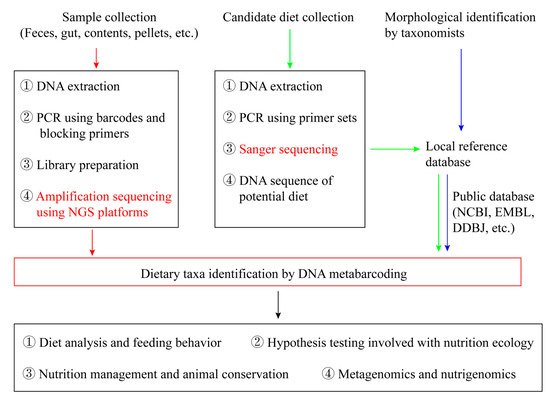
Figure 1. An overview of conceptual framework of diet analysis using next-generation sequencing (NGS).
2.1. Sample Collection and DNA Extraction
At present, the vast majority of dietary studies applying NGS use feces as the sample, because fecal samples contain the undigested feed materials, and are easily collected. However, stomach contents are applied for studying the diet of rodents, locust and fish [8][32][33]. In some avian studies, pellets are also used as complementary samples [30]. Non-invasive sampling of feces is particularly suitable for studying animals, especially when monitoring the diet for a long time. The freshness of feces is the key to determine the quality of fecal DNA, which can directly affect the performance of DNA extraction, PCR and sequencing. The quality of fecal DNA is also related to the sampling part of feces. Sampling and mixing the center, the middle and the out layer of feces can significantly improve the detection rate of prey DNA, especially for the rare item that animals consume less frequently [34][35][36].
The effects of sample preservation methods and DNA extraction methods on DNA quality have been well studied in conservation genetics [37], but its effect on diet analysis has rarely explored. In NGS diet analysis, common preservation methods include silica-gel drying (rodents [38]; brown bear [39]), buffer solution (lizard [40]), ethanol (bat [41]), freezing (bat [28]; lizard [40]; seal [42]; great bustard [43]), etc. There are also two-step preservation methods, such as ethanol and cryopreservation (bat [44]) and ethanol and silica-gel preservation (leopard cat [45]). Researchers also need to consider the feasibility of conservation methods and the convenience of transporting into consideration.
The DNA extraction method mostly adopts the more commonly commercial kit, and also some researchers select the tissue DNA kit according to the feeding habits difference of the targeted species [46]. Most studies use QIAamp DNA Stool Mini Kit, but there are exceptions. The inhibitex in QIAamp DNA Stool Mini Kit contains the potato adsorbent, which may be mixed in DNA extraction, and it may make potato appear in the diet [47]. MoBio, Epicentre, and Qiagen’s fecal DNA extraction kits have a poorer effect than CTAB extraction method in analyzing diet of Corvus corone [48], but it may depend on the predator. For some species, the extraction effectiveness of QIAamp DNA Stool Mini Kit is significantly lower than Zymo Soil/Fecal DNA MiniPrep Kit [49]. Therefore, it is crucial to optimize the key step of fecal DNA extraction, to efficiently yield trace amounts of prey DNA while simultaneously minimizing potential PCR inhibitors.
2.2. PCR Amplification and NGS Processing
The greatest advantage of applying NGS into diet analysis is that it can mix several PCR products, thus a large amount of data can be obtained in one NGS reaction. Multiple samples at a large scale can be analyzed in one NGS run, and as a consequence costs of diet analyses will diminish dramatically. To separate and identify samples after NGS sequencing, NGS uses incorporated tags in synthesized primers, and these tags often called MIDs can play a role to identify the individual sample [28][46]. The tagging process is completed while synthesizing the primer, which is respectively adding bases to the 5 ‘end of the forward primer and the reversed primer. The base number depends on the individual number of mixed samples, and the more samples are, the more base numbers are. But too much base numbers will affect PCR efficiency. Octamer are generally used, and the difference between octamers should be bigger than 5, which can meet the common requirement [50]. Adopting multiplex PCR can improve the efficiency of experiment, but PCR conditions need to be optimized. How to choose the DNA barcoding primers depends on the feeding habits of animals, and we summarize the frequently used primers in NGS dietary studies to facilitate the readers. In order to suppress amplification of DNA fragments derived from the predator, a predator-specific blocking oligonucleotide is designed when preparing libraries, which can effectively improve the sensitivity in rare prey detection [51][52]. However, blocking probes can potentially block other prey species, particularly if predators and preys are phylogenetically close [53].
2.3. Building a Local Reference Database
Sequences generated by the NGS platforms need to be blasted with the public and local database, and the prey species corresponding to the sequence in the database can be identified [54]. Because animals and plants vary due to geographical distributions, the public database (NCBI, EMBL, and DDBJ) just include part of DNA barcodes uploaded by local researchers, which may result into a low resolution taxa assignation [55]. In addition, there are various types of DNA barcodes, and the resolution is also different. Different DNA barcodes or DNA barcode combination can be selected according to the diet habit. But if the public database lacks of this kind of DNA barcode data, the classification accuracy of diet analysis will be reduced. This means that the local DNA barcodes database of all local potential diet resource, where animals potentially eat, should be collected and identified by both morphological and molecular methods.
The process of constructing local DNA barcode database is as follows: (1) Collecting the specimen potentially consumed by predators in the predator’s distribution, and morphologically determining the species with the assistance from the taxonomic experts; (2) Extracting the DNA and amplifying them in terms of each DNA metabarcoding marker. (3) Constructing the local reference database through Sanger sequencing. Taking analyzing diets of herbivores as an example, constructing a rbcL library can make the proportion of identification to species level reach to 72% [35]. However, if the local database is not constructed, the proportion of identification to species will be significantly reduced. For example, just 4–20% of sequences are able to be identified to species or genus level while blasting NGS data of bats [56]. The enormous DNA extracts obtained locally are therefore also considered as a resource, as new DNA barcoding regions can be amplified and sequenced based on the same DNA extracts. More importantly, the local DNA barcode database itself can be directly used in the assessment and monitoring of biodiversity [57].
2.4. Data Filtering and Analysis
When blasted with the established local reference database and the public database, taxon assignation of the prey can be achieved using the sequence similarity and a unique taxon will be assigned to a unique sequence, but the setting of threshold value is still controversial now. Some studies adopt the relaxed similarity threshold value to determine the taxonomic category of species, such as adopting 97% [33][44], or they may adopt more rigorous thresholds value, such as using 99% [56][58] and 100% [40]. Some researchers recommended that different threshold values should be used according to different DNA barcodes and the questions addressed [28]. For some studies that do not construct a local database, though they can adopt the clustering method to complete the differential analysis of diet composition through the Molecular operational taxonomic units (MOTU) in subsequent classification and difference analysis. Generally speaking, constructing the local database will help to improve the more accurate taxonomic assignation, with clear reference to what food resources are actually available in the habitat and ecologically meaningful to the predator [55]. For related species living in different habitats or biogeographical regions, they may share the same barcode sequence, and it may be identified to a higher taxonomic level (i.e., genus, family, phylum) when blasting a database constructed at the worldwide level.
NGS technologies have the ability to generate millions of sequence reads per sequencing run and as a consequence enormous sequence reads per sample [59]. However during this process, a variable number of erroneous sequences may originate from DNA degradation, contamination, PCR bias, primer dimers, sequencing errors, chimeras, etc. Ineffective controlling and filtering of such erroneous data can produce an overestimation of the number of molecular operational taxon units (MOTUs), and inaccurate diet assessments will interfere with the application. Generally, it is suggested to use internal controls, PCR replication and sequence distribution patterns across samples to objectively guide and choose the data filtering criteria and parameters in post-sequencing dietary data analysis.
References
- Raubenheimer, D.; Simpson, S.J. Nutritional ecology and foraging theory. Curr. Opin. Insect. Sci. 2018, 27, 38–45.
- Liu, G.; Shafer, A.B.A.; Hu, X.; Li, L.; Ning, Y.; Gong, M.; Cui, L.; Li, H.; Hu, D.; Qi, L.; et al. Meta-barcoding insights into the spatial and temporal dietary patterns of the threatened Asian Great Bustard (Otis tarda dybowskii) with potential implications for diverging migratory strategies. Ecol. Evol. 2018, 8, 1736–1745.
- Szoboszlai, A.I.; Thayer, J.A.; Wood, S.A.; Sydeman, W.J.; Koehn, L.E. Forage species in predator diets: Synthesis of data from the California Current. Ecol. Inform. 2015, 29, 45–56.
- Demi, L.M.; Taylor, B.W.; Reading, B.J.; TordoffR, M.G.; Dunn, R. Understanding the evolution of nutritive taste in animals: Insights from biological stoichiometry and nutritional geometry. Ecol. Evol. 2021, 11, 8441–8455.
- Carreon-Martinez, L.; Heath, D. Revolution in food web analysis and trophic ecology: Diet analysis by DNA and stable isotope analysis. Mol. Ecol. 2010, 19, 25–27.
- Sheppard, S.K.; Harwood, J.D. Advances in molecular ecology: Tracking trophic links through predator–prey food-webs. Funct. Ecol. 2005, 19, 751–762.
- Khanam, S.; Howitt, R.; Mushtaq, M.; Russell, C. Diet analysis of small mammal pests: A comparison of molecular and microhistological methods. Integr. Zool. 2016, 11, 98–110.
- Traugott, M.; Thalinger, B.; Wallinger, C.; Sint, D. Fish as predators and prey: DNA-based assessment of their role in food webs. J. Fish Biol. 2021, 98, 367–382.
- Leung, T.L.F.; Koprivnikar, J. Your infections are what you eat: How host ecology shapes the helminth parasite communities of lizards. J. Anim. Ecol. 2019, 88, 416–426.
- Han, C.S.; Dingemanse, N.J. You are what you eat: Diet shapes body composition, personality and behavioural stability. BMC Evol. Biol. 2017, 17, 8.
- Aryal, A.; Panthi, S.; Barraclough, R.K.; Bencini, R.; Adhikari, B.; Ji, W. Raubenheimer. Habitat selection and feeding ecology of dhole (Cuon alpinus) in the Himalayas. J. Mammal. 2015, 96, 47–53.
- Severud, W.J.; Windels, S.K.; Belant, J.L.; Bruggink, G. The role of forage availability on diet choice and body condition in American beavers (Castor canadensis). Mamm. Biol.—Z. Säugetierkunde 2013, 78, 87–93.
- Maixner, F. Molecular Reconstruction of the Diet in Human Stool Samples. mSystems 2019, 4, e00634-19.
- Reese, A.T.; Kartzinel, T.R.; Petrone, B.L.; Turnbaugh, P.J.; Pringle, R.M.; David, A. Using DNA Metabarcoding To Evaluate the Plant Component of Human Diets: A Proof of Concept. mSystems 2019, 4, e00458-19.
- Pierce, G.J.; Boyle, P.R. A review of methods for diet analysis in piscivorous marine mammals. Oceanogr. Mar. Biol. 1991, 29, 409–486.
- Figueiredo, A.M.; Valente, A.M.; Barros, T.; Carvalho, J.; Silva, D.A.M.; Fonseca, C.; Carvalho, L.M.; Torres, R.T. What does the wolf eat? Assessing the diet of the endangered Iberian wolf (Canis lupus signatus) in northeast Portugal. PLoS ONE 2020, 15, e0230433.
- Rothwell, N.J.; Stock, M.J. The cafeteria diet as a tool for studies of thermogenesis. J. Nutr. 1988, 118, 925–928.
- Amundsen, P.A.; Sánchez-Hernández, J. Feeding studies take guts—Critical review and recommendations of methods for stomach contents analysis in fish. J. Fish Biol. 2019, 95, 1364–1373.
- Westoby, M.; Rost, G.R.; Weis, J.A. Problems with Estimating Herbivore Diets by Microscopically Identifying Plant Fragments from Stomachs. J. Mammal. 1976, 57, 167–172.
- Bugalho, M.N.; Milne, J.A.; Mayes, R.W.; Rego, F.C. Plant-wax alkanes as seasonal markers of red deer dietary components. Can. J. Zool. 2005, 83, 465–473.
- Inger, R.; Bearhop, S. Applications of stable isotope analyses to avian ecology. Ibis 2008, 150, 447–461.
- Han, H.; Wei, W.; Hu, Y.; Nie, Y.; Ji, X.; Yan, L.; Zhang, Z.; Shi, X.; Zhu, L.; Luo, Y.; et al. Diet Evolution and Habitat Contraction of Giant Pandas via Stable Isotope Analysis. Curr. Biol. 2019, 29, 664–669.e2.
- Nelms, S.E.; Parry, H.E.; Bennett, K.A.; Galloway, T.S.; Godley, B.J.; Santillo, D.; Lindeque, P.K. What goes in, must come out: Combining scat-based molecular diet analysis and quantification of ingested microplastics in a marine top predator. Methods Ecol. Evol. 2019, 10, 1712–1722.
- O’Rourke, D.R.; Mangan, M.T.; Mangan, K.E.; Bokulich, N.A.; Foster, J.T. Lord of the Diptera (and Moths and a Spider): Molecular Diet Analyses and Foraging Ecology of Indiana Bats in Illinois. Front. Ecol. Evol. 2021, 9, 623655.
- Braley, M.; Goldsworthy, S.D.; Page, B.; Steer, M.; Austin, J.J. Assessing morphological and DNA-based diet analysis techniques in a generalist predator, the arrow squid Nototodarus gouldi. Mol. Ecol. Resour. 2010, 10, 466–474.
- Lin, X.Z.; Hu, S.M.; Liu, S.; Huang, H. Comparison between traditional sequencing and high-throughput sequencing on the dietary analysis of juvenile fish. Ying Yong Sheng Tai Xue Bao 2018, 29, 3093–3101.
- Gong, M.; Ning, Y.; Han, M.; Zhao, C.; Tian, J.; Li, L.; Xiao, H.; Liu, G. A comparison of next-generation sequencing with clone sequencing in the diet analysis of Asian great bustard. Conserv. Genet. Resour. 2019, 11, 15–17.
- Clare, E.L.; Symondson, W.O.; Broders, H.; Fabianek, F.; Fraser, E.E.; Mackenzie, A.; Boughen, A.; Hamilton, R.; Willis, C.K.; Martinez-Nuñez, F. The diet of Myotis lucifugus across Canada: Assessing foraging quality and diet variability. Mol. Ecol. 2014, 23, 3618–3632.
- Emami-Khoyi, A.; Hartley, D.A.; Paterson, A.M.; Boren, L.J.; Cruickshank, R.H.; Ross, J.G.; Murphy, E.C.; Else, T.A. Identifying prey items from New Zealand fur seal (Arctocephalus forsteri) faeces using massive parallel sequencing. Conserv. Genet. Resour. 2016, 8, 1–10.
- Oehm, J.; Thalinger, B.; Eisenkölbl, S.; Traugott, M. Diet analysis in piscivorous birds: What can the addition of molecular tools offer? Ecol. Evol. 2017, 7, 1984–1995.
- Alberdi, A.; Aizpurua, O.; Bohmann, K.; Gopalakrishnan, S.; Lynggaard, C.; Nielsen, M.; Gilbert, M.T. Promises and pitfalls of using high-throughput sequencing for diet analysis. Mol. Ecol. Resour. 2019, 19, 327–348.
- Mcclenaghan, B.; Gibson, J.F.; Shokralla, S.; Hajibabaei, M. Discrimination of grasshopper (Orthoptera: Acrididae) diet and niche overlap using next-generation sequencing of gut contents. Ecol. Evol. 2015, 5, 3046–3055.
- Waraniak, J.M.; Baker, E.A.; Scribner, K.T. Molecular diet analysis reveals predator-prey community dynamics and environmental factors affecting predation of larval lake sturgeon Acipenser fulvescens in a natural system. J. Fish 2018, 93, 616–629.
- Gosselin, E.N.; Lonsinger, R.C.; Waits, L.P. Comparing morphological and molecular diet analyses and fecal DNA sampling protocols for a terrestrial carnivore. Wildl. Soc. Bull. 2017, 41, 362–369.
- Erickson, D.L.; Reed, E.; Ramachandran, P.; Bourg, N.A.; Mcshea, W.J.; Ottesen, A. Reconstructing a herbivore’s diet using a novel rbcL DNA mini-barcode for plants. AoB Plants 2017, 9, plx015.
- Panteli, N.; Mastoraki, M.; Nikouli, E.; Lazarina, M.; Antonopoulou, E.; Kormas, K.A. Imprinting statistically sound conclusions for gut microbiota in comparative animal studies: A case study with diet and teleost fishes. Comp. Biochem. Physiol. Part D Genom. Proteom. 2020, 36, 100738.
- Liu, G.; Zang, S.; Li, L.; Hu, X.; Zhao, S.; Li, K.; Hu, D. Evaluation of fecal DNA preservation and extraction methods in Przewalski’s horse. Conserv. Genet. Resour. 2014, 6, 511–513.
- Lopes, C.M.; De Barba, M.; Boyer, F.; Mercier, C.; Da, S.F.; Heidtmann, L.M.; Galiano, D.; Kubiak, B.B.; Langone, P.; Garcias, F.M.; et al. DNA metabarcoding diet analysis for species with parapatric vs sympatric distribution: A case study on subterranean rodents. Heredity 2015, 114, 525–536.
- De Barba, M.; Miquel, C.; Boyer, F.; Mercier, C.; Rioux, D.; Coissac, E.; Taberlet, P. DNA metabarcoding multiplexing and validation of data accuracy for diet assessment: Application to omnivorous diet. Mol. Ecol. Resour. 2014, 14, 306–323.
- Kartzinel, T.R.; Pringle, R.M. Molecular detection of invertebrate prey in vertebrate diets: Trophic ecology of Caribbean island lizards. Mol. Ecol. Resour. 2015, 15, 903–914.
- Bohmann, K.; Monadjem, A.; Lehmkuhl, N.C.; Rasmussen, M.; Zeale, M.R.; Clare, E.; Jones, G.; Willerslev, E.; Gilbert, M.T. Molecular diet analysis of two african free-tailed bats (molossidae) using high throughput sequencing. PLoS ONE 2011, 6, e21441.
- Thomas, A.C.; Jarman, S.N.; Haman, K.H.; Trites, A.W.; Deagle, B.E. Improving accuracy of DNA diet estimates using food tissue control materials and an evaluation of proxies for digestion bias. Mol. Ecol. 2014, 23, 3706–3718.
- Liu, G.; Hu, X.; Shafer, A.B.A.; Gong, M.; Han, M.; Yu, C.; Zhou, J.; Bai, J.; Meng, D.; Yu, G.; et al. Genetic structure and population history of wintering Asian Great Bustard (Otis tarda dybowskii) in China: Implications for conservation. J. Ornithol. 2017, 158, 761–772.
- Vesterinen, E.J.; Ruokolainen, L.; Wahlberg, N.; Peña, C.; Roslin, T.; Laine, V.N.; Vasko, V.; Sääksjärvi, I.E.; Norrdahl, K.; Lilley, T. What you need is what you eat? Prey selection by the batMyotis daubentonii. Mol. Ecol. 2016, 25, 1581–1594.
- Shehzad, W.; Riaz, T.; Nawaz, M.A.; Miquel, C.; Poillot, C.; Shah, S.A.; Pompanon, F.; Coissac, E.; Taberlet, P. Carnivore diet analysis based on next-generation sequencing: Application to the leopard cat (Prionailurus bengalensis) in Pakistan. Mol. Ecol. 2012, 21, 1951–1965.
- Brown, D.S.; Ebenezer, K.L.; Symondson, W.O. Molecular analysis of the diets of snakes: Changes in prey exploitation during development of the rare smooth snake Coronella austriaca. Mol. Ecol. 2014, 23, 3734–3743.
- Valentini, A.; Pompanon, F.; Taberlet, P. DNA barcoding for ecologists. Trends Ecol. Evol. 2009, 24, 110–117.
- Oehm, J.; Juen, A.; Nagiller, K.; Neuhauser, S.; Traugott, M. Molecular scatology: How to improve prey DNA detection success in avian faeces? Mol. Ecol. Resour. 2011, 11, 620–628.
- Jedlicka, J.A.; Sharma, A.M.; Almeida, R.P.P. Molecular tools reveal diets of insectivorous birds from predator fecal matter. Conserv. Genet. Resour. 2013, 5, 879–885.
- Coissac, E. OligoTag: A program for designing sets of tags for next-generation sequencing of multiplexed samples. Data Prod. Anal. Popul. Genom. Methods Protoc. 2012, 888, 13–31.
- Kumari, P.; Dong, K.; Eo, K.Y.; Lee, W.S.; Kimura, J.; Yamamoto, N. DNA metabarcoding-based diet survey for the Eurasian otter (Lutra lutra): Development of a Eurasian otter-specific blocking oligonucleotide for 12S rRNA gene sequencing for vertebrates. PLoS ONE 2019, 14, e0226253.
- Vestheim, H.; Jarman, S.N. Blocking primers to enhance PCR amplification of rare sequences in mixed—A case study on prey DNA in Antarctic krill stomachs. Front. Zool. 2008, 5, 12.
- Piñol, J.; San Andrés, V.; Clare, E.; Mir, G.; Symondson, W. A pragmatic approach to the analysis of diets of generalist predators: The use of next-generation sequencing with no blocking probes. Mol. Ecol. Resour. 2014, 14, 18–26.
- Soininen, E.M.; Valentini, A.; Coissac, E.; Miquel, C.; Gielly, L.; Brochmann, C.; Brysting, A.K.; Sønstebø, J.H.; Ims, A.R.; Yoccoz, N.G.; et al. Analysing diet of small herbivores: The efficiency of DNA barcoding coupled with high-throughput pyrosequencing for deciphering the composition of complex plant mixtures. Front. Zool. 2009, 6, 16.
- Pompanon, F.; Deagle, B.; Symondson, W.O.C.; Brown, D.S.; Jarman, S.; Taberlet, P. Who is eating what: Diet assessment using next generation sequencing. Mol. Ecol. 2011, 21, 1931–1950.
- Burgar, J.M.; Murray, D.C.; Craig, M.D.; Haile, J.; Houston, J.; Stokes, V.; Bunce, M. Who’s for dinner? High-throughput sequencing reveals bat dietary differentiation in a biodiversity hotspot where prey taxonomy is largely undescribed. Mol. Ecol. 2014, 23, 3605–3617.
- Lahaye, R.; Bank, M.V.D.; Bogarin, D.; Warner, J.; Pupulin, F.; Gigot, G.; Maurin, O.; Duthoit, S.; Barraclough, T.G.; Savolainen, V. From the Cover: DNA barcoding the floras of biodiversity hotspots. Proc. Natl. Acad. Sci. USA 2008, 105, 2923–2928.
- Krüger, F.; Clare, E.L.; Symondson, W.O.C.; Keišs, O.; Pētersons, G. Diet of the insectivorous bat Pipistrellus nathusii during autumn migration and summer residence. Mol. Ecol. 2014, 23, 3672–3683.
- Leray, M.; Yang, J.Y.; Meyer, C.; Mills, S.C.; Agudelo, N.; Ranwez, V.; Boehm, J.T.; Machida, R.J. A new versatile primer set targeting a short fragment of the mitochondrial COI region for metabarcoding metazoan diversity: Application for characterizing coral reef fish gut contents. Front Zool. 2013, 10, 34.
More
Information
Subjects:
Ecology; Evolutionary Biology; Ornithology
Contributor
MDPI registered users' name will be linked to their SciProfiles pages. To register with us, please refer to https://encyclopedia.pub/register
:
View Times:
3.1K
Revisions:
2 times
(View History)
Update Date:
01 Dec 2021
Table of Contents


Notice
You are not a member of the advisory board for this topic. If you want to update advisory board member profile, please contact office@encyclopedia.pub.
OK
Confirm
Only members of the Encyclopedia advisory board for this topic are allowed to note entries. Would you like to become an advisory board member of the Encyclopedia?
Yes
No
${ textCharacter }/${ maxCharacter }
Submit
Cancel
Back
Comments
${ item }
|
${ item.createdUser.fullName }
${ item.createdAt }
${ item.vote }
${ item.reply }
Delete
${ reply.createdUser.fullName }
${ reply.createdAt }
${ reply.vote }
Delete
There is no reply to this comment~
${ item.replyTextCharacter }/${ item.replyMaxCharacter }
Submit
Cancel
More
No more~
There is no comment~
${ textCharacter }/${ maxCharacter }
Submit
Cancel
${ selectedItem.replyTextCharacter }/${ selectedItem.replyMaxCharacter }
Submit
Cancel
Confirm
Are you sure to Delete?
Yes
No