Your browser does not fully support modern features. Please upgrade for a smoother experience.
Submitted Successfully!
 +1 credit
Thank you for your contribution! You can also upload a video entry or images related to this topic.
For video creation, please contact our Academic Video Service.
| Version | Summary | Created by | Modification | Content Size | Created at | Operation |
|---|---|---|---|---|---|---|
| 1 | David Ariza-Mateos | + 2369 word(s) | 2369 | 2021-11-18 04:12:33 | | | |
| 2 | Rita Xu | -486 word(s) | 1883 | 2021-11-30 08:50:07 | | |
Video Upload Options
We provide professional Academic Video Service to translate complex research into visually appealing presentations. Would you like to try it?
Cite
If you have any further questions, please contact Encyclopedia Editorial Office.
Ariza-Mateos, D. Deforestation and Biomass Production in Miombo Forest. Encyclopedia. Available online: https://encyclopedia.pub/entry/16545 (accessed on 25 July 2026).
Ariza-Mateos D. Deforestation and Biomass Production in Miombo Forest. Encyclopedia. Available at: https://encyclopedia.pub/entry/16545. Accessed July 25, 2026.
Ariza-Mateos, David. "Deforestation and Biomass Production in Miombo Forest" Encyclopedia, https://encyclopedia.pub/entry/16545 (accessed July 25, 2026).
Ariza-Mateos, D. (2021, November 30). Deforestation and Biomass Production in Miombo Forest. In Encyclopedia. https://encyclopedia.pub/entry/16545
Ariza-Mateos, David. "Deforestation and Biomass Production in Miombo Forest." Encyclopedia. Web. 30 November, 2021.
Copy Citation
Miombo is one of the most widely distributed ecosystems in Angola, with a great social and environmental value. Thus, the rural population uses the biomass as fuel and miombo provides important ecosystem services, such as its carbon sequestration capacity.
miombo
deforestation
charcoal
biomass
1. Introduction
Miombo is one of the most important forest ecosystems in southern Africa, covering large areas of Angola, Mozambique, Tanzania, Zimbabwe, Zambia, and the Democratic Republic of Congo, covering between 2.5 to 3.6 million km2 [1]. This ecosystem includes mosaics of dry forests and wooded savannahs, with a high diversity of flora and fauna [2], with medium productivity and high social value in terms of woody fuel, building materials, pasture, food, and medicinal plants [3]. Miombo usually has a multistrata structure: an upper stratum with adult trees between 15 and 18 m tall and a density around 65 trees ha−1; an intermediate stratum with trees between 8 and 12 m tall and a density of 80 trees ha−1; and the lower stratum with saplings, shrubs, and grassland with a height lower than 8 m and a density range between 375 and 500 trees ha−1 [4][5]. The volume varies between 14 and 59 m3 ha−1 in dry Miombo and between 41 and 100 m3 ha−1 in wet Miombo [4], with higher productivity in wet Miombo forests [6].
More than 55% of Angola’s land area is forested, amounting to about 69 Mha, of which 58.6 Mha is Miombo lands, 3.6 Mha correspond to other native forest and plantation forest, and 2.1 Mha of other lands with scattered trees [7][8]. Angolan Miombo is characterized by species of the genus Brachystegia, Julbernardia, and Isoberlinia, [9]. This ecosystem provides many ecosystem services to the rural population, including timber and nontimber products biomass for household energy production (firewood and charcoal), fodder for livestock, medicinal plants, and wild fruits. Water cycle regulation, the reduction of erosion, and the diversity of habitats favoring a high biodiversity are also important ecosystem services of Miombo lands [9]. Estimated data confirm that Miombo forest in Angola has an annual harvest capacity of 326,000 m3 and an average annual commercial timber productivity of 0.3 m3 ha−1 year−1 [7]. In addition, Miombo forests play an important role in atmospheric CO2 sequestration with fixation rates of up to 39.6 MgC ha−1 in above-ground biomass [10]. Thus, under sustainable management criteria, the Miombo could be an important source of economic income and employment, especially in rural areas. However, at present, this ecosystem is under great pressure from the local population, which puts its sustainability at risk, mainly due to some specific deforestation drivers.
In general, there is a differentiation between proximate causes (or drivers) and driving forces (or indirect drivers). Proximate causes are human activities that have a direct influence on the deforestation while driving forces are complex interactions of key social, economic, political, cultural, and technological processes [11]. Several works have assessed deforestation drivers as a tool for decision-making to reduce emissions from deforestation [12]. The main drivers identified in tropical forests are the agriculture expansion [13], urban expansion, infrastructural development, mining activity, and commercial timber exploitation or as fuel (firewood and charcoal), grazing, and forest fires [14].
Studies carried out in sub-Saharan Africa have concluded that the subsistence agriculture is the main driver in the poorest rural populations, often associated with deforestation for charcoal production and/or forest fires [15][16]. Thus, some authors link deforestation to food security, with the most frequent causes being agriculture [17] and exploitation of biomass as fuel [18]. In Angola, the main proximate drivers are the overextraction of timber resources, clearing for agricultural purposes, unregulated burning, and overgrazing [19]. This has led to an increase in deforestation rate from 0.2% in 2000 to 0.8% in the period 2000–2019 [7], compromising the current and future ecosystem services of the Miombo.
Charcoal production is a very important activity in Miombo and is increasingly becoming a lucrative business. Charcoal production in rural areas causes large environmental impact, especially in comparison with that generated by fuelwood, mainly in periurban areas [7]. This activity, which is continuously growing in Africa, is one of the main causes of deforestation and forest degradation both in Africa and Angola [18][20]. One of the main problems related to charcoal production in the Angolan Miombo is the lack of data about the potential productive capacity of this ecosystem. This leads to a lack of tools for assessing admissible annual cut values and, thus, for sustainable management. Some of the tools often used for assessing productive capacity, such as dendrochronology, have not often been used in such studies in tropical forests due to the great diversity of species and the difficulty in assessing annual growth [21]. Previous works have assessed annual growth in Miombo species to determine the annual allowable cutting volume [22]. Therefore, study of the productivity of the Miombo ecosystem is an important tool to increase knowledge about the charcoal production capacity and the annual allowable cutting volume, including the variables in forest management plans to increase the sustainability of this activity.
2. Study Sites
The study site is located in Huambo province (Angola), which covers an area of 34,270 km2 on the Central Plateau (Figure 1). Huambo is the province with the second-highest stock of biomass in Angola [23]; however, it is one of three provinces with the highest loss of forest cover in the country [24] and has the fifth-highest emissions [25]. In this case, it is not only the number of trees removed that threatens the stability of Miombo forests, but also the deforestation patterns associated with the demand for charcoal and firewood production for cooking and heating [20].
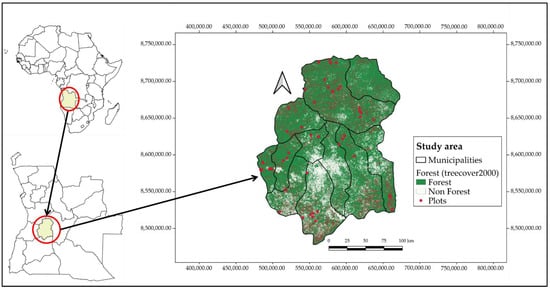
Figure 1. Distribution of miombo plots in the Huambo province (Angola). Forest area corresponds to the year 2000.
The climate—according to the Thornthwaite classification—is characterized as humid mesotherm, with cold and dry winters from May to September and hot and rainy summers from October to April [26]. The climatology is conditioned by a high altitude (more than 95% of its surface above 1500 m) with an average temperature of 20 °C, maximum temperatures of 25–27 °C, and minimum of 11–13 °C, precipitation of 1366 mm, and relative humidity that varies between 60 and 70% in January and 35 and 70% in August [26]. The predominant soils are of the ferralitic type. According to the Angolan Phytogeographic Chart [27], the province of Huambo is dominated by savanna-type Miombo forests with a high presence of Julbernardia and Brachystegia species with patches of low-density miombo on mesoplanaltic slopes (between the valleys of the Keve and Kwanza rivers) and high-elevation meadows (anharas) on ferralitic and thin soils.
3. Deforestation
The forest area in Huambo province in 2000 was 2,770,205 ha, of which 359,130 ha (12.96%) were deforested during the period 2000–2019 (Figure 2). The highest levels of deforestation occurred in the municipalities of Caála (20.67%), Bailundo (15.17%), and Longonjo (13.16%); the lowest levels occurred in the municipalities of Huambo and Ecunha, with 8.02% and 8.68% of deforested area, respectively (Table 1).
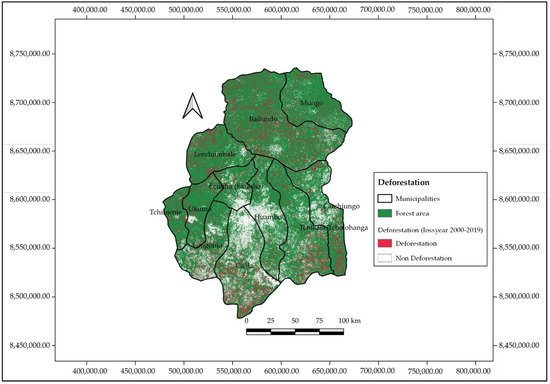
Figure 2. Deforestation in Huambo province. Forest area in 2000 (treecover2000); deforested area and non-deforested area from 2000 to 2019.
Table 1. Deforestation in Huambo province. Forest area in 2000 (ha); deforested area from 2000 to 2019 expressed in ha and as a percentage.
| Municipality | Forest Area 2000 (ha) | Deforestation (ha) | Deforestation (%) |
|---|---|---|---|
| Bailundo | 662,026 | 100,449 | 15.17 |
| Caála | 270,146 | 55,826 | 20.67 |
| Cathiungo | 225,175 | 26,568 | 11.80 |
| Ecunha | 113,311 | 9837 | 8.68 |
| Huambo | 205,780 | 16,511 | 8.02 |
| Londuimbali | 241,025 | 30,931 | 12.83 |
| Longonjo | 177,232 | 23,325 | 13.16 |
| Mungo | 280,719 | 25,533 | 9.10 |
| Tchikala | 358,482 | 44,211 | 12.33 |
| Tchinjenje | 82,765 | 10,788 | 13.03 |
| Ukuma | 153,543 | 15,151 | 9.87 |
| Total | 2,770,205 | 359,130 | 12.96 |
4. Composition and Structure
Forty tree species were found in the study area, of which 36 were identified by their scientific name and 33 by their local name. Two species were not identified by either their local name or scientific name, although they were perfectly discriminated from the rest, so they were identified as independent species. The species with the highest frequencies were Albizia anthunesiana (12.94%), Brachystegia spiciformis (12.28%), Julbernardia paniculata (8.44%), Monote spp. (8.42%), Brachystegia boemii (7.85%), Isoberlinea angolensis (5.88%), Anisophyllea boehmii (5.86%), Syzygium guineense (4.84%), and Erythrophleum africanum (4.50%). The average density of adult trees was 3616.38 trees ha−1. Caála and Tchicala have the highest densities (4747.35 trees ha−1 and 4313.09 trees ha−1, respectively) and Ukuma and Bailundo have the lowest densities (3151.26 trees ha−1 and 3226.16 trees ha−1, respectively).
5. Accumulated Carbon and CO2 Equivalent
Total biomass was 195.05 Mg ha−1 (55.02 Mg ha−1 below-ground biomass and 140.04 Mg ha−1 above-ground biomass (Table 2)). The highest biomass values were found in Ukuma and Bailundo (289.85 Mg ha−1 and 218.18 Mg ha−1, respectively), and the lowest in Tchicala and Longonjo (113.03 Mg ha−1 and 157.69 Mg ha−1, respectively) (Table 3).
Table 2. Biomass, accumulated Carbon, and CO2 equivalent in the Miombo of Huambo province expressed in Mg ha−1.
| Variable | Above-Ground | Below-Ground | Total |
|---|---|---|---|
| Biomass 1 | 140.04 ± 108.59 (24.68–716.41) |
55.02 ± 31.69 (14.68–209.55) |
195.05 ± 140.14 (39.36–925.96) |
| Accumulated Carbon 2 | 65.82 (11.60–336.71) |
25.86 ± 14.89 (6.90–98.48) |
91.67 (18.50–435.20) |
| CO2 equivalent 3 | 241.32 (42.53–1234.61) |
94.81 (25.30–361.12) |
336.13 (67.84–1595.74) |
1 Total biomass, above-ground biomass, and below-ground biomass expressed in Mg ha−1. 2 Total accumulated Carbon, above-ground Carbon, and Below-ground Carbon expressed in Mg ha−1. 3 Total CO2 eq., above-ground CO2 eq., and below-ground CO2 eq. expressed in Mg ha−1. For each variable, the mean value and standard deviation of all plots of Huambo province are included; further, maximum and minimum values found in plots are included.
Table 3. Biomass, volume, accumulated Carbon, and CO2 equivalent by municipality. Mean values expressed in Mg ha−1 and standard deviation are presented in the table.
| Municipality | Total Biomass 1 | Volume 2 | Accumulated C 3 | CO2eq 4 |
|---|---|---|---|---|
| Bailundo | 218.18 ± 214.35 | 79.09 ± 36.01 | 102.55 ± 100.75 | 376.00 ± 369.40 |
| Caála | 177.10 ± 75.42 | 92.39 ± 46.73 | 83.24 ± 35.45 | 305.21 ± 129.98 |
| Ekunha | 212.01 ± 49.72 | 72.86 ± 27.16 | 99.65 ± 23.37 | 365.37 ± 85.68 |
| Katchiungo | 178.48 ± 46.66 | 83.87 ± 5.49 | 83.88 ± 21.93 | 307.58 ± 80.42 |
| Londuimbale | 181.23 ± 42.11 | 70.88 ± 12.14 | 85.18 ± 19.79 | 312.32 ± 72.57 |
| Longonjo | 157.69 ± 55.75 | 77.24 ± 17.73 | 74.11 ± 26.20 | 271.75 ± 96.08 |
| Tchicala | 113.03 ± 58.74 | 56.44 ± 23.15 | 53.12 ± 27.61 | 194.79 ± 101.23 |
| Tchingenje | 184.29 ± 112.72 | 70.62 ± 26.28 | 86.62 ± 52.98 | 317.59 ± 194.26 |
| Ukuma | 289.85 ± 6.74 | 96.71 ± 10.48 | 136.23 ± 3.17 | 499.51 ± 11.62 |
1 Total biomass, expressed in Mg ha−1. 2 Wood volume, expressed in m3 ha−1. 3 Total accumulated Carbon, expressed in Mg ha−1. 4 Total CO2 eq., expressed in Mg ha−1. For each variable, the mean value and standard deviation by municipality are included.
The mean wood volume in the Miombo forest was 78.57 m3 ha−1, with the highest values in Ukuma and Caála (96.71 m3 ha−1 and 92.39 m3 ha−1, respectively) and the lowest in Tchingenje and Loundimbale (70.62 m3 ha−1 and 70.88 m3 ha−1, respectively) (Table 3).
The above-ground accumulated C was 65.82 Mg ha−1 and the below-ground accumulated C was 25.86 Mg ha−1; total accumulated C was 91.67 Mg ha−1 (Table 2). The highest values were found in Ukuma and Bailundo (136.23 Mg ha−1 and 102.55 Mg ha−1, respectively) and the lowest values in Tchicala and Longonjo (53.12 Mg ha−1 and 74.11 Mg ha−1, respectively) (Table 3). These values correspond to a CO2 equivalent of 336.13 Mg ha−1 (94.81 Mg ha−1 of above-ground CO2eq and 241.32 Mg ha−1 of below-ground CO2eq) (Table 2). The highest values were found in Ukuma and Bailundo (499.51 Mg ha−1 and 376.00 Mg ha−1, respectively) and the lowest values in Tchicala and Longonjo (194.79 Mg ha−1 and 271.75 Mg ha−1, respectively) (Table 3).
6. Productive Capacity
6.1. Potential Charcoal Productivity (PCP)
The PCP was 15,359.9 kg ha−1, although the variability between municipalities was very high, ranging from 11,034.87 Kg ha−1 for (Tchicala) to 18,907.60 Kg ha−1 for (Ukuma) (Table 4).
Table 4. Potential Charcoal Productivity (PCP) and Allowable Cutting Value (ACV) by municipality. Mean values and standard deviation of PCP expressed in Kg ha−1 are included. Mean values and standard deviations of ACV expressed in number of trees ha−1 are included.
| Municipality | 1 PCP (Kg ha−1) | 2 ACV (N. Trees ha−1) |
|---|---|---|
| Bailundo | 15,461.62 ± 7040.92 | 23.06 ± 5.41 |
| Caála | 18,061.42 ± 9136.63 | 31.57 ± 21.69 |
| Ekunha | 14,245.06 ± 5310.49 | 25.50 ± 3.54 |
| Kacthiungo | 16,395.84 ± 1073.17 | 24.75 ± 4.79 |
| Londuimbale | 13,857.53 ± 2373.48 | 22.00 ± 1.00 |
| Longonjo | 15,100.04 ± 3465.85 | 25.00 ± 4.24 |
| Tchicala | 11,034.87 ± 4525.17 | 27.50 ± 11.12 |
| Tchingenje | 13.806.39 ± 5136.87 | 22.43 ± 5.91 |
| Ukuma | 18,907.60 ± 2048.33 | 22.67 ± 4.51 |
1 Mean values and standard deviations of PCP expressed in Kg ha−1. 2 Mean values and standard deviation of ACV expressed in number of trees ha−1.
6.2. Allowable Cutting Value (ACV)
The ACV was 24.78 trees ha−1, with the lowest values in Londuimbale (22 trees ha−1) and the highest values in Caála (31.57 trees ha−1) (Table 4).
When comparing the biomass carbon storage with the potential charcoal productivity, there is a correlation at the extreme values (Tchicala and Ukuma) despite the correlation coefficient not being very high (0.5).
6.3. Annual Allowable Cutting (AAC)
For a rotation period of 55 years, the ACV was 14.31 ± 5,61 trees ha−1 year−1, increasing for shorter periods (40 years, 19.68 ± 7.72 trees ha−1 year−1; 25 years, 31.5 ± 12.35 trees ha−1 year−1; 15 years, 52.5 ± 20.58 trees ha−1 year−1).
6.4. Annual Allowable Cutting Volume (AACV)
Values of AAC corresponding to values of AACV of 10.77 ± 6.05 m3 ha−1 year−1, 14.13 ± 7.96 m3 ha−1 year−1, 21.17 ± 11.93 m3 ha−1 year−1, and 32.85 ± 18.51 m3 ha−1 year−1 (55, 40, 25, and 15 years, respectively).
6.5. Potential Annual Allowable Charcoal Productivity (PAACP)
The PAACP were 2107.08 ± 1183.53 kg ha−1 year−1, 2762.96 ± 1557.41 kg ha−1 year−1, 4139.21 ± 2333.17 kg ha−1 year−1, and 6422.56 ± 3620.24 kg ha−1 year−1 for the rotation lengths considered (55, 40, 25, and 15, respectively).
References
- Ribeiro, N.S.; Syampungani, S.; Matakala, N.; Nangoma, D.; Barros, A. Miombo Woodlands Research towards the Sustainable Use of Ecosystem Services in Southern Africa. In Biodiversity in Ecosystems-Linking Structure and Function; Yueh-Hsin, L., Blanco, J., Shovonlal, J., Eds.; InTech: Rijeka, Croatia, 2015; pp. 475–491.
- Ryan, C.; Williams, M.; Grace, J. Above and Belowground Carbon Stocks in a Miombo Woodland Landscape of Mozambique. Biotropica 2011, 43, 423–432.
- Sanfilippo, M. Trinta árvores e arbustos do miombo angolano. In Guia de Campo Para a Identificação; COSPE: Kwanza Sul, Angola, 2013; p. 76.
- Frost, P. The ecology of Miombo woodlands. In The Miombo in Transition: Woodlands and Welfare in Africa; Campbell, B., Ed.; Center for International Forestry Research (CIFOR): Bongor, Indonesia, 1996; pp. 11–55.
- Abdallah, J.M.; Monela, G.G. Overview of Miombo Woodlands in Tanzania. Working Papers of the Finnish Forest Research Institute 2007. Available online: https://www.researchgate.net/publication/255586366_Overview_of_Miombo_Woodlands_in_Tanzania (accessed on 25 June 2017).
- Marzoli, A. Inventário florestal nacional. In Avaliação Florestal Integrada de Moçambique; Ministério da Agricultura: Maputo, Mozambique, 2007; p. 82.
- FAO. Global Forest Resources Assessment Main Report; FAO: Roma, Italia, 2020.
- Chiteculo, V.; Surovy, P. Dynamic patterns of trees species in miombo forest and management perspectives for sustainable production—case study in Huambo Province, Angola. Forests 2018, 9, 321.
- Sanfilippo, M. Inventário Florestal da Área Comunitária de Canjombe, Município da Cela; COSPE: Kwanza Sul, Angola, 2014; p. 64.
- Kalaba, F.K.; Quinn, C.; Dougill, A.J.; Vinya, R. Floristic composition, species diversity and carbon storage in charcoal and agriculture fallows and management implications in miombo woodlands of Zambia. Ecol. Manag. 2013, 304, 99–109.
- Chowdhury, R.R. Driving forces of tropical deforestation: The role of remote sensing and spatial models. Singap. J. Trop. Geogr. 2006, 27, 82–101.
- Hosonuma, N.; Herold, M.; De Sy, V.; De Fries, R.S.; Brockhaus, M.; Verchot, L.; Romijn, E. An assessment of deforestation and forest degradation drivers in developing countries. Environ. Res. Lett. 2012, 7, 044009.
- Carr, D.L. Proximate population factors and deforestation in tropical agricultural frontiers. Popul. Environ. 2004, 25, 585–612.
- Jayathilake, H.M.; Prescott, G.W.; Carrasco, L.R. Drivers of deforestation and degradation for 28 tropical conservation landscapes. Ambio 2020, 7, 13259.
- Rudel, T.K.; Rudel, T.K. The national determinants of deforestation in sub-Saharan Africa. Philos. Trans. R. Soc. B-Biol Sci. 2013, 368, 20120405.
- Bowers, S.; Ryan, C.; Jones, H. Understanding agricultural drivers of deforestation through remote sensing: Opportunities and limitations in sub-Saharan Africa. In IIED Working Paper; IIED: London, UK, 2017.
- Ordway, E.M.; Asner, G.P.; Lambin, E.F. Deforestation risk due to commodity crop expansion in sub-Saharan Africa. Environ. Res. Lett. 2017, 12, 044015.
- Bamwesigye, D.; Hlavackova, P.; Darkwah, S.A.; Verter, N. Deforestation, Climate Change and Food Security Nexus in Sub-Sahara Africa: Content Analysis; MDPI: Basel, Switzerland, 2019.
- Chiteculo, V.; Abdollahnejad, A.; Panagiotidis, D.; Surový, P.; Sharma, R.P. Defining deforestation patterns using satellite images from 2000 and 2017: Assessment of forest management in miombo forests-A case study of Huambo Province in Angola. Sustainability 2019, 11, 98.
- Chiteculo, V.; Lojka, B.; Surový, P.; Verner, V.; Panagiotidis, D.; Woitsch, J. Value Chain of Charcoal Production and Implications for Forest Degradation: Case Study of Bié Province, Angola. Environments 2018, 5, 113.
- Munalula, F.; Seifert, T.; Meincken, M. Inter-annual growth response of three Miombo tree species to climatic effects. South. For. J. For. Sci. 2020, 82, 135–147.
- Syampungani, S.; Chirwa, P.W.; Akinnifesi, F.K.; Sileshi, G.; Ajayi, O.C. The miombo woodlands at the cross roads: Potential threats, sustainable livelihoods, policy gaps and challenges. Nat. Resour. Forum 2010, 33, 150–159.
- Inventário Florestal Nacional. IDF-Instituto de Desenvolvimento Florestal; Inventário Florestal Nacional: Luanda, Angola, 2018.
- Mendelsohn, J.M. Landscape changes in Angola. In Biodiversity of Angola. Science & Conservation: A Modern Synthesis; Huntley, B.J., Russo, V., Lages, F., Ferrand, N., Eds.; Springer: Berlin/Heidelberg, Germany, 2009.
- Ariza, D.; Moyano, A.; De la Higuera, M.; Lara, M.A.; Palacios, G. Linha de Base de Emissões de Gases de Efeito Estufa Para Floresta, Mudança do Uso da Terra e Carvão Vegetal para Angola; MCTA: Luanda, Angola, 2020.
- Cabral, A.I.R.; Vasconcelos, M.J.; Ooma, D.; Sardinha, R. Spatial dynamics and quantification of deforestation in the central-plateau woodlands of Angola (1990–2009). Appl. Geogr. 2011, 11, 1185–1193.
- Barbosa, L. Carta Fitogeográfica de Angola; Instituto de Investigação Científica de Angola: Luanda, Angola, 2009; p. 242.
More
Information
Subjects:
Environmental Sciences
Contributor
MDPI registered users' name will be linked to their SciProfiles pages. To register with us, please refer to https://encyclopedia.pub/register
:
View Times:
1.0K
Revisions:
2 times
(View History)
Update Date:
30 Nov 2021
Table of Contents


Notice
You are not a member of the advisory board for this topic. If you want to update advisory board member profile, please contact office@encyclopedia.pub.
OK
Confirm
Only members of the Encyclopedia advisory board for this topic are allowed to note entries. Would you like to become an advisory board member of the Encyclopedia?
Yes
No
${ textCharacter }/${ maxCharacter }
Submit
Cancel
Back
Comments
${ item }
|
${ item.createdUser.fullName }
${ item.createdAt }
${ item.vote }
${ item.reply }
Delete
${ reply.createdUser.fullName }
${ reply.createdAt }
${ reply.vote }
Delete
There is no reply to this comment~
${ item.replyTextCharacter }/${ item.replyMaxCharacter }
Submit
Cancel
More
No more~
There is no comment~
${ textCharacter }/${ maxCharacter }
Submit
Cancel
${ selectedItem.replyTextCharacter }/${ selectedItem.replyMaxCharacter }
Submit
Cancel
Confirm
Are you sure to Delete?
Yes
No