Miombo is one of the most widely distributed ecosystems in Angola, with a great social and environmental value. Thus, the rural population uses the biomass as fuel and miombo provides important ecosystem services, such as its carbon sequestration capacity. The objectives of this work were (i) to assess deforestation in miombo forest in Huambo province (Angola) during the last 20 years, (ii) to evaluate carbon storage capacity of miombo, and (iii) to calculate the charcoal productive capacity of those forests. From 2000 to 2019, 359,130 ha (12.96%) were deforested in Huambo province. Thirty-six woody species were identified as major components of miombo forest, the most frequent being Albizia anthunesiana, Brachystegia spiciformis, Julbernardia paniculata, Monote spp., Brachystegia boemii, Isoberlinea angolensis, Anisophyllea boehmii, Syzygium guineense, and Erythrophleum africanum. The total biomass estimated in miombo forest was 195.05 Mg ha−1 (55.02 Mg ha−1 radical and 140.04 Mg ha−1 area), with a total wood volume of 78.57 m3 ha−1. This represents values of 91.67 Mg ha−1 of accumulated carbon and 336.13 Mg ha−1 of CO2 equivalent. The potential charcoal productivity was 15,359.9 kg ha−1, corresponding to 24.78 trees ha−1. The Annual Allowable Cutting Volume was 10.77 m3 ha−1 year−1, 14.13 m3 ha−1 year−1, 21.17 m3 ha−1, and 32.85 m3 ha−1 year−1 for rotation lengths of 55, 40, 25, and 15 years, respectively, corresponding to a potential annual charcoal productivity of 2107.08 Kg ha−1 year−1, 2762.96 Kg ha−1 year−1, 4139.21 Kg ha−1, and 422.56 Kg ha−1 year−1. However, deforestation rates in the last 19 years and low charcoal productive capacity could compromise the sustainability of the Miombo ecosystem and its value as an ecosystem service provider in the province if appropriate management strategies are not developed.
- miombo
- deforestation
- charcoal
- biomass
1. Introduction
Miombo is one of the most important forest ecosystems in southern Africa, covering large areas of Angola, Mozambique, Tanzania, Zimbabwe, Zambia, and the Democratic Republic of Congo, covering between 2.5 to 3.6 million km2 [1]. This ecosystem includes mosaics of dry forests and wooded savannahs, with a high diversity of flora and fauna [2], with medium productivity and high social value in terms of woody fuel, building materials, pasture, food, and medicinal plants [3]. Miombo usually has a multistrata structure: an upper stratum with adult trees between 15 and 18 m tall and a density around 65 trees ha−1; an intermediate stratum with trees between 8 and 12 m tall and a density of 80 trees ha−1; and the lower stratum with saplings, shrubs, and grassland with a height lower than 8 m and a density range between 375 and 500 trees ha−1 [4,5]. The volume varies between 14 and 59 m3 ha−1 in dry Miombo and between 41 and 100 m3 ha−1 in wet Miombo [4], with higher productivity in wet Miombo forests [6].
More than 55% of Angola’s land area is forested, amounting to about 69 Mha, of which 58.6 Mha is Miombo lands, 3.6 Mha correspond to other native forest and plantation forest, and 2.1 Mha of other lands with scattered trees [7,8]. Angolan Miombo is characterized by species of the genus Brachystegia, Julbernardia, and Isoberlinia, [9]. This ecosystem provides many ecosystem services to the rural population, including timber and nontimber products biomass for household energy production (firewood and charcoal), fodder for livestock, medicinal plants, and wild fruits. Water cycle regulation, the reduction of erosion, and the diversity of habitats favoring a high biodiversity are also important ecosystem services of Miombo lands [9]. Estimated data confirm that Miombo forest in Angola has an annual harvest capacity of 326,000 m3 and an average annual commercial timber productivity of 0.3 m3 ha−1 year−1 [7]. In addition, Miombo forests play an important role in atmospheric CO2 sequestration with fixation rates of up to 39.6 MgC ha−1 in above-ground biomass [10]. Thus, under sustainable management criteria, the Miombo could be an important source of economic income and employment, especially in rural areas. However, at present, this ecosystem is under great pressure from the local population, which puts its sustainability at risk, mainly due to some specific deforestation drivers.
In general, there is a differentiation between proximate causes (or drivers) and driving forces (or indirect drivers). Proximate causes are human activities that have a direct influence on the deforestation while driving forces are complex interactions of key social, economic, political, cultural, and technological processes [11]. Several works have assessed deforestation drivers as a tool for decision-making to reduce emissions from deforestation [12]. The main drivers identified in tropical forests are the agriculture expansion [13], urban expansion, infrastructural development, mining activity, and commercial timber exploitation or as fuel (firewood and charcoal), grazing, and forest fires [14].
Studies carried out in sub-Saharan Africa have concluded that the subsistence agriculture is the main driver in the poorest rural populations, often associated with deforestation for charcoal production and/or forest fires [15,16]. Thus, some authors link deforestation to food security, with the most frequent causes being agriculture [17] and exploitation of biomass as fuel [18]. In Angola, the main proximate drivers are the overextraction of timber resources, clearing for agricultural purposes, unregulated burning, and overgrazing [19]. This has led to an increase in deforestation rate from 0.2% in 2000 to 0.8% in the period 2000–2019 [7], compromising the current and future ecosystem services of the Miombo.
Charcoal production is a very important activity in Miombo and is increasingly becoming a lucrative business. Charcoal production in rural areas causes large environmental impact, especially in comparison with that generated by fuelwood, mainly in periurban areas [7]. This activity, which is continuously growing in Africa, is one of the main causes of deforestation and forest degradation both in Africa and Angola [18,20]. One of the main problems related to charcoal production in the Angolan Miombo is the lack of data about the potential productive capacity of this ecosystem. This leads to a lack of tools for assessing admissible annual cut values and, thus, for sustainable management. Some of the tools often used for assessing productive capacity, such as dendrochronology, have not often been used in such studies in tropical forests due to the great diversity of species and the difficulty in assessing annual growth [21]. Previous works have assessed annual growth in Miombo species to determine the annual allowable cutting volume [22]. Therefore, study of the productivity of the Miombo ecosystem is an important tool to increase knowledge about the charcoal production capacity and the annual allowable cutting volume, including the variables in forest management plans to increase the sustainability of this activity.
The aim of this study was to assess the productivity of Miombo ecosystem in Huambo (Angola) to estimate C sequestration and charcoal production capacity. The specific objectives were (i) to assess deforestation in miombo forest in Huambo province (Angola) during the last 20 years, (ii) to evaluate carbon storage capacity of miombo, and (iii) to calculate the charcoal productive capacity of those forests and compare them with the carbon storage capacity. The results obtained will provide information about the charcoal production for the management of miombo woodland resources in Huambo province, ensuring the sustainability of the activity and ecosystem services and improving forest management in a context of vulnerability of the local population. This information could also open up new funding opportunities, facilitating the engagement of rural communities with initiatives for reducing emissions from deforestation, forest degradation, and forest management (REDD+) or Clean Development Mechanisms (CDM) [1,23].
2. Material and Methods
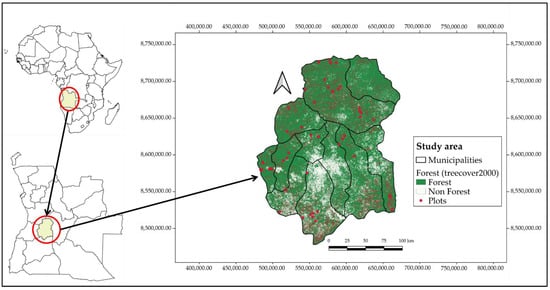
The study site is located in Huambo province (Angola), which covers an area of 34,270 km2 on the Central Plateau (Figure 1). Huambo is the province with the second-highest stock of biomass in Angola [24]; however, it is one of three provinces with the highest loss of forest cover in the country [25] and has the fifth-highest emissions [26]. In this case, it is not only the number of trees removed that threatens the stability of Miombo forests, but also the deforestation patterns associated with the demand for charcoal and firewood production for cooking and heating [20].
The climate—according to the Thornthwaite classification—is characterized as humid mesotherm, with cold and dry winters from May to September and hot and rainy summers from October to April [27]. The climatology is conditioned by a high altitude (more than 95% of its surface above 1500 m) with an average temperature of 20 °C, maximum temperatures of 25–27 °C, and minimum of 11–13 °C, precipitation of 1366 mm, and relative humidity that varies between 60 and 70% in January and 35 and 70% in August [27]. The predominant soils are of the ferralitic type. According to the Angolan Phytogeographic Chart [28], the province of Huambo is dominated by savanna-type Miombo forests with a high presence of Julbernardia and Brachystegia species with patches of low-density miombo on mesoplanaltic slopes (between the valleys of the Keve and Kwanza rivers) and high-elevation meadows (anharas) on ferralitic and thin soils.
Forty-nine permanent plots were established according to stratified sampling into the Huambo province. At each stratum, plots were randomly distributed based on the forest cover phytogeographic map of the Huambo province by Jaxa in 2015 [29], the soil map of Angola [28], and Huambo roads with a buffer of 500 m per side (Open Street Map, 2016). Each plot was georeferenced taking the central coordinates (GPS Garmin MAP 60 csx) and projected according to the UTM projection system. Once each plot was located, a circular plot following the N–S direction of 10 m-radius (314 m2) was laid out using a handheld compass (Suunto KB-14/360R G Compass; Finland) and a 50-m measuring tape (Lufkin®, Mexico) (Figure 1).
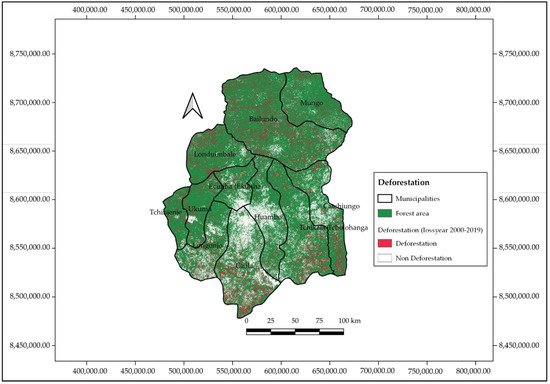
3. Deforestation
| Municipality | Forest Area 2000 (ha) | Deforestation (ha) | Deforestation (%) |
|---|---|---|---|
| Bailundo | 662,026 | 100,449 | 15.17 |
| Caála | 270,146 | 55,826 | 20.67 |
| Cathiungo | 225,175 | 26,568 | 11.80 |
| Ecunha | 113,311 | 9837 | 8.68 |
| Huambo | 205,780 | 16,511 | 8.02 |
| Londuimbali | 241,025 | 30,931 | 12.83 |
| Longonjo | 177,232 | 23,325 | 13.16 |
| Mungo | 280,719 | 25,533 | 9.10 |
| Tchikala | 358,482 | 44,211 | 12.33 |
| Tchinjenje | 82,765 | 10,788 | 13.03 |
| Ukuma | 153,543 | 15,151 | 9.87 |
| Total | 2,770,205 | 359,130 | 12.96 |
4. Composition and Structure
5. Accumulated Carbon and CO2 Equivalent
| Variable | Above-Ground | Below-Ground | Total |
|---|---|---|---|
| Biomass 1 | 140.04 ± 108.59 (24.68–716.41) |
55.02 ± 31.69 (14.68–209.55) |
195.05 ± 140.14 (39.36–925.96) |
| Accumulated Carbon 2 | 65.82 (11.60–336.71) |
25.86 ± 14.89 (6.90–98.48) |
91.67 (18.50–435.20) |
| CO2 equivalent 3 | 241.32 (42.53–1234.61) |
94.81 (25.30–361.12) |
336.13 (67.84–1595.74) |
| Municipality | Total Biomass 1 | Volume 2 | Accumulated C 3 | CO2eq 4 |
|---|---|---|---|---|
| Bailundo | 218.18 ± 214.35 | 79.09 ± 36.01 | 102.55 ± 100.75 | 376.00 ± 369.40 |
| Caála | 177.10 ± 75.42 | 92.39 ± 46.73 | 83.24 ± 35.45 | 305.21 ± 129.98 |
| Ekunha | 212.01 ± 49.72 | 72.86 ± 27.16 | 99.65 ± 23.37 | 365.37 ± 85.68 |
| Katchiungo | 178.48 ± 46.66 | 83.87 ± 5.49 | 83.88 ± 21.93 | 307.58 ± 80.42 |
| Londuimbale | 181.23 ± 42.11 | 70.88 ± 12.14 | 85.18 ± 19.79 | 312.32 ± 72.57 |
| Longonjo | 157.69 ± 55.75 | 77.24 ± 17.73 | 74.11 ± 26.20 | 271.75 ± 96.08 |
| Tchicala | 113.03 ± 58.74 | 56.44 ± 23.15 | 53.12 ± 27.61 | 194.79 ± 101.23 |
| Tchingenje | 184.29 ± 112.72 | 70.62 ± 26.28 | 86.62 ± 52.98 | 317.59 ± 194.26 |
| Ukuma | 289.85 ± 6.74 | 96.71 ± 10.48 | 136.23 ± 3.17 | 499.51 ± 11.62 |
6. Productive capacity
The Potential Charcoal Productivity (PCP) was 15,359.9 kg ha−1, although the variability between municipalities was very high, ranging from 11,034.87 Kg ha−1 for (Tchicala) to 18,907.60 Kg ha−1 for (Ukuma).
The Allowable Cutting Value (ACV) was 24.78 trees ha−1, with the lowest values in Londuimbale (22 trees ha−1) and the highest values in Caála (31.57 trees ha−1).
| Municipality | 1 PCP (Kg ha−1) | 2 ACV (N. Trees ha−1) |
|---|---|---|
| Bailundo |
15,461.62 ± 7040.92 |
23.06 ± 5.41 |
Caála |
18,061.42 ± 9136.63 |
31.57 ± 21.69 |
| Ekunha |
14,245.06 ± 5310.49 |
25.50 ± 3.54 |
| Katchiungo |
16,395.84 ± 1073.17 |
24.75 ± 4.79 |
| Londuimbale |
13,857.53 ± 2373.48 |
22.00 ± 1.00 |
| Longonjo |
15,100.04 ± 3465.85 |
25.00 ± 4.24 |
| Tchicala |
11,034.87 ± 4525.17 |
27.50 ± 11.12 |
| Tchingenje |
13.806.39 ± 5136.87 |
22.43 ± 5.91 |
Ukuma |
18,907.60 ± 2048.33 |
22.67 ± 4.51 |
1 Mean values and standard deviations of PCP expressed in Kg ha−1. 2 Mean values and standard deviation of ACV expressed in number of trees ha−1.
When comparing the biomass carbon storage with the potential charcoal productivity, there is a correlation at the extreme values (Tchicala and Ukuma) despite the correlation coefficient not being very high (0.5).
For a rotation period of 55 years, the Annual Allowable Cutting (ACV) was 14.31 ± 5,61 trees ha−1 year−1, increasing for shorter periods (40 years, 19.68 ± 7.72 trees ha−1 year−1; 25 years, 31.5 ± 12.35 trees ha−1 year−1; 15 years, 52.5 ± 20.58 trees ha−1 year−1).
Values of AAC corresponding to values of Annual Allowable Cutting Volume (AACV) of 10.77 ± 6.05 m3 ha−1 year−1, 14.13 ± 7.96 m3 ha−1 year−1, 21.17 ± 11.93 m3 ha−1 year−1, and 32.85 ± 18.51 m3 ha−1 year−1 (55, 40, 25, and 15 years, respectively).
The Potential Annual Allowable Charcoal Productivity (PAACP) were 2107.08 ± 1183.53 kg ha−1 year−1, 2762.96 ± 1557.41 kg ha−1 year−1, 4139.21 ± 2333.17 kg ha−1 year−1, and 6422.56 ± 3620.24 kg ha−1 year−1 for the rotation lengths considered (55, 40, 25, and 15, respectively).
This entry is adapted from the peer-reviewed paper 10.3390/f12111557