 +1 credit
| Version | Summary | Created by | Modification | Content Size | Created at | Operation |
|---|---|---|---|---|---|---|
| 1 | Martha Kafetzi | + 3317 word(s) | 3317 | 2021-11-22 02:25:03 | | | |
| 2 | Bruce Ren | Meta information modification | 3317 | 2021-11-30 01:32:29 | | |
Video Upload Options
The aim of this work is to investigate the preparation, the optical properties and the stability over time of a colloidal oraganic-inorganic hybrid perovskite (CH3NH3PbBr3)/random copolymer P(MMA-co-DMAEMA) system. Different ratios of perovskite to copolymer were used to study its effect on stability and properties. The optical properties were investigated by UV-Vis and Fluorescence Spectroscopy. Dynamic light scattering was used to determine the size, and the polydispersity of the colloidal hybrid particles; while morphology was investigated by transmission electron microscopy. Photoluminescence decay studies revealed the interaction of the random copolymer with the perovskite. Finally, thin-films were prepared to investigate the optical properties of thin hybrid films was observed under certain conditions.
1. Introduction
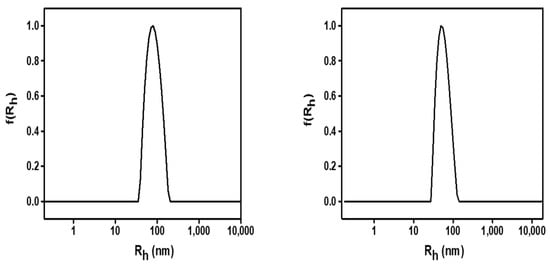
2. Hybrid Nanoparticle Preparation and Dynamic Light Scattering Measurements
| Sample | Cperov in DMF (mM) | Ccopol in toluene (g/mL) | Rh a [35] (nm) |
|---|---|---|---|
| 1a | 6.25 | 3.125 × 10⁻³ | 2.4 |
| 1b | 12.5 | 3.125 × 10⁻³ | 58 |
| 1c | 25.0 | 3.125 × 10⁻³ | 46 |
| 1d | 50.0 | 3.125 × 10⁻³ | 64 |
| 2a | 6.25 | - | N/A |
| 2b | 12.5 | - | 150 |
| 2c | 25.0 | - | 123 |
| 2d | 50.0 | - | 117 |
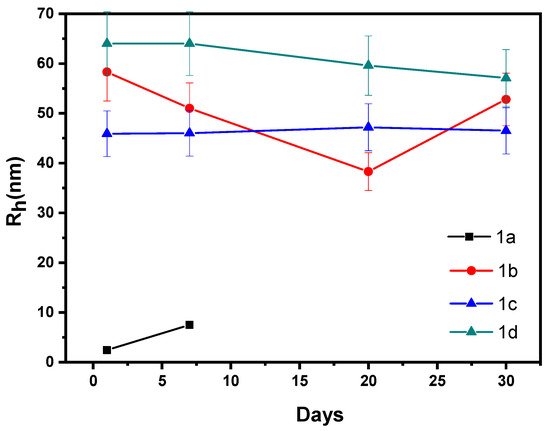
| Sample 1a | Sample 1b | Sample 1c | Sample 1d | |||||
|---|---|---|---|---|---|---|---|---|
| Day | Intensity a (kc/s) | Rh a [36] (nm) | Intensity a (kc/s) | Rh a [36] (nm) | Intensity a (kc/s) | Rh a [36] (nm) | Intensity a (kc/s) | Rh a [36] (nm) |
| 1st | 28 | 2.45 | 124 | 58 | 2994 | 45.9 | 18,387 | 64 |
| 7th | 37 | 7.5 | 99 | 51 | 880 | 46 | 14,387 | 64 |
| 20th | 34 | - | 53 | 38 | 612 | 47.2 | 3277 | 60 |
| 30th | - | - | 51 | 53 | 385 | 46.5 | 2590 | 57 |
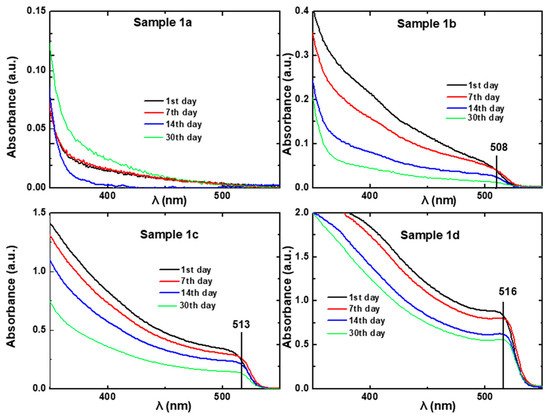
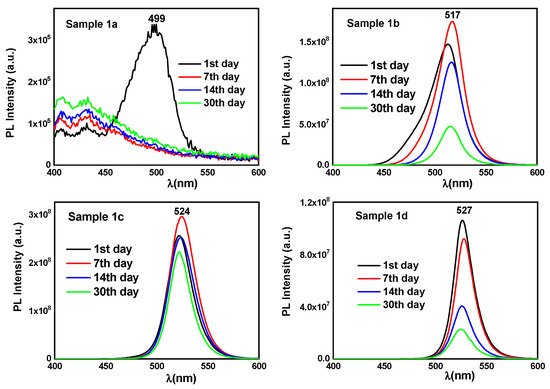
3. Optical Properties
3.1. Perovskite/Polymer Solutions
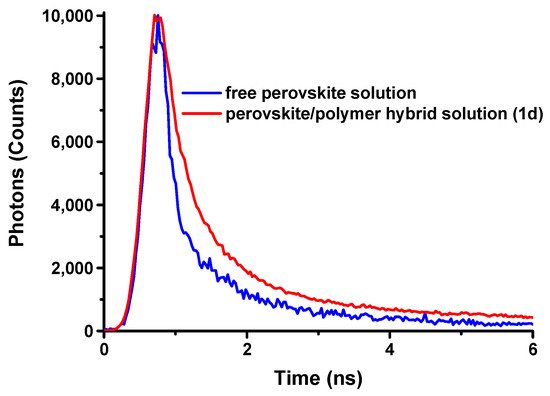
3.2. Time-Resolved Photoluminescence Decay Studies
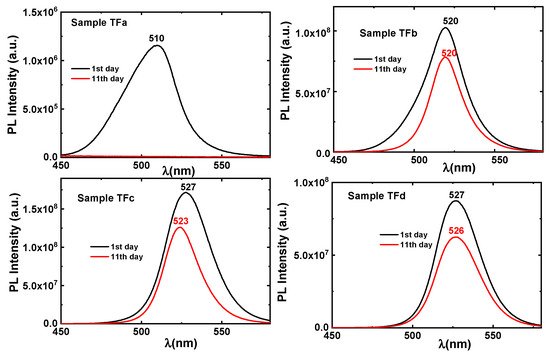
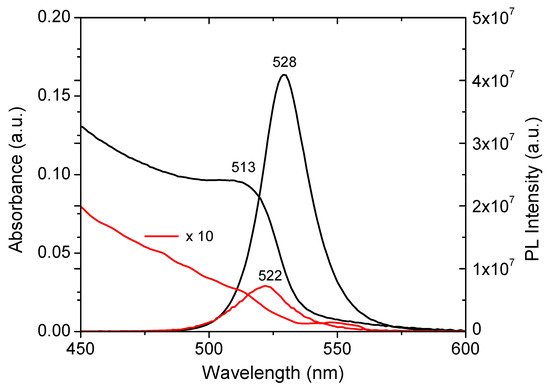
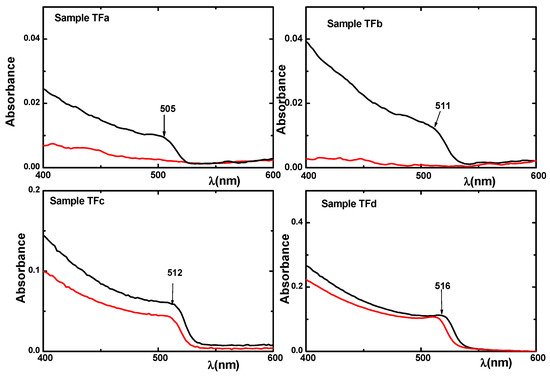
3.3. Perovskite/Polymer Hybrid Thin-Films
| Precursor Solution |
Thin-Film Sample Code |
C Perovskite in DMF (mM) |
Thickness (μm) |
|---|---|---|---|
| 1a | TFa | 6.26 | 1500.3 |
| 1b | TFb | 12.52 | 4900.4 |
| 1c | TFc | 25.04 | 1700.8 |
| 1d | TFd | 50.08 | 3400.2 |
References
- Mousdis, G.A.; Papavassiliou, G.C.; Raptopoulou, C.P.; Terzis, A. Preparation and characterization of PbI4 and similar compounds with a layered perovskite structure. J. Mater. Chem. 2000, 10, 515–518.
- Papavassiliou, G.C.; Mousdis, G.A.; Koutselas, I. Basic Properties and Early Works in Organic–Inorganic Perovskites. In Halide Perovskites: Photovoltaics, Light Emitting Devices, and Beyond; Sum, T.-C., Mathews, N., Eds.; Wiley-VCH GmbH & Co.: Hoboken, NJ, USA, 2019.
- Stoumpos, C.C.; Malliakas, C.D.; Kanatzidis, M.G. Semiconducting tin and lead iodide perovskites with organic cations: Phase transitions, high mobilities, and near-infrared photoluminescent properties. Inorg. Chem. 2013, 52, 9019–9038.
- Xing, G.; Mathews, N.; Sun, S.; Lim, S.S.; Lam, Y.M.; Grätzel, M.; Mhaisalkar, S.; Sum, T.C. Long-range balanced electron- and hole-transport lengths in organic–inorganic CH3NH3PbI3. Science 2013, 342, 344–347.
- Stranks, S.D.; Eperon, G.E.; Grancini, G.; Menelaou, C.; Alcocer, J.P.M.; Leijtens, T.; Herz, M.L.; Petrozza, A.; Snaith, H.J. Electron–hole diffusion lengths exceeding 1 micrometer in an organometal trihalide perovskite absorber. Science 2013, 342, 341–344.
- Papavassiliou, G.C.; Vidali, M.S.; Pagona, G.; Mousdis, G.A.; Karousis, N.; Koutselas, I. Effects of organic moieties on the photoluminescence spectra of perovskite-type tin bromide based compounds. J. Phys. Chem. Solids 2015, 79, 1–6.
- Papavassiliou, G.C.; Mousdis, G.A.; Pagona, G.; Karousis, N.; Vidali, M.S. Room temperature enhanced blue-green, yellow-orange and red phosphorescence from some compounds of the type (CH3NH3)n−1(1-naphthylmethyl ammonium)2Pbn(ClxBr1−x)3n+1 (with n = 1, 2 and 0 ≤ x ≤ 1) and related observations from similar compounds. J. Lumin. 2014, 149, 287–291.
- Papavassiliou, G.C.; Mousdis, G.A.; Koutselas, I. Excitonic bands in the spectra of some organic-inorganic hybrid compounds based on metal halide units. Mon. Chem. 2001, 132, 113–119.
- Papavassiliou, G.C.; Mousdis, G.A.; Anyfantis, G.C.Z. Organic-inorganic hybrid compounds based on lead halide units: Preparation from melts and through grinding effects. Z. Nat. B 2010, 65, 516–520.
- Eperon, G.E.; Stranks, S.D.; Menelaou, C.; Johnston, M.B.; Herz, L.M.; Snaith, H.J. Formamidinium lead trihalide: A broadly tunable perovskite for efficient planar heterojunction solar cells. Energy Environ. Sci. 2014, 7, 982–988.
- Zhang, F.; Zhong, H.; Chen, C.; Wu, X.G.; Hu, X.; Huang, H.; Han, J.; Zou, B.; Dong, Y. Brightly luminescent and color-tunable colloidal CH3NH3PbX3 (X = Br, I, Cl) quantum dots: Potential alternatives for display technology. ACS Nano 2015, 9, 4533–4542.
- Zhao, Y.; Zhu, K. Organic–inorganic hybrid lead halide perovskites for optoelectronic and electronic applications. Chem. Soc. Rev. 2016, 45, 655–689.
- Tan, Z.-K.; Moghaddam, R.S.; Lai, M.L.; Docampo, P.; Higler, R.; Deschler, F.; Price, M.; Sadhanala, A.; Pazos, L.M.; Credgington, D.; et al. Bright light-emitting diodes based on organometal halide perovskite. Nat. Nanotechnol. 2014, 9, 687–692.
- Fang, Y.; Dong, Q.; Shao, Y.; Yuan, Y.; Huang, J. Highly narrowband perovskite single-crystal photodetectors enabled by surface-charge recombination. Nat. Photonics 2015, 9, 679–686.
- Zhu, H.; Fu, Y.; Meng, F.; Wu, X.; Gong, Z.; Ding, Q.; Gustafsson, M.V.; Trinh, M.T.; Jin, S.; Zhu, X.Y. Lead halide perovskite nanowire lasers with low lasing thresholds and high quality factors. Nat. Mater. 2015, 14, 636–642.
- Mei, Y.; Zhang, C.; Vardeny, Z.; Jurchescu, O. Electrostatic gating of hybrid halide perovskite field-effect transistors: Balanced ambipolar transport at room-temperature. MRS Commun. 2015, 5, 297–301.
- Yang, S.; Fu, W.; Zhang, Z.; Chen, H.; Li, C.Z. Recent advances in perovskite solar cells: Efficiency, stability and lead-free perovskite. J. Mater. Chem. A 2017, 5, 11462–11482.
- Veldhuis, S.A.; Boix, P.P.; Yantara, N.; Li, M.; Sum, T.C.; Mathews, N.; Mhaisalkar, S.G. Perovskite Materials for Light-Emitting Diodes and Lasers. Adv. Mater. 2016, 28, 6804–6834.
- Uchman, M.; Procházka, K.; Gatsouli, K.; Pispas, S.; Špírková, M. CdS-containing nano-assemblies of double hydrophilic block copolymers in water. Colloid Polym. Sci. 2011, 289, 1045–1053.
- Mόller-Buschbaum, P.; Thelakkat, M.; Fassler, F.T.; Stutzmann, M. Hybrid Photovoltaics—From Fundamentals towards Application. Adv. Energy Mater. 2017, 7, 1700248.
- Huang, H.; Bodnarchuk, M.; Kershaw, S.; Kovalenko, M.; Rogach, A. Lead Halide Perovskite Nanocrystals in the Research Spotlight: Stability and Defect Tolerance. ACS Energy Lett. 2017, 9, 2071–2083.
- Sichert, J.A.; Tong, Y.; Mutz, N.; Vollmer, M.; Fischer, S.; Milowska, K.Z.; García Cortadella, R.; Nickel, B.; Cardenas-Daw, C.; Stolarczyk, J.K.; et al. Quantum size effect in organometal halide perovskite nanoplatelets. Nano Lett. 2015, 15, 6521–6527.
- Schmidt, L.C.; Pertegas, A.; Gonzalez-Carrero, S.; Malinkiewicz, O.; Agouram, S.G.; Minguez Espallargas, G.; Bolink, H.J.; Galian, R.E.; Perez-Prieto, J. Nontemplate Synthesis of CH3NH3PbBr3 Perovskite Nanoparticles. J. Am. Chem. Soc. 2014, 136, 850–853.
- Gonzalez-Carrero, S.; Galian, R.E.; Perez-Prieto, J. Maximizing the emissive properties of CH3NH3PbBr3 perovskite nanoparticles. J. Mater. Chem. A 2015, 3, 9187–9193.
- Papavassiliou, G.C.; Pagona, G.; Mousdis, G.A.; Karousis, N. Enhanced phosphorescence from nanocrystalline/microcrystalline materials based on (CH3NH3)(1-naphthylmethyl ammonium)2Pb2Cl7 and similar compounds. Chem. Phys. Lett. 2013, 570, 80–84.
- Protesescu, L.; Yakunin, S.; Bodnarchuk, M.I.; Krieg, F.; Caputo, R.; Hendon, C.H.; Yang, R.X.; Walsh, A.; Kovalenko, M.V. Nanocrystals of cesium lead halide perovskites (CsPbX3, X = Cl, Br, and I): Novel optoelectronic materials showing bright emission with wide color gamut. Nano Lett. 2015, 15, 3692–3696.
- Förster, S.; Antonietti, M. Amphiphilic block copolymers in structure-controlled nanomaterial hybrids. Adv. Mater. 1998, 10, 195–217.
- Mai, Y.; Eisenberg, A. Self-assembly of block copolymers. Chem. Soc. Rev. 2012, 41, 5969–5985.
- Kaditi, H.; Mountrichas, G.; Pispas, S. Amphiphilic block copolymers by a combination and selective post-polymerization functionalization. Eur. Polym. J. 2011, 415–434.
- Kafetzi, M.; Pispas, S. Multifaceted pH and Temperature Induced Self-Assembly of P(DMAEMA-co-LMA)-b-POEGMA Terpolymers and Their Cationic Analogues in Aqueous Media. Macromol. Chem. Phys. 2021, 222, 2000358.
- Mountrichas, G.; Pispas, S.; Kamitsos, E. Effect of Temperature on the Direct Synthesis of Gold Nanoparticles Mediated by Poly(dimethylaminoethyl methacrylate) Homopolymer. J. Phys. Chem. C 2014, 118, 22754–22759.
- Gao, Μ.; Yu, S.; Yuan, J.; Zhang, W.; Antonietti, M. Poly(ionic liquid)-Mediated Morphogenesis of Bismuth Sulfide with a Tunable Band Gap and Enhanced Electrocatalytic Properties. Angew. Chem. Int. Ed. 2016, 55, 12812–12816.
- Vlassi, E.; Mousdis, G.A.; Pispas, S. Nickel dithiolene complexes encapsulated in biocompatible amphiphilic diblock copolymer nanoparticles. J. Pol. Sci. Part. B Pol. Phys. 2016, 54, 2507–2513.
- Michman, E.; Shenhar, R. Directed self-assembly of block copolymer based nanocomposites in thin films. Polym. Adv. Technol. 2017, 28, 613–622.
- Des Cloizeaux, J.; Jannink, G. Polymers in Solution Their Modelling and Structure; Clarendon Press: Oxford, UK, 1990; Chapter 10; pp. 415–417.
- Provencher, S. CONTIN: A general purpose constrained regularization program for inverting noisy linear algebraic and integral equations. Comp. Phys. Commun. 1982, 27, 229–242.
- Zhang, Z.Y.; Wang, H.Y.; Zhang, Y.X.; Hao, Y.W.; Sun, C.; Zhang, Y.; Gao, B.R.; Chen, Q.D.; Sun, H.B. The Role of Trap-assisted Recombination in Luminescent Properties of Organometal Halide CH3NH3PbBr3 Perovskite Films and Quantum Dots. Sci. Rep. 2016, 6, 27286.
- Shi, D.; Adinolfi, V.; Comin, R.; Yuan, M.; Alarousu, E.; Buin, A.; Chen, Y.; Hoogland, S.; Rothenberger, A.; Katsiev, K.; et al. Low Trap-State Density and Long Carrier Diffusion in Organolead Trihalide Perovskite Single Crystals. Science 2015, 347, 519–522.
- Kojima, A.; Ikegami, M.; Teshima, K.; Miyasaka, T. Highly Luminescent Lead Bromide Perovskite Nanoparticles Synthesized with Porous Alumina Media. Chem. Lett. 2012, 41, 397–399.
- Zhang, M.; Yu, H.; Lyu, M.; Wang, Q.; Yun, J.H.; Wang, L.Z. Composition-dependent photoluminescence intensity and prolonged recombination lifetime of perovskite CH3NH3PbBr3−xClx films. Chem. Commun. 2014, 50, 11727–11730.
- Du, J.S.; Shin, D.; Stanev, R.K.; Musumeci, C.; Xie, Z.; Huang, Z.; Lai, M.; Sun, L.; Zhou, W.; Stern, N.P.; et al. Halide perovskite nanocrystals arrays: Multiplexed synthesis and sizedependent emission. Sci. Adv. 2020, 6, eabc4959.
- Zuo, L.; Guo, H.; de Quilettes, D.W.; Jariwala, S.; De Marco, N.; Dong, S.; DeBlock, R.; Ginger, D.S.; Dunn, B.; Wang, M.; et al. Polymer-modified halide perovskite films for efficient and stable planar heterojunction solar cells. Sci. Adv. 2017, 3, e1700106.

