Since several CLRs use the adapter protein CARD9 for intracellular signaling, the aim of this study was to determine the effect of the CLR/Syk/CARD9 axis on virus control and neuropathology. To investigate the impact of CARD9 on acute neuropathology, the TMEV infection model was employed using CARD9−/− mice and C57BL/6 wild-type control mice (WT). Results indicate that CARD9 signaling has a limited role in early antiviral immunity but contributes to reducing hippocampal injury following acute neurotropic virus infection.
2. Loss of CARD9 Promotes Hippocampal Damage Following Virus Infection
TMEV primarily targets the hippocampus of mice and causes polioencephalitis in C57BL/6 mice during acute infection
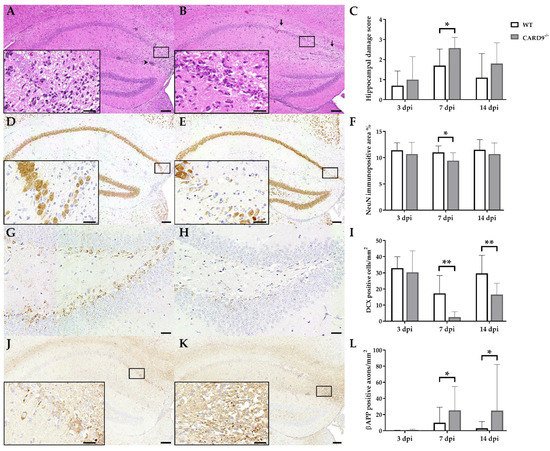
[15]. Histology of infected mice revealed the presence of inflammatory responses within the hippocampus characterized by mononuclear infiltrates and gliosis associated with neuronal loss of the stratum pyramidale. A significantly increased severity of hippocampal damage, as determined by semiquantitative scoring, was found in CARD9
−/− mice compared to WT mice at 7 dpi (p = 0.03;
Figure 1A–C). Accordingly, an increased loss of NeuN
+ mature neurons in the stratum pyramidale was found in CARD9
−/− mice compared to WT mice at 7 dpi by densitometry (p = 0.05;
Figure 1D–F). To detect more subtle brain lesions, labeling of DCX
+ neuronal progenitor cells and β-APP, as a marker for damaged axons, was performed. Here, a significant reduction in DCX
+ cells were observed in the hippocampal dentate gyrus of CARD9
−/− mice compared to WT mice at 7 dpi (p < 0.01) and 14 dpi (p = 0.01;
Figure 1G–I), indicative of disturbed neurogenesis. Moreover, a significant accumulation of swollen β-APP
+ axons preferentially in the cornu ammonis region CA1 of CARD9
−/− mice compared to WT mice was detected at 7 dpi (p = 0.03) and 14 dpi (p = 0.03;
Figure 1J–L).
Figure 1. Hippocampal damage in C57BL/6 wild-type (WT) mice and CARD9-deficient (CARD9−/−) mice following Theiler’s murine encephalomyelitis virus (TMEV) infection. Hematoxylin and eosin staining of the hippocampus with (A) mild neuronal loss and perivascular cuffs (arrowhead) of a WT mouse and (B) marked neuronal loss (arrows) of a CARD9−/− mouse at 7 days post infection (dpi). (C) Histological scoring of hippocampal damage. NeuN-specific immunohistochemistry of (D) a WT mouse with mild loss of neuronal nuclear antigen (NeuN)+ mature neurons in the hippocampus and of (E) a CARD9−/− mouse with prominent loss of NeuN+ neurons in the CA1 region at 7 dpi. (F) Percentage of NeuN immunopositive area in the hippocampus. Doublecortin (DCX)-specific immunohistochemistry in the hippocampal dentate gyrus of (G) a WT mouse and (H) a CARD9−/− mouse with marked loss of DCX+ cells at 7 dpi. (I) Quantification of DCX+ neuronal progenitor cells in the dentate gyrus. β-APP-specific immunohistochemistry of (J) a WT mouse with a marginal number of β-APP+ axons in the hippocampus and (K) a CARD9−/− mice with several swollen β-APP+ axons in the hippocampus at 7 dpi. (L) Quantification of β-APP+ axons in the hippocampus. (C,F,I,L) Significant differences between WT and CARD9−/− mice are labelled with asterisks (* p ≤ 0.05; ** p ≤ 0.01; Mann–Whitney U-test). Three dpi: WT n = 10, CARD9−/− n = 10; 7 dpi: WT n = 10, CARD9−/− n = 9; 14 dpi: WT n = 10, CARD9−/− n = 10. Data are displayed as mean with SD. Immunohistochemistry, scale bar: 100 µm (A,B,D,E,J,K) and 20 µm (A,B,D,E,J,K, inserts; G,H).
Conclusively, data show that CARD9 deficiency enhances hippocampal damage with increased neuronal loss, axonopathy and disturbed neurogenesis following acute TMEV infection.
3. CARD9 Deficiency Transiently Increases the Viral Burden but Does Not Prevent Viral Clearance
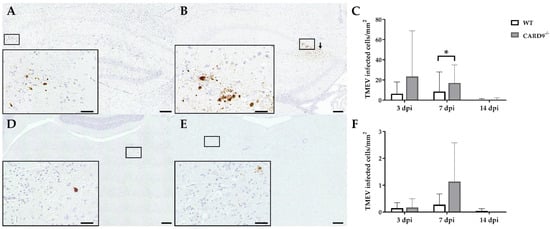
TMEV antigen was found predominantly in hippocampal pyramidal neurons of the CA1 regions in both CARD9
−/− and WT mice following infection, as demonstrated by immunohistochemistry. Quantification revealed a significant increase in TMEV-infected cells in the hippocampus of CARD9
−/− mice compared to WT mice at 7 dpi (p = 0.05). At 14 dpi, only a few TMEV-infected cells were detected in the forebrain in CARD9
−/− mice and WT mice, indicating virus elimination in both groups (
Figure 2A–C). Few TMEV-infected cells were found in the brain stem of infected mice without significant differences observed between CARD9
−/− and WT mice (
Figure 2D–F). In addition, only a few TMEV-infected cells were found in the spinal cord of animals (
Figure S2) without differences observed between both groups. No infected cells were found in the cerebellum. Using RT-qPCR, an increase in TMEV-RNA levels were only detected by trend (p = 0.07) in the brain of CARD9
−/− mice at 3 dpi, and no differences of viral RNA levels in the brain of CARD9
−/− and WT mice were detected at 7 and 14 dpi (
Figure S3).
Figure 2. Quantification of Theiler‘s murine encephalomyelitis virus (TMEV)-infected cells in C57BL/6 wild-type (WT) mice and CARD9−/− mice. TMEV-infected cells in the hippocampus of (A) a WT and (B) a CARD9−/− mouse at 7 days post infection (dpi). (B) TMEV antigen (arrows) primarily in pyknotic hippocampal neurons of a CARD9−/− mouse at 7 dpi. (C) Quantification of TMEV-infected cells in the hippocampus. TMEV-infected cells in the brainstem of (D) a WT and (E) a CARD9−/− mouse at 7 dpi. (F) Quantification of TMEV-infected cells in the brainstem. (A,B,D,E) TMEV-specific immunohistochemistry. * Significant difference between WT and CARD9−/− mice (p ≤ 0.05; Mann–Whitney U-test). Three dpi: WT n = 10, CARD9−/− n = 10; 7 dpi: WT n = 10, CARD9−/− n = 9; 14 dpi: WT n = 10, CARD9−/− n = 10. Data are displayed as mean with SD. Immunohistochemistry, scale bar: 100 µm (A,B,D,E) and 20 µm (A,B,D,E).
In conclusion, data reveal that CARD9 deficiency has an only limited effect on the viral brain load during the acute phase of TMEV infection, since it transiently increases the virus brain load but does not affect viral clearance and spread within the CNS.
4. Hippocampal Damage in CARD9−/− Mice Is Associated with an Increased T Cell, B Cell, Regulatory T Cell and M2-Type Myeloid Cell Infiltration
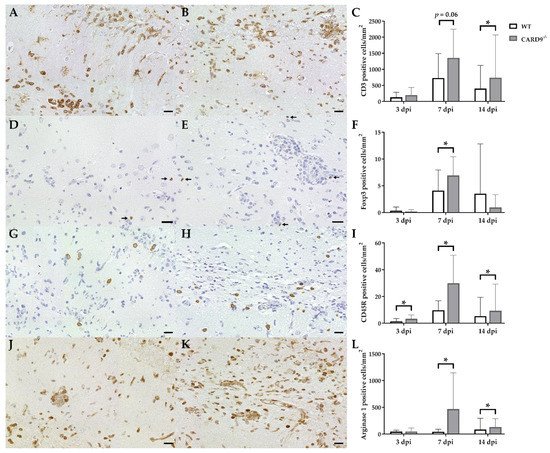
Immunohistochemistry was performed to phenotype immune cell sequestration in the hippocampus. Infected CARD9−/− mice showed a significantly enhanced recruitment of CD3+ T cells in the hippocampus at 14 dpi (p = 0.02) compared to infected WT mice (Figure 3A–C).
Figure 3. Phenotyping of immune cells in the hippocampus of C57BL/6 wild-type (WT) mice and CARD9−/− mice following Theiler’s murine encephalomyelitis virus (TMEV) infection. CD3-specific immunostaining in the hippocampus of (A) a WT mouse and (B) a CARD9−/− mouse at 7 days post infection (dpi), which shows a prominent infiltration of CD3+ T cells (arrows) in CARD9−/− mice. (C) Quantification of CD3+ T cells in the hippocampus. (D) Image of few Foxp3+ regulatory T cells (arrow) in a WT mouse at 7 dpi. (E) Increased numbers of Foxp3+ cells (arrows) in a CARD9−/− mouse at 7 dpi. (F) Quantification of Foxp3+ regulatory T cells in the hippocampus. (G) Low numbers of CD45R+ B cells in a WT mouse at 7 dpi. (H) Increase in CD45R+ B cells in the hippocampus of a CARD9−/− mice at 7 dpi. (I) Quantification of CD45R+ B cells in the hippocampus. (J) Image of arginase 1+ M2-type macrophages/microglia in the hippocampus of a WT mouse at 7 dpi. (K) Increase in arginase 1+ M2-type macrophages/microglia in a CARD9−/− mice at 7 dpi. (L) Quantification of arginase 1+ cells in the hippocampus. * Significant difference between WT and CARD9−/− mice (p ≤ 0.05; Mann–Whitney U-test). Three dpi: WT n = 10, CARD9−/− n = 10; 7 dpi: WT n = 10, CARD9−/− n = 9; 14 dpi: WT n = 10, CARD9−/− n = 10. Data are displayed as mean with SD. Immunohistochemistry, scale bar: 20 µm (A,B,D,E,G,H,J,K).
Compared to CD3+ T cells, only a few Foxp3+ regulatory T cells were found in hippocampi of infected mice. At 7 dpi, elevated numbers of Foxp3+ cells were found in CARD9−/− mice (p = 0.05; Figure 3D–F), while no significant differences of infiltrating granzyme B+ cells (effector T cells) between CARD9−/− and WT mice were found in the hippocampus at any time point. CARD9−/− mice exhibit a significantly increased expansion of CD45R+ B cells in the hippocampus compared to WT mice at all investigated time points (3 dpi, p = 0.03; 7 dpi, p = 0.01; 14 dpi, p = 0.02; Figure 3G–I). No significant changes in CD107b+ microglia/macrophage numbers were observed between CARD9−/− and WT mice at any time point post infection. However, increased numbers of arginase 1+ myeloid cells (M2-type macrophages/microglia) were present in the hippocampus of CARD9−/− mice compared to WT mice at 7 dpi (p = 0.03) and 14 dpi (p = 0.03; Figure 3J–L).
Conclusively, data indicate that the enhanced hippocampal damage and neuroinflammation in CARD9−/− mice is accompanied by modulatory responses, such as an enhanced M2-polarization of macrophages/microglia and regulatory T cell recruitment.
5. CARD9−/− Mice Develop Early Pro-Inflammatory Cytokine Responses in the Brain
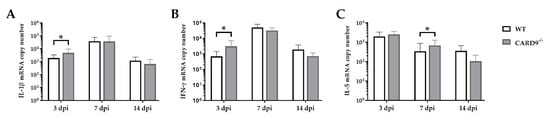
Cytokine expression analyses were performed to characterize inflammatory responses in the brain in more detail. RT-qPCR revealed a significant increase in IL-1β (p = 0.02) and IFN-γ (p = 0.03) in the brain of CARD9
−/− mice compared to WT mice following TMEV infection at 3 dpi (
Figure 4A,B). At 7 dpi, a significantly increased transcription of IL-5 (p = 0.05) was found in the brain of infected CARD9
−/− mice compared to WT controls (
Figure 4C). Gene expression of IL-1α, IL-4, IL-6, IL-10, TGF-β1 and TNF-α did not differ between groups at any investigated time point post infection (
Figure S4). Between non-infected CARD9
−/− mice and WT mice, no differences were found in the brain for all investigated cytokines (
Figure S6).
Figure 4. Cytokine mRNA expression in the cerebrum of C57BL/6 wild-type (WT) mice and CARD9−/− mice following Theiler’s murine encephalomyelitis virus (TMEV) infection. Quantification of (A) interleukin (IL)-1β, (B) interferon (IFN)-γ and (C) IL-5 mRNA levels in the cerebrum by reverse transcription quantitative polymerase chain reaction (RT-qPCR). * Significant difference between WT and CARD9−/− mice (p ≤ 0.05; Mann–Whitney U-test). Three dpi: WT n = 10, CARD9−/− n = 10; 7 dpi: WT n = 10, CARD9−/− n = 9; 14 dpi: WT n = 10, CARD9−/− n = 10. Data are displayed as mean with SD.
Data show that CARD9 deficiency is able to alter cytokine expression in the brain with temporarily increased pro-inflammatory cytokine responses early after infection. During the infection course, expression of IL-5 might be associated with compensatory mechanisms in response to hippocampal alteration in CARD9−/− mice.
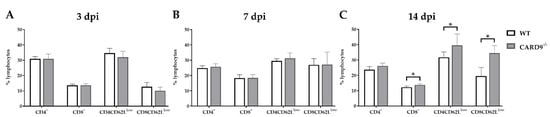
6. CARD9 Deficiency Has a Limited Effect on Initial CD8+ T Cell Responses
Timely peripheral activation and priming of naïve T cells in lymphoid organs during the early phase was shown to be crucial for mounting robust antiviral responses in the TMEV model
[24][25]. To determine whether CARD9 deficiency affects peripheral T cell activation, flow cytometric analysis of spleen tissue has been performed. In agreement with the observed limited effect of CARD9 on the viral brain load, analyses revealed no variations of T cell activation marker expression between CARD9
−/− mice and WT mice at 3 and 7 dpi (
Figure 5A,B). Increased frequencies of splenic CD8
+ T cells, CD4
+CD62L
low and CD8
+CD62
low T cells were detected in CARD9
−/− mice compared to WT mice at 14 dpi (
Figure 5C), probably associated with hippocampal damage and the prolonged CD3
+ T cell responses in the brain determined by immunohistochemistry. Non-infected CARD9
−/− mice showed increased frequencies of splenic CD4
+ and CD8
+ cells compared to WT mice, while no differences in CD4
+CD62L
low and CD8
+CD62
low T cell frequencies were found between both groups under non-infectious conditions (
Figure S7).
Figure 5. Flow cytometric analysis of CD4+ and CD8+ T cell responses. Quantification of CD4+, CD8+, CD4+CD62Llow and CD8+CD62Llow T cells in the spleen of C57BL/6 wild-type (WT) and CARD9−/− mice following Theiler’s murine encephalomyelitis virus (TMEV) infection at (A) 3 days post infection (dpi), (B) 7 dpi and (C) 14 dpi. * Significant difference between WT and CARD9−/− mice (p ≤ 0.05; Mann–Whitney U-test). Three dpi: WT n = 10, CARD9−/− n = 10; 7 dpi: WT n = 10, CARD9−/− n = 9; 14 dpi: WT n = 10, CARD9−/− n = 10. Data are displayed as mean with SD.
Conclusively, data indicate that CARD9 deficiency does not significantly affect T cell priming in peripheral lymphoid organs during the initial phase of TMEV infection.
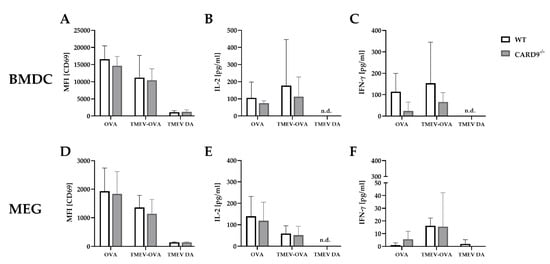
7. CARD9 Deficiency Does Not Affect Antigen Presenting Cells Ability to Prime CD8+ T Cells Following Theiler’s Murine Encephalomyelitis Virus Infection In Vitro
To support the finding of a limited effect of CARD9 deficiency on T cell priming and to test the direct effect of CARD9 deficiency upon antigen presentation, BMDC as professional antigen presenting cells (APC) were utilized in an in vitro stimulation assay. WT and CARD9−/− BMDC were incubated with live TMEV DA at a MOI 200, which had no visible effect on BMDC viability, but is necessary to induce adequate APC-specific effector functions. The presence of the virus led to BMDC activation, indicated by an upregulation of the surface marker CD86 and MHC I and an increased release of inflammatory cytokines IL-6 and IFN-β (Figure S5). No differences in activation marker expression and cytokine production were observed between WT and CARD9−/− BMDCs following activation with TMEV. To analyze the impact of CARD9 deficiency on early TMEV-mediated T cell responses in vitro, a BMDC/T cell and MEG/T cell co-cultivation system was used. OT-I T cells that specifically recognize the OVA257–264 peptide presented via the MHC I molecule H2-Kb were co-cultured with BMDCs or MEGs that had been exposed to TMEV-OVA. In this setting, non-OVA-expressing TMEV DA was utilized as a negative control. To evaluate CD8+ T cell activation, expression of the T cell activation marker CD69 was analyzed by flow cytometry (Figure 6A,D), and cytokine release was measured by ELISA (Figure 6B,C,E,F). Both co-culture systems revealed a TMEV-OVA-mediated increase in CD8+ T cell activation compared to non-OVA expressing TMEV DA exposed cells, indicated by upregulated levels of CD69 as well as an elevated release of IL-2 and IFN-γ (Figure 6B,C,E,F). However, no difference in CD8+ T cell responses between the WT and CARD9−/− group was observed, neither when BMDCs nor when MEGs were used in the co-culture system. Furthermore, the overall CD8+ T cell response following TMEV-OVA incubation of MEGs was comparably low, suggesting that the potential of antigen processing and presentation of microglia is limited compared to BMDCs in vitro.
Figure 6. In vitro CD8+ T cell response following incubation with ovalbumin (OVA), TMEV-OVA and TMEV DA of (A–C) bone-marrow-derived dendritic cells (BMDCs) or (D,F) microglia-enriched glial cell mixtures (MEGs). The mean fluorescence intensity (MFI) of activation marker CD69 gated on CD8+ T cells derived from OT-I mice after co-cultivation with (A) BMDCs or (D) MEGs was analyzed by flow cytometry. ELISA-based analysis of interleukin 2 (IL-2) and interferon γ (IFN-γ) cytokine production following co-cultivation with (B,C) BMDCs or (E,F) MEGs. Statistical analysis was done by Mann–Whitney U-test. Data are displayed as mean with SD. n.d. = not detectable.
In summary, these experiments reveal that TMEV stimulation initiates CD8+ T cell priming by APC-mediated antigen presentation. However, CARD9 deficiency does not alter CD8+ T cell priming in vitro. Combined with the unaltered early T cell responses found in vivo (Figure 6A,B), CARD9 signaling most likely does not substantially contribute to the development of antiviral CD8+ T cell responses against TMEV.
 +1 credit