Submitted Successfully!
To reward your contribution, here is a gift for you: A free trial for our video production service.
Thank you for your contribution! You can also upload a video entry or images related to this topic.
Version Summary Created by Modification Content Size Created at Operation
1 + 3966 word(s) 3966 2021-11-01 07:38:54 |
2 update references and layout -5 word(s) 3961 2021-11-11 04:38:00 |

Video Upload Options

Do you have a full video?

Confirm

Are you sure to Delete?
Cite
If you have any further questions, please contact Encyclopedia Editorial Office.
Zhang, C. Network Analysis of Alzheimer’s Disease. Encyclopedia. Available online: https://encyclopedia.pub/entry/15868 (accessed on 27 July 2024).
Zhang C. Network Analysis of Alzheimer’s Disease. Encyclopedia. Available at: https://encyclopedia.pub/entry/15868. Accessed July 27, 2024.
Zhang, Cheng. "Network Analysis of Alzheimer’s Disease" Encyclopedia, https://encyclopedia.pub/entry/15868 (accessed July 27, 2024).
Zhang, C. (2021, November 10). Network Analysis of Alzheimer’s Disease. In Encyclopedia. https://encyclopedia.pub/entry/15868
Zhang, Cheng. "Network Analysis of Alzheimer’s Disease." Encyclopedia. Web. 10 November, 2021.
Network Analysis of Alzheimer’s Disease
Edit

Alzheimer’s disease (AD) is the most frequently diagnosed neurodegenerative disorder worldwide and the sixth leading cause of death in the United States and is on the rise [1]. The disorder is characterised by amyloid plaques and neurofibrillary tangles; cell loss, vascular damage and dementia follow as a direct result of the vicious cycle of their deposition.  Along with age and family history, inheritance also plays an essential role in the development of AD. Among several genetic risk factors, the APP, PSEN1, PSEN2 had been identified as a causative factor for early-onset AD, the APOE-ε4 allele (encodes a protein that transports cholesterol in the bloodstream) was shown to have a strong impact on late-onset AD. However, studies based on APOE status among different racial and ethnic groups have shown inconsistent results .Despite a number of treatments being approved by the U.S. Food and Drug Administration (FDA), none of those therapeutic strategies can cure the disease . There is strong evidence that early diagnosis and treatment might help to decelerate the progression of the disease and maintain brain function. Therefore, rational development of medical approaches (e.g., sophisticated brain imaging studies and discovery of novel candidate genes, proteins, and other substances in blood or cerebrospinal fluid) are fundamental for better understanding of the molecular factors that contribute to disease progression, and for improving the early diagnosis and treatment decisions.

Alzheimer’s disease gene co-expression network genome-scale metabolic model

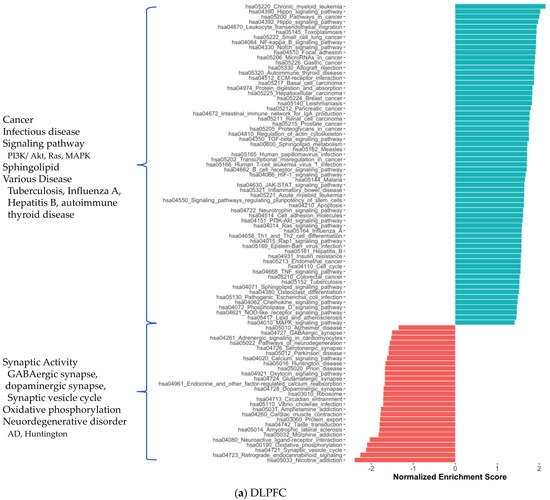
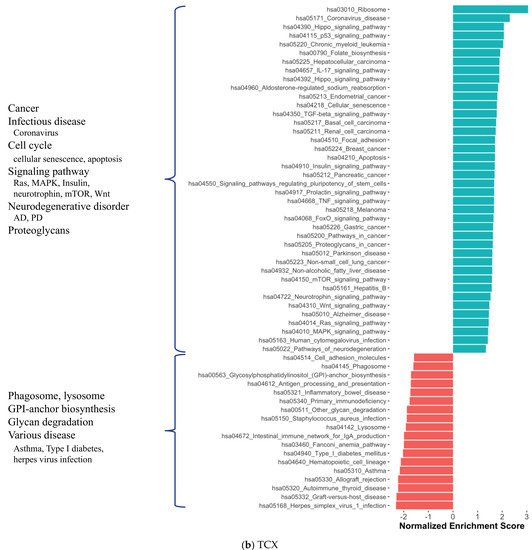
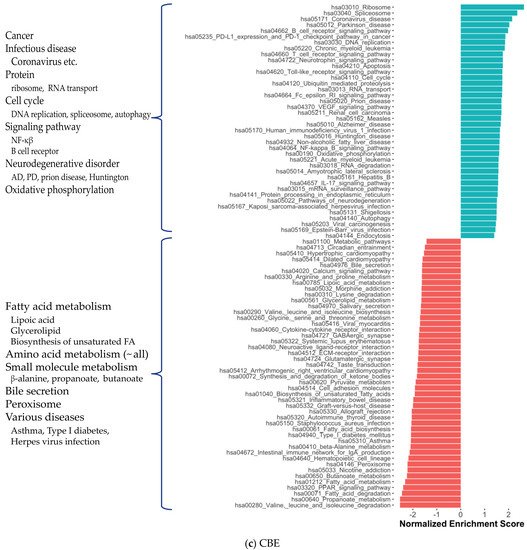
1. Distinct Gene Expression and Functional Profiles in Different Brain Regions of AD

We performed DEA to characterise regional gene expression changes in AD compared to control. We found 2885 differentially expressed genes (DEGs) (1472 up, 1413 down) in dorsolateral later prefrontal cortex (DLPFC), 477 DEGs (205 up, 272 down) in temporal cortex (TCX) and 1515 DEGs (944 up, 571 down) in cerebellum (CBE) regions (Supplementary Dataset S2). The DEGs between each pair of regions were significantly overlapped as showed by the significance of shared DEGs (Table 1), and most of these genes were changed in the same direction (Supplementary Dataset S2). Furthermore, 34 genes were found to be significantly differentially expressed in all three datasets. Interestingly, 33 of these 34 genes were found to be expressed in the same direction and involved in many pathways ranging from secretion to signalling and to cancer-associated pathways (Table 2). We then performed Kyoto Encyclopedia of Genes and Genomes (KEGG) [1] pathways enrichment analysis for the 34 genes as well as overlapped genes between each pair of DEGs from these three datasets to investigate their functional relevance. As a result, we found that these overlapped DEGs are over-represented in many cancer-associated pathways, signalling pathways, cell differentiation and apoptosis (Table 3), suggesting a potential link to cell senescence and cell death.
Table 1. Hypergeometric test results on the intersection of DEGs of datasets found by DESeq2.
VS p-Val (Hyper) Overlap Region_1
DEG Size
Region_2
DEG Size
Both CodingGene Size
RO-MT 0.00054 128 2885 477 14,001
MC-RO 0.00516 347 2885 1515 14,186
MT-MC 9.20599 × 10⁻¹¹ 98 477 1515 14,186
RO: ROSMAP DLPFC, MT: MayoRNAseq TCX, MC: MayoRNAseq CBE. p-val is the p-value of hypergeometric test.
Table 2. Gene symbols of all shared DEGs, synthesised proteins and the most associated KEGG pathways for them. (¥) up-regulated in DLPFC and TCX, down-regulated in CBE, (#) up-regulated in all, (*) down-regulated in all.
Gene Symbol Associated Protein Name (UNIPROT) Most Associated KEGG Pathways
ADAMTS2 ¥ A disintegrin and metalloproteinase with thrombospondin motifs 2 -
ATP1B3 # Sodium/potassium-transporting ATPase subunit beta-3 Secretion (insulin, salivary, bile, gastric acid, pancreatic, aldosterone)
has04961_Endocrine_and_other_factor-regulated_calcium_reabsorption
has04973_Carbohydrate_digestion_and_absorption
has04260_Cardiac_muscle_contraction
has04978_Mineral_absorption
BTG # B-cell translocation gene 1 protein has03018_RNA_degradation
DAXX # Death domain-associated protein 6 has04010_MAPK_signaling_pathway, has04210_Apoptosis, has05012_Parkinson_disease, has05014_Amyotrophic_lateral_sclerosis, has05022_Pathways_of_neurodegeneration, has05168_Herpes_simplex_virus_1_infection
DYNC2LI1 * Cytoplasmic dynein 2 light intermediate chain 1 has04962_Vasopressin-regulated_water_reabsorption, has05132_Salmonella_infection
FAM129B # Protein Niban 2 -
FAM167B # Protein FAM167B -
FAM90A1 * Protein FAM90A1 -
FBXO2 # F-box only protein 2 has04068_FoxO_signaling_pathway,
has04120_Ubiquitin_mediated_proteolysis,
has04141_Protein_processing_in_endoplasmic_reticulum,
has05132_Salmonella_infection
GARNL3 # GTPase-activating Rap/Ran-GAP domain-like protein 3 -
GIT1 # ARF GTPase-activating protein GIT1 has04144_Endocytosis,
has04810_Regulation_of_actin_cytoskeleton,
has05120_Epithelial_cell_signaling_in_Helicobacter_pylori_infection
H2AFV # Histone H2A.V -
HEBP2 # Heme-binding protein 2 -
ID3 # DNA-binding protein inhibitor ID-3 has04350_TGF-beta_signaling_pathway
NHEJ1 # Non-homologous end-joining factor 1 has03450_Non-homologous_end-joining
NT5DC2 # 5’-nucleotidase domain-containing protein 2 -
PAFAH1B3 # Platelet-activating factor acetylhydrolase IB subunit alpha1 has00565_Ether_lipid_metabolism
PLAGL1 * Zinc finger protein PLAGL1 -
RAF1 # RAF proto-oncogene serine/threonine protein kinase CENTRAL
Signaling (JAK/STAT, TNF, VEGF, Insulin, Apelin, cAMP, mTOR etc.)
Cancer (colorectal, pancreatic, breast, glioma, melanoma etc.)
Infection (Hepatitis, Influenza, Tuberculosis, Salmonella etc.)
has04210_Apoptosis,
has04218_Cellular_senescence,
has04510_Focal_adhesion,
has04540_Gap_junction,
has04935_Growth_hormone_synthesis, secretion_and_action
has04726_Serotonergic_synapse, has04510_Focal_adhesion
RALBP1 # RalBP1-associated Eps domain-containing protein 2 has04014_Ras_signaling_pathway, has05212_Pancreatic_cancer
S100A4 # Calvasculin/Metastasin -
S100A6 # Calcyclin/Growth factor-inducible protein 2A9 -
SEPT9 # Septin-9 -
SMAD4 # Mothers against decapentaplegic homolog 4 Signalling (Fox0, Wnt, apelin etc.), Cancer (colorectal etc.)
has04110_Cell_cycle, has04520_Adherens_junction
STARD10 # START domain-containing protein 10 -
STAT5B # Signal transducer and activator of transcription 5B Signalling (AGE-RAGE, JAK/STAT etc.), Myeloid leukemia
has04217_Necroptosis, has04659_Th17_cell_differentiation
TRIM45 * Tripartite motif-containing protein 45 -
TRIM66 * Tripartite motif-containing protein 66 -
TRIP10 # Cdc42-interacting protein 4 has04910_Insulin_signaling_pathway
TTC14 * Tetratricopeptide repeat protein 14 -
UBAP1 # Ubiquitin-associated protein 1 -
UBXN8 * UBX domain-containing protein 8 has04141_Protein_processing_in_endoplasmic_reticulum
ZNF334 * Zinc finger protein 334 has05168_Herpes_simplex_virus_1_infection
ZNF639 # Zinc finger protein 636 -
Table 3. All shared DEGs and associated pathways *.
Pathway Shared DEGs in the Pathway
hsa03450_Non-homologous_end-joining NHEJ1      
hsa04010_MAPK_signaling_pathway DAXX RAF1    
hsa04012_ErbB_signaling_pathway RAF1 STAT5B    
hsa04014_Ras_signaling_pathway RAF1 RALBP1    
hsa04015_Rap1_signaling_pathway RAF1      
hsa04022_cGMP-PKG_signaling_pathway ATP1B3 RAF1    
hsa04024_cAMP_signaling_pathway ATP1B3 RAF1    
hsa04062_Chemokine_signaling_pathway RAF1 STAT5B    
hsa04068_FoxO_signaling_pathway RAF1 SMAD4    
hsa04071_Sphingolipid_signaling_pathway RAF1      
hsa04072_Phospholipase_D_signaling_pathway RAF1      
hsa04150_mTOR_signaling_pathway RAF1      
hsa04151_PI3K-Akt_signaling_pathway RAF1      
hsa04261_Adrenergic_signaling_in_cardiomyocytes ATP1B3      
hsa04210_Apoptosis DAXX RAF1    
hsa04310_Wnt_signaling_pathway SMAD4      
hsa04350_TGF-beta_signaling_pathway ID3 SMAD4    
hsa04370_VEGF_signaling_pathway RAF1      
hsa04371_Apelin_signaling_pathway RAF1 SMAD4    
hsa04390_Hippo_signaling_pathway SMAD4      
hsa04550_Signaling_pathways_regulating_pluripotency_of_stem_cells RAF1 ID3 SMAD4  
hsa04625_C-type_lectin_receptor_signaling_pathway RAF1      
hsa04630_JAK-STAT_signaling_pathway RAF1 STAT5B    
hsa04659_Th17_cell_differentiation SMAD4 STAT5B    
hsa04660_T_cell_receptor_signaling_pathway RAF1      
hsa04662_B_cell_receptor_signaling_pathway RAF1      
hsa04664_Fc_epsilon_RI_signaling_pathway RAF1      
hsa04722_Neurotrophin_signaling_pathway RAF1      
hsa04910_Insulin_signaling_pathway RAF1 TRIP10    
hsa04912_GnRH_signaling_pathway RAF1      
hsa04915_Estrogen_signaling_pathway RAF1      
hsa04917_Prolactin_signaling_pathway RAF1 STAT5B    
hsa04919_Thyroid_hormone_signaling_pathway RAF1 ATP1B3    
hsa04921_Oxytocin_signaling_pathway RAF1      
hsa04926_Relaxin_signaling_pathway RAF1      
hsa04933_AGE-RAGE_signaling_pathway_in_diabetic_complications SMAD4 STAT5B    
hsa04935_Growth_hormone_synthesis,_secretion_and_action RAF1 STAT5B    
hsa05120_Epithelial_cell_signaling_in_Helicobacter_pylori_infection GIT1      
hsa05161_Hepatitis_B RAF1 SMAD4 STAT5B  
hsa05200_Pathways_in_cancer RAF1 RALBP1 SMAD4 STAT5B
hsa05210_Colorectal_cancer RAF1 SMAD4    
hsa05212_Pancreatic_cancer RAF1 RALBP1 SMAD4  
hsa05213_Endometrial_cancer RAF1      
hsa05215_Prostate_cancer RAF1      
hsa05219_Bladder_cancer RAF1      
hsa05220_Chronic_myeloid_leukemia RAF1 SMAD4 STAT5B  
hsa05221_Acute_myeloid_leukemia RAF1 STAT5B    
hsa05223_Non-small_cell_lung_cancer RAF1 STAT5B    
hsa05224_Breast_cancer RAF1      
hsa05226_Gastric_cancer RAF1 SMAD4    
* Pathways in which shared DEGs are present significantly based on hypergeometric test. bold: signalling pathways and cancer-associated pathways.
We also investigated the functional profiles of DEGs from each brain region using the KEGG pathway and Gene Ontology (GO) [2] term enrichment analysis (Figure 1). Most generally, we found that the cancer pathways were enriched in DEGs of all three regions, while anabolic reactions, e.g., oxidative phosphorylation and amino acid biosynthesis, and synaptic activity tended to diminish. As we mentioned above, all shared DEGs were associated with many pathways enriched with DEGs from brain tissues (Figure S5a,b). The reduction in GABAergic and glutamatergic synapse pathways in CBE is consistent with our knowledge of the GABAergic and glutamatergic neuron loss in AD. We observed reduced oxidative phosphorylation, small molecule metabolism (pyruvate, butanoate, propanoate, beta-alanine, fatty acid) and amino acid degradation (valine, leucine, isoleucine, lysine) that reflects crucial AD-associated changes in brain metabolism. Supported by the literature, the enrichment of HIV-1 infection [3][4] and hepatitis B infection [5] associated pathways, NF-κβ [6][7], VEGF [8] and toll-like receptor signalling [9] pathways, diminishment of peroxisome [10][11] and morphine addiction [12] associated pathways in CBE was found among interesting AD-associated abnormalities. We also observed a reduction in the retrograde endocannabinoid signalling pathway [13] and nicotine addiction [14] associated pathway in DLPFC and CBE. All significant KEGG enrichments are presented in Supplementary Dataset S3.
Figure 3. Significantly enriched KEGG pathways for protein-coding genes in DLPFC, TCX and CBE.
In parallel, DLPFC and CBE showed abundant GO term enrichment. Cytoskeleton organisation (e.g., actin cytoskeleton organisation), GTPase activity, cell membrane–linked signalling pathways and associated processes (e.g., G protein-coupled receptor signalling pathway, neurotransmitter transport, glutamate receptor signalling pathway) and angiogenesis (e.g., blood vessel morphogenesis, epithelial cell differentiation) were enriched significantly in DLPFC data. We also found the enrichment for cytoskeleton, neuronal regions and respective molecular activity (e.g., microtubule-binding, cadherin binding, Rho GTPase binding) (Figure S6a–c). These enriched pathways indicate changes supporting cholinergic signalling and vascularisation. The enriched pathways in the CBE dataset were similar but scarce compared to DLPFC results (Figure S6d–f). GO enrichment analysis did not yield any significant results for TCX data.

2. Co-Expression Network Analysis in Different Brain Regions of AD

We also constructed region-specific co-expression networks to investigate functional gene modules (See methods). We identified one large module for DLPFC (node size = 2034), one large module for TCX (node size = 2422) and 11 modules for CBE (total node size = 574) complying given size and connectivity criteria. Even though the centrality measurement was not as dramatic as in DLPFC and TCX modules (Supplementary Dataset S4), the 11 modules for CBE were merged as one module gene group for analyses hereafter as they have high connectivity (Supplementary Dataset S5). We also observed significant and consistent overlap between modules from different datasets (Supplementary Dataset S5). Then we investigated the association between the DEGs that we identified in different brain regions and the genes involved in each module. We found that the identified modules were overlapped with the down-regulated DEGs from their respective region, suggesting that down-regulated genes in these regions follow a similar regulation pattern. We also generated a merged set of down-regulated genes (n = 1975) which were significant in at least one dataset based on DEA for studying AD changes in general. We found that each module contains nearly one-third of all identified down-regulated DEGs (609 in DLPFC module, 798 in TCX module, 184 in merged CBE module) and a modest amount of these genes were hub genes in the modules (86 in DLPFC module, 89 in TCX module, 17 in merged CBE module). Modules that we determined were then annotated for a list of numerous biological processes and molecular functions, ranging from amino acid biosynthesis to vesicular transport. We classified these annotations into energy metabolism and synaptic activity as shown in the figures (Figure 4, Figure S7a–i).
Figure 4. Functional enrichment of significant modules determined from co-expression network by random walk algorithm. M8 (n = 2034), the single module from DLPFC, and M11 (n = 2422), the single module from TCX, were enriched for nearly all metabolic pathways partly due to their size. For instance, genes involved in vitamin, glycan and leukotriene metabolisms were abundant specifically for M8 and M11. Nevertheless, oxidative phosphorylation was the only significant enrichment for both modules (hypergeometric p-value 0.00034 and 0.00054). Aminoacyl t-RNA metabolism was enriched significantly (hypergeometric p-value < 0.0476) for M8 genes. Whereas some CBE modules (M57, M90, M195 and M244) were not enriched for any given annotation, others shared genes associated with synaptic activity and energy metabolism.
We then investigated the status of genes related to amyloid and tau hypotheses in modules and differential expression analysis. These are comprised of genes responsible for amyloid precursor protein (APP) synthesis and catabolism down to Aβ (i.e., APP, BACE1, PSEN1, PSEN2, NCSTN, ADH1 and ADAM10) and tau synthesis (i.e., MAPT). Only two genes, APP and PSEN2, were found in our modules, DLPFC and TCX, and they were down-regulated in these datasets. Despite not being in the modules, significantly changed expression of MAPT (down) and ADAM10 (up) in DLPFC were noteworthy.
We detected two hub genes shared in DLPFC, TCX and CBE modules: GPRASP2 and AMIGO1. GPRASP2 is a G-protein coupled receptor (GPCR) regulator. It facilitates endocytosis of GPCRs from the plasma membrane to lysosomes for degradation [15]. AMIGO1 is important for the growth of neurites and may contribute to the myelination of neural axons [16]. AMIGO1 and GPRASP1, which come from the same protein family of GPRASP2, are significantly down-regulated in DLPFC. Notably, GPRASP2 is also down-regulated with bolder line significance (adjusted p-value in DLPFC = 0.0568). According to Brain Atlas data on Human Protein Atlas (HPA) [17], GPRASP2 has relatively high expression levels in brain tissues overall compared to other tissues (https://www.proteinatlas.org/ENSG00000158301-GPRASP2/tissue. Accessed 5 May 2021). There is a 10–15% decrease in the expression of GPRASP2 in all datasets. We also observed 5% down-regulation in DLPFC, a 10% decrease in CBE and nearly no change in TCX for AMIGO1. Still, these small changes may be critical considering that AMIGO1’s highest expression is in the cerebral cortex and cerebellum among all tissues (https://www.proteinatlas.org/ENSG00000181754-AMIGO1/tissue. Accessed 5 May 2021).
Moreover, other shared hub genes among two datasets include PAK1 in CBE and DLPFC, ATP6V1E1, CDC42, DCTN2, ERLEC1 and MPP1 in CBE and TCX, and 86 other genes between DLPFC and TCX. These genes are mostly associated with glucose-dependent energy metabolism, ubiquitin-proteasome system (UPS), synaptic activity and plasticity, cytoskeleton organisation as well as intra-golgi and retrograde golgi to endoplasmic reticulum traffic.

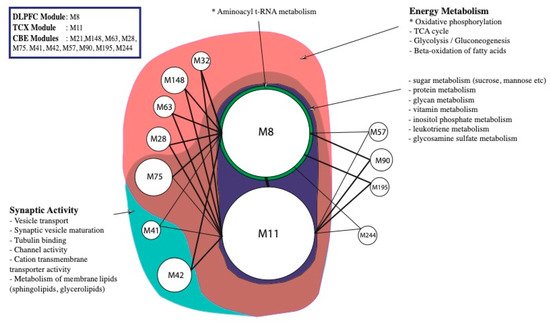
3. Alterations in Energy Metabolism, Chaperones and Synaptic Activity

Based on the network analysis and DEA results, we found a wide change in energy metabolism, chaperones and synaptic activity. Regarding the energy metabolism, we found a batch of ATPase genes that are responsible for ATP catalysis and solute carrier family genes which are responsible for the transport of ATP and its substrates through membranes were affected. ATP1B3 encodes non-catalytic β-3 subunit of ATPase Na+/K+ transporting enzyme, which is one of the shared DEGs and expressed 15–40% higher in all AD tissues. ATPAF1, which encodes ATP synthase mitochondrial F1 complex assembly factor, and 15 ATPase cation transporting subunit encoding genes (mostly H+, one Na+/K+ and one plasma membrane Ca+2 transporting), were significantly down-regulated in DLPFC. ATP1B2, ATP1A3, ATP13A4 and ATP6V0C were significantly up-regulated in CBE. There were no significant expression changes in ATPases in TCX other than ATP1B3. The expression of the hub genes ATP6V1A and ATP6V1B2 shared by DLPFC and TCX, and ATP6V1E1 shared by DLPFC and CBE were not significantly changed. Solute carrier family member genes SLC9A6, SLC25A4 and SLC25A14 were shared by the DLPFC and TCX, but their expression was not significantly changed (Table 4). In addition, we found some solute carrier genes showed different expression patterns associated with AD. SLC25A30, SLC7A2 and SLCO4A1 were up-regulated in DLPFC and TCX; SLC6A12, SLC38A2 and SLC9A3R2 were up-regulated and SLC16A6 was down-regulated in DLPFC and CBE; SLC9A3 was down-regulated in TCX and CBE (Supplementary Dataset S2). These results suggest that the expression of many genes associated with energy production were changed in AD and these genes were mostly up-regulated.
Table 4. Hub genes shared by modules from different tissues and most associated ontologies.
Tissues Hub Genes (Top 10%)
DLPFC, TCX, CBE AMIGO1, GPRASP2
DLPFC, TCX Cytoskeleton and its organisation
ACTR3B, GABARAPL1, MARK1, NDEL1
Synaptic activity/plasticity
AP2M1, ARHGEF9, CALM3, DLG3, GABRB3, L1CAM, NPTN
Intra Golgi and retrograde Golgi-to-ER traffic
AP3M2, ARF3, CFAP36, KIFAP3, KLC1, NAPB, NSF, RAB6B
Ubiquitin/Proteasome System
DNAJC5, HSPA12A
Glucose Metabolism/Oxidative phosphorylation
ATP6V1A, ATP6V1B2, HK1, SEH1L, SLC25A14, SLC25A4, SLC9A6
Other
ATL1, B4GAT1, BTRC, C1orf216, CDK14, CDK5R1CHN1, CISD1, CLSTN3, CNTNAP1, EID2, FAM234B, FAM49A, GLS, GOT1, GPI, GUCY1B3, INPP4A, JAZF1, MAGEE1, MAPK9, MLTT11, MOAP1, MYCBP2, NDFIBP1, NDRG3, NELL2, NMNAT2, OPCML, PCMT1, PFN2, PHACTR1, PNMA2, PNMAL1, PPPIR7, PPP3CB, PPP3R1, PREP, PREPL, PRKCE, RBFOX2, REEP1, REEP5, RTN3, SEPT6, SMAP2, SNAP91, SV2B, SYT13, TMEM246, TSPYL1, UBE2O, UBFD1, VDAC1, VDAC3, WDR7, YWHAG, YWHAZ
TCX, CBE Cytoskeleton and its organisation
PAK1
DLPFC, CBE Glucose Metabolism/Oxidative phosphorylation
ATP6V1E1
Cytoskeleton and its organisation
CDC42, DCTN2
Other
ERLEC1, MPP1
Chaperone proteins, also known as heat shock proteins (HSPs), are crucial for proteostasis. Chaperones can be divided into two large families in eukaryotes: the Hsp70 family (gene symbols: HSPs) and the Hsp40 family (gene symbols: DNAJs). According to our findings, HSPA12A and DNAJC5 showed higher centrality in DLPFC and TCX than other HSPs (Table 4). Seven members of the DNAJ C subfamily were significantly down-regulated in DLPFC but not in TCX. The other three DNAJ genes were significantly up-regulated in CBE. Seven members of HSPs had changes in DLPFC, whereas three other HSP genes were significantly up-regulated in TCX. There are few interactions between HSPs and other proteins. DNAJC30 encodes a mitochondrial protein that is enriched in neurons and regulates mitochondrial respiration. This protein interacts with a mitochondrial rRNA methyltransferase encoded by MRM1, which has lower expression in DLPFC AD samples. It was reported that MRM1 catalysed methyltransferase which is important for the mitoribosome assembly and synthesis of electron transport chain submits [18]. In addition, our findings show us an interaction between DNAJC30 and RNF170 proteins. RNF170 was down-regulated in all tissues, especially in TCX. A strong association of RNF170 and active inositol 1,4,5-trisphosphate (IP3) receptors—the former mediates the ubiquitination of the latter—was shown in an animal proteomics study [19]. IP3 receptors are located on the endoplasmic reticulum as calcium channels and are degraded by UPS upon activation. HSP90B1 interacts with SGTB on the protein level, which is a co-chaperone and regulates Hsp70 ATPase activity. Both HSP90B1 and SGTB were down-regulated in DLPFC.
We also observed a wide dysregulation of synapse-associated genes in AD. The results showed that more than a third of synaptic genes were differentially altered (mostly down-regulated) in DLPFC and CBE tissues for each synapse type. Of 27 genes shared in all synapse types, two genes, GNG12 and GNGT2, were up-regulated in DLPFC, while seven genes, namely GNG2, GNG3, GNG4, GNB5, CACNA1D, PRKACA and PRKCG, were down-regulated. GNB4 and CACNA1D were down-regulated in CBE. We found eight synaptic activity-associated genes (AP2M1, ARHGEF9, CALM3, DLG3, GABRB3, L1CAM, NPTN and NSF) which interact with other DEGs on protein level and these genes were shared in DLPFC and TCX modules. Most of these genes were down-regulated in DLPFC except for L1CAM and NSF. AP2M1 encodes a subunit of assembly protein complex 2, which is crucial for the acidification of endosomes and lysosomes through proton pumping. CALM3 encodes calmodulin, which is critical for synaptic activity since it mediates voltage-dependent calcium channels [20][21]. Calmodulin also takes part in a protein kinase complex, CaMKIIα, and is critical for learning and memory [22]. The protein encodes by DLG3 interacts with NMDA receptor subunits at the synapse; thus, it is required for synaptic plasticity and learning [23]. General down-regulation of synaptic activity associated genes both in DLPFC and CBE implies that the cholinergic hypothesis is more plausible to explain AD in our case. CREB3, a member of cholinergic and dopaminergic synapses is significantly up-regulated in TCX.

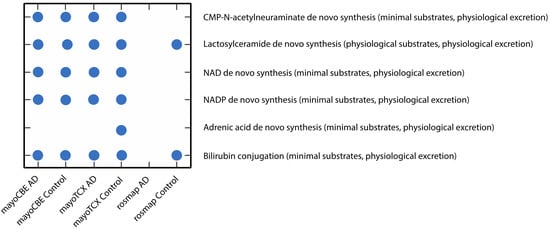
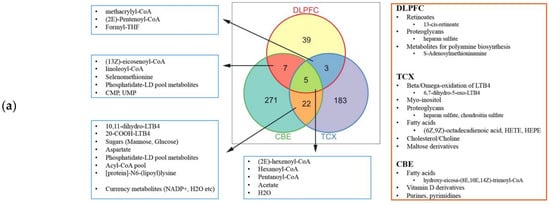
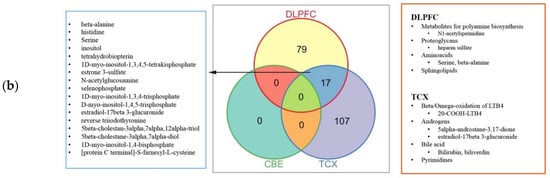
2.4. Metabolic Alterations in Different Brain Regions of AD
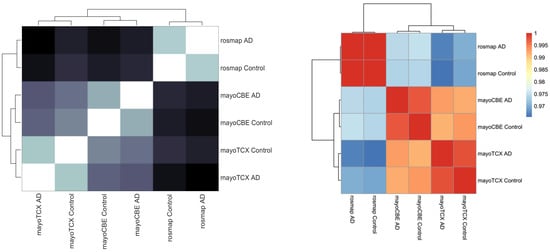
To investigate the metabolic alterations in different regions in AD, we performed the GEM analyses. First, we reconstructed the region-specific GEM based on the transcriptomic profiles of each region in the brain. Numbers of reactions, metabolites and genes for each GEM are given in Table 5. Region-specific GEM construction allows us to understand the changes in the activity of metabolites, reactions, subsystems/pathways and metabolic functions/tasks. In terms of reactions, all groups showed a great similarity (≥95%); however, groups from the same brain region compared to other groups had a higher similarity. Group correlations based on gene expressions supported this finding (Figure 2). DLPFC groups were more distinct from others, as we observed in previous analyses. We analysed the metabolic tasks (Figure 3) and the differentially active pathways (Figure 4) by comparing GEMs to enhance our understanding of functional changes in AD from plausible metabolite perturbations. Metabolic tasks were mostly different in DLPFC. Lactosylceramide de novo biosynthesis (a class of glycosphingolipid) and bilirubin conjugation failed in the AD DLPFC group, while they were modelled to be performed successfully in the control DLPFC group. NAD, NADP, adrenic acid and CMP-N-acetylneuraminate (CMP-Neu5Ac) de novo biosynthesis failed in both DLPFC groups. Adrenic acid biosynthesis also failed in other groups apart from the control TCX group; hence, its failure is more likely linked to aging rather than AD [24].
Figure 2. Group comparisons in terms of reaction content and gene expressions. (left) Comparison of GEMs based on reaction content showed in heatmap of Hamming distances and dendrogram. (right) Comparison of groups based on gene expressions showed in heatmap of Spearman correlations of mean TPMs and dendrogram.
Figure 3. Scatter plot of metabolic tasks succeeded or failed differently in at least one GEM.
Figure 4. Heatmap for metabolic pathways expressed at least 10% differently in one group of samples. Each colour tone closer to blood-red refers to 10% increase compared to other metabolic pathways, while each colour tone closer to deep blue 10% decrease compared to other metabolic pathways.
Table 5. Descriptive statistics of GEMs.
  DLPFC-AD DLPFC-Control TCX-AD TCX-Control CBE-AD CBE-Control
Number of Reactions 5727 5773 5895 5845 5898 5826
Number of Metabolites 4529 4593 4588 4541 4603 4542
Number of Genes 2494 2516 2632 2615 2585 2592
Regional differences in subsystem activities were remarkable. A drastic decrease in lacto-glycosphingolipid biosynthesis, lipoic acid metabolism, O-glycan metabolism, pentose and glucuronate interconversions, blood group biosynthesis and protein assembly were exclusively founded in the DLPFC group. Interestingly, O-glycan metabolism and pentose and glucuronate interconversions were increased in TCX but decreased in DLPFC. In addition, we observed a weak increase in propanoate metabolism, histidine metabolism and protein modification and a decrease in β-alanine metabolism and serotonin and melatonin biosynthesis in TCX. Different from other tissues, CBE samples showed higher activity of linoleate, retinol, xenobiotics and tryptophan metabolisms. In addition, serotonin and melatonin biosynthesis and propanoate metabolism were decreased in CBE but increased in TCX.
Then we performed the report metabolites analysis based on the result of differentially expressed analysis (Datasets S6–8). With the use of only down-regulated genes, we observed the significant changes in the three medium-chain fatty acids (pentanoyl-CoA, hexanoyl-CoA, (2E)-hexenoyl-CoA), acetate and H2O for all tissues (Figure 5). We observed that fatty acids were abundant in control groups for all three tissues, suggesting a general decrease in fatty acids including adrenic acid. The lower abundance of (R)-3-hydroxybutanoate in DLPFC was noteworthy, since its importance for feeding neurons from astrocytes. Histidine was reported based on the up-regulated genes in TCX, which aligns with its lower metabolism. Retinoates were reported based on the down-regulated genes in DLPFC. Cholesterol, choline and maltose derivatives were reported based on the down-regulated genes in TCX. Vitamin D derivatives and metabolites responsible for the oxidation of leukotriene B4 (LTB4) were reported based on the down-regulated genes in CBE. LTB associated metabolites were reported based on the up- and down-regulated genes in TCX, implying an interplay. Similarly, proteoglycans were reported based on the up and down-regulated genes in DLPFC. Proteoglycan enrichments were opposing (enriched hsa05205_Proteoglycans_in_cancer and decreased O-glycan metabolism), suggesting that they may cover a different set of genes. CMP and CMP-Neu5Ac were reported based on the down-regulated genes in DLPFC, while CMP-Neu5Ac synthesis showed to be failed in the tissue.
Figure 5. Reporter metabolites for: (a) down-regulated genes; and (b) up-regulated genes.

References

  1. Levine, A.J.; Miller, J.A.; Shapshak, P.; Gelman, B.; Singer, E.J.; Hinkin, C.H.; Commins, D.; Morgello, S.; Grant, I.; Horvath, S. Systems analysis of human brain gene expression: Mechanisms for HIV-associated neurocognitive impairment and common pathways with Alzheimer’s disease. BMC Med. Genom. 2013, 6, 4.
  2. Borjabad, A.; Volsky, D.J. Common transcriptional signatures in brain tissue from patients with HIV-associated neurocognitive disorders, Alzheimer’s disease, and Multiple Sclerosis. J. Neuroimmune Pharmacol. 2012, 7, 914–926.
  3. Mastroeni, D.; Nolz, J.; Sekar, S.; Delvaux, E.; Serrano, G.; Cuyugan, L.; Liang, W.S.; Beach, T.G.; Rogers, J.; Coleman, P.D. Laser-captured microglia in the Alzheimer’s and Parkinson’s brain reveal unique regional expression profiles and suggest a potential role for hepatitis B in the Alzheimer’s brain. Neurobiol. Aging 2018, 63, 12–21.
  4. Cardoso, S.M.; Oliveira, C.R. Inhibition of NF-kB renders cells more vulnerable to apoptosis induced by amyloid beta peptides. Free Radic. Res. 2003, 37, 967–973.
  5. Zhao, Y.; Bhattacharjee, S.; Jones, B.M.; Hill, J.; Dua, P.; Lukiw, W.J. Regulation of neurotropic signaling by the inducible, NF-kB-sensitive miRNA-125b in Alzheimer’s disease (AD) and in primary human neuronal-glial (HNG) cells. Mol. Neurobiol. 2014, 50, 97–106.
  6. Religa, P.; Cao, R.; Religa, D.; Xue, Y.; Bogdanovic, N.; Westaway, D.; Marti, H.H.; Winblad, B.; Cao, Y. VEGF significantly restores impaired memory behavior in Alzheimer’s mice by improvement of vascular survival. Sci. Rep. 2013, 3, 2053.
  7. Gambuzza, M.E.; Sofo, V.; Salmeri, F.M.; Soraci, L.; Marino, S.; Bramanti, P. Toll-like receptors in Alzheimer’s disease: A therapeutic perspective. CNS Neurol. Disord. Drug Targets 2014, 13, 1542–1558.
  8. Kou, J.; Kovacs, G.G.; Höftberger, R.; Kulik, W.; Brodde, A.; Forss-Petter, S.; Hönigschnabl, S.; Gleiss, A.; Brügger, B.; Wanders, R.; et al. Peroxisomal alterations in Alzheimer’s disease. Acta Neuropathol. 2011, 122, 271–283.
  9. Jiang, Q.; Heneka, M.; Landreth, G.E. The role of peroxisome proliferator-activated receptor-gamma (PPARgamma) in Alzheimer’s disease: Therapeutic implications. CNS Drugs 2008, 22, 1–14.
  10. Gawel, K.; Labuz, K.; Jenda, M.; Silberring, J.; Kotlinska, J.H. Influence of cholinesterase inhibitors, donepezil and rivastigmine on the acquisition, expression, and reinstatement of morphine-induced conditioned place preference in rats. Behav. Brain Res. 2014, 268, 169–176.
  11. Klionsky, D.J.; Abdelmohsen, K.; Abe, A.; Abedin, M.J.; Abeliovich, H.; Arozena, A.A.; Adachi, H.; Adams, C.M.; Adams, P.D.; Adeli, K.; et al. Guidelines for the use and interpretation of assays for monitoring autophagy (3rd edition). Autophagy 2016, 12, 1–222.
  12. Feigin, V.L.; Nichols, E.; Alam, T.; Bannick, M.S.; Beghi, E.; Blake, N.; Culpepper, W.J.; Dorsey, E.R.; Elbaz, A.; Ellenbogen, R.G.; et al. Global, regional, and national burden of neurological disorders, 1990–2016: A systematic analysis for the Global Burden of Disease Study 2016. Lancet Neurol. 2019, 18, 459–480.
  13. Manavalan, A.; Mishra, M.; Sze, S.K.; Heese, K. Brain-site-specific proteome changes induced by neuronal P60TRP expression. Neurosignals 2013, 21, 129–149.
  14. Dagley, L.F.; Croft, N.P.; Isserlin, R.; Olsen, J.B.; Fong, V.; Emili, A.; Purcell, A.W. Discovery of novel disease-specific and membrane-associated candidate markers in a mouse model of multiple sclerosis. Mol. Cell. Proteom. 2014, 13, 679–700.
  15. Lee, K.W.; Bogenhagen, D.F. Assignment of 2’-O-methyltransferases to modification sites on the mammalian mitochondrial large subunit 16 S ribosomal RNA (rRNA). J. Biol. Chem. 2014, 289, 24936–24942.
  16. Lu, J.P.; Wang, Y.; Sliter, D.A.; Pearce, M.M.P.; Wojcikiewicz, R.J.H. RNF170 Protein, an Endoplasmic Reticulum Membrane Ubiquitin Ligase, Mediates Inositol 1,4,5-Trisphosphate Receptor Ubiquitination and Degradation *. J. Biol. Chem. 2011, 286, 24426–24433.
  17. Striessnig, J.; Pinggera, A.; Kaur, G.; Bock, G.; Tuluc, P. L-type Ca2+ channels in heart and brain. Wiley Interdiscip. Rev. Membr. Transp. Signal. 2014, 3, 15–38.
  18. Wren, L.M.; Jiménez-Jáimez, J.; Al-Ghamdi, S.; Al-Aama, J.Y.; Bdeir, A.; Al-Hassnan, Z.N.; Kuan, J.L.; Foo, R.Y.; Potet, F.; Johnson, C.N.; et al. Genetic Mosaicism in Calmodulinopathy. Circ. Genom. Precis. Med. 2019, 12, 375–385.
  19. Sosanya, N.M.; Cacheaux, L.P.; Workman, E.R.; Niere, F.; Perrone-Bizzozero, N.I.; Raab-Graham, K.F. Mammalian Target of Rapamycin (mTOR) Tagging Promotes Dendritic Branch Variability through the Capture of Ca2+/Calmodulin-dependent Protein Kinase II α (CaMKIIα) mRNAs by the RNA-binding Protein HuD. J. Biol. Chem. 2015, 290, 16357–16371.
  20. Paoletti, P.; Bellone, C.; Zhou, Q. NMDA receptor subunit diversity: Impact on receptor properties, synaptic plasticity and disease. Nat. Rev. Neurosci. 2013, 14, 383–400.
  21. Pamplona, R.; Borras, C.; Jové, M.; Pradas, I.; Ferrer, I.; Viña, J. Redox lipidomics to better understand brain aging and function. Free Radic. Biol. Med. 2019, 144, 310–321.
  22. Mattson, M.P.; Moehl, K.; Ghena, N.; Schmaedick, M.; Cheng, A. Intermittent metabolic switching, neuroplasticity and brain health. Nat. Rev. Neurosci. 2018, 19, 81–94.
  23. Papuć, E.; Rejdak, K. The role of myelin damage in Alzheimer’s disease pathology. Arch. Med. Sci. 2018, 16, 345–351.
  24. Alessenko, A.V.; Albi, E. Exploring Sphingolipid Implications in Neurodegeneration. Front. Neurol. 2020, 11, 437.
More
Information
Subjects: Physiology
Contributor MDPI registered users' name will be linked to their SciProfiles pages. To register with us, please refer to https://encyclopedia.pub/register :
View Times: 538
Revisions: 2 times (View History)
Update Date: 11 Nov 2021
1000/1000
Video Production Service