
| Version | Summary | Created by | Modification | Content Size | Created at | Operation |
|---|---|---|---|---|---|---|
| 1 | Kazunari Ozasa | + 3242 word(s) | 3242 | 2021-09-30 09:38:19 |
Video Upload Options
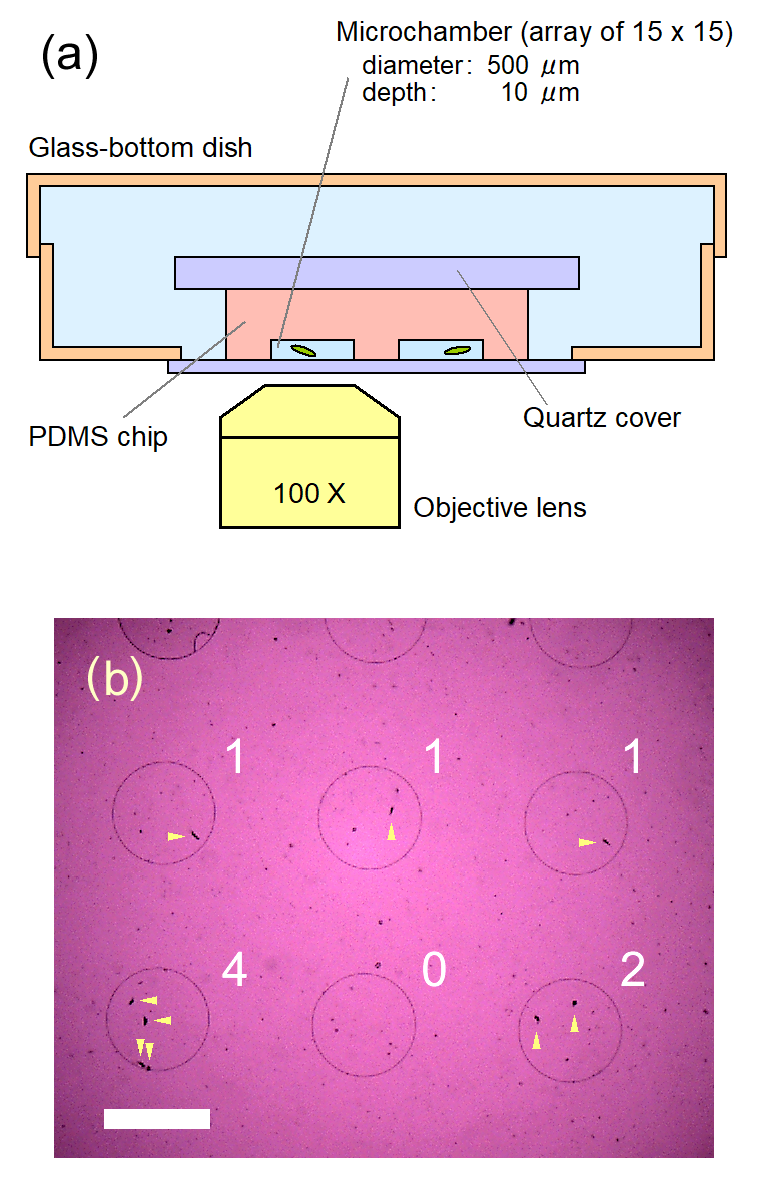
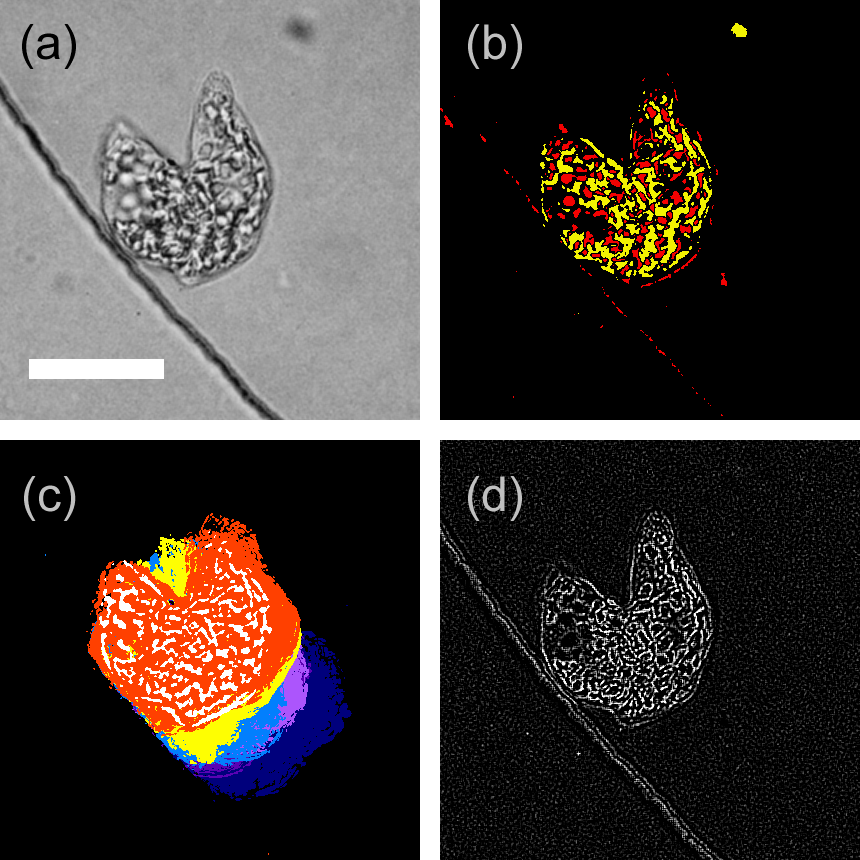
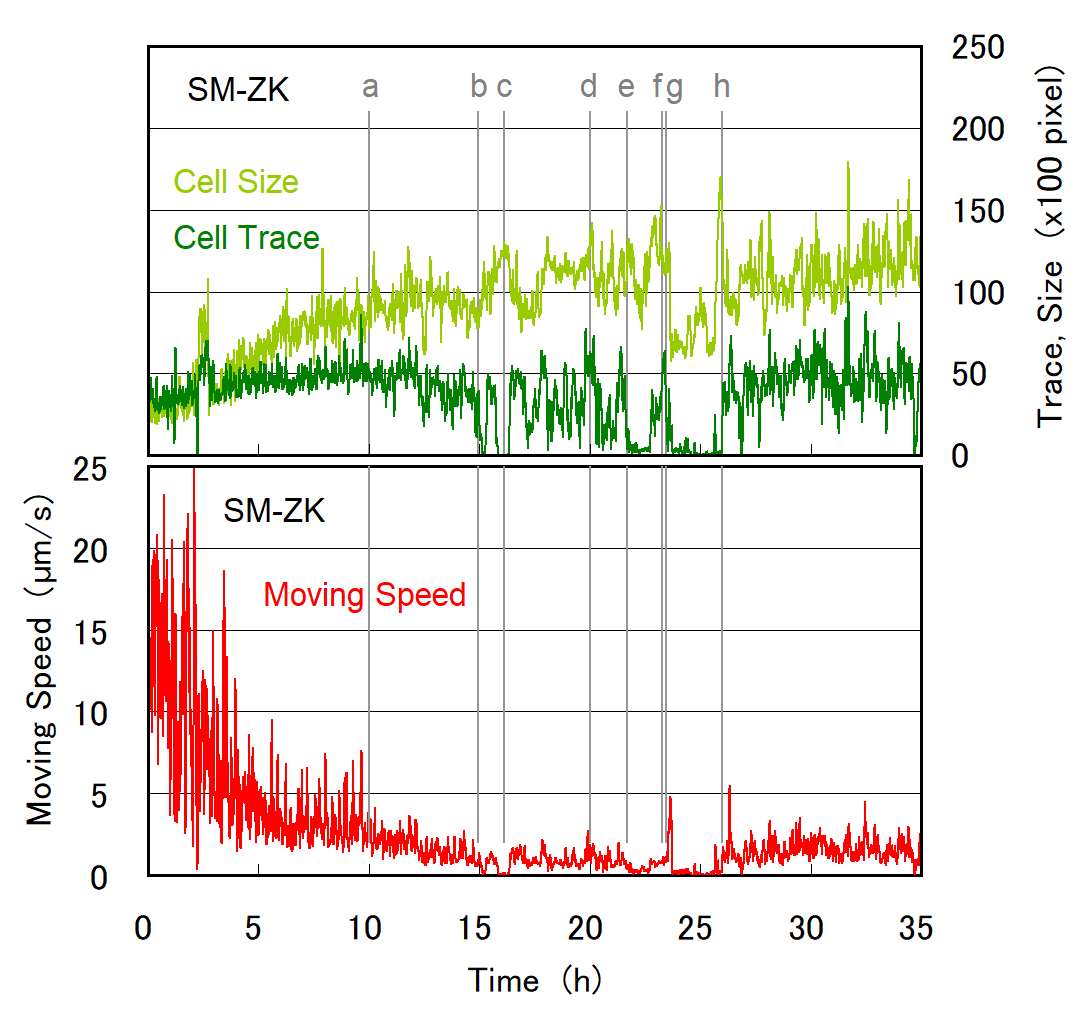
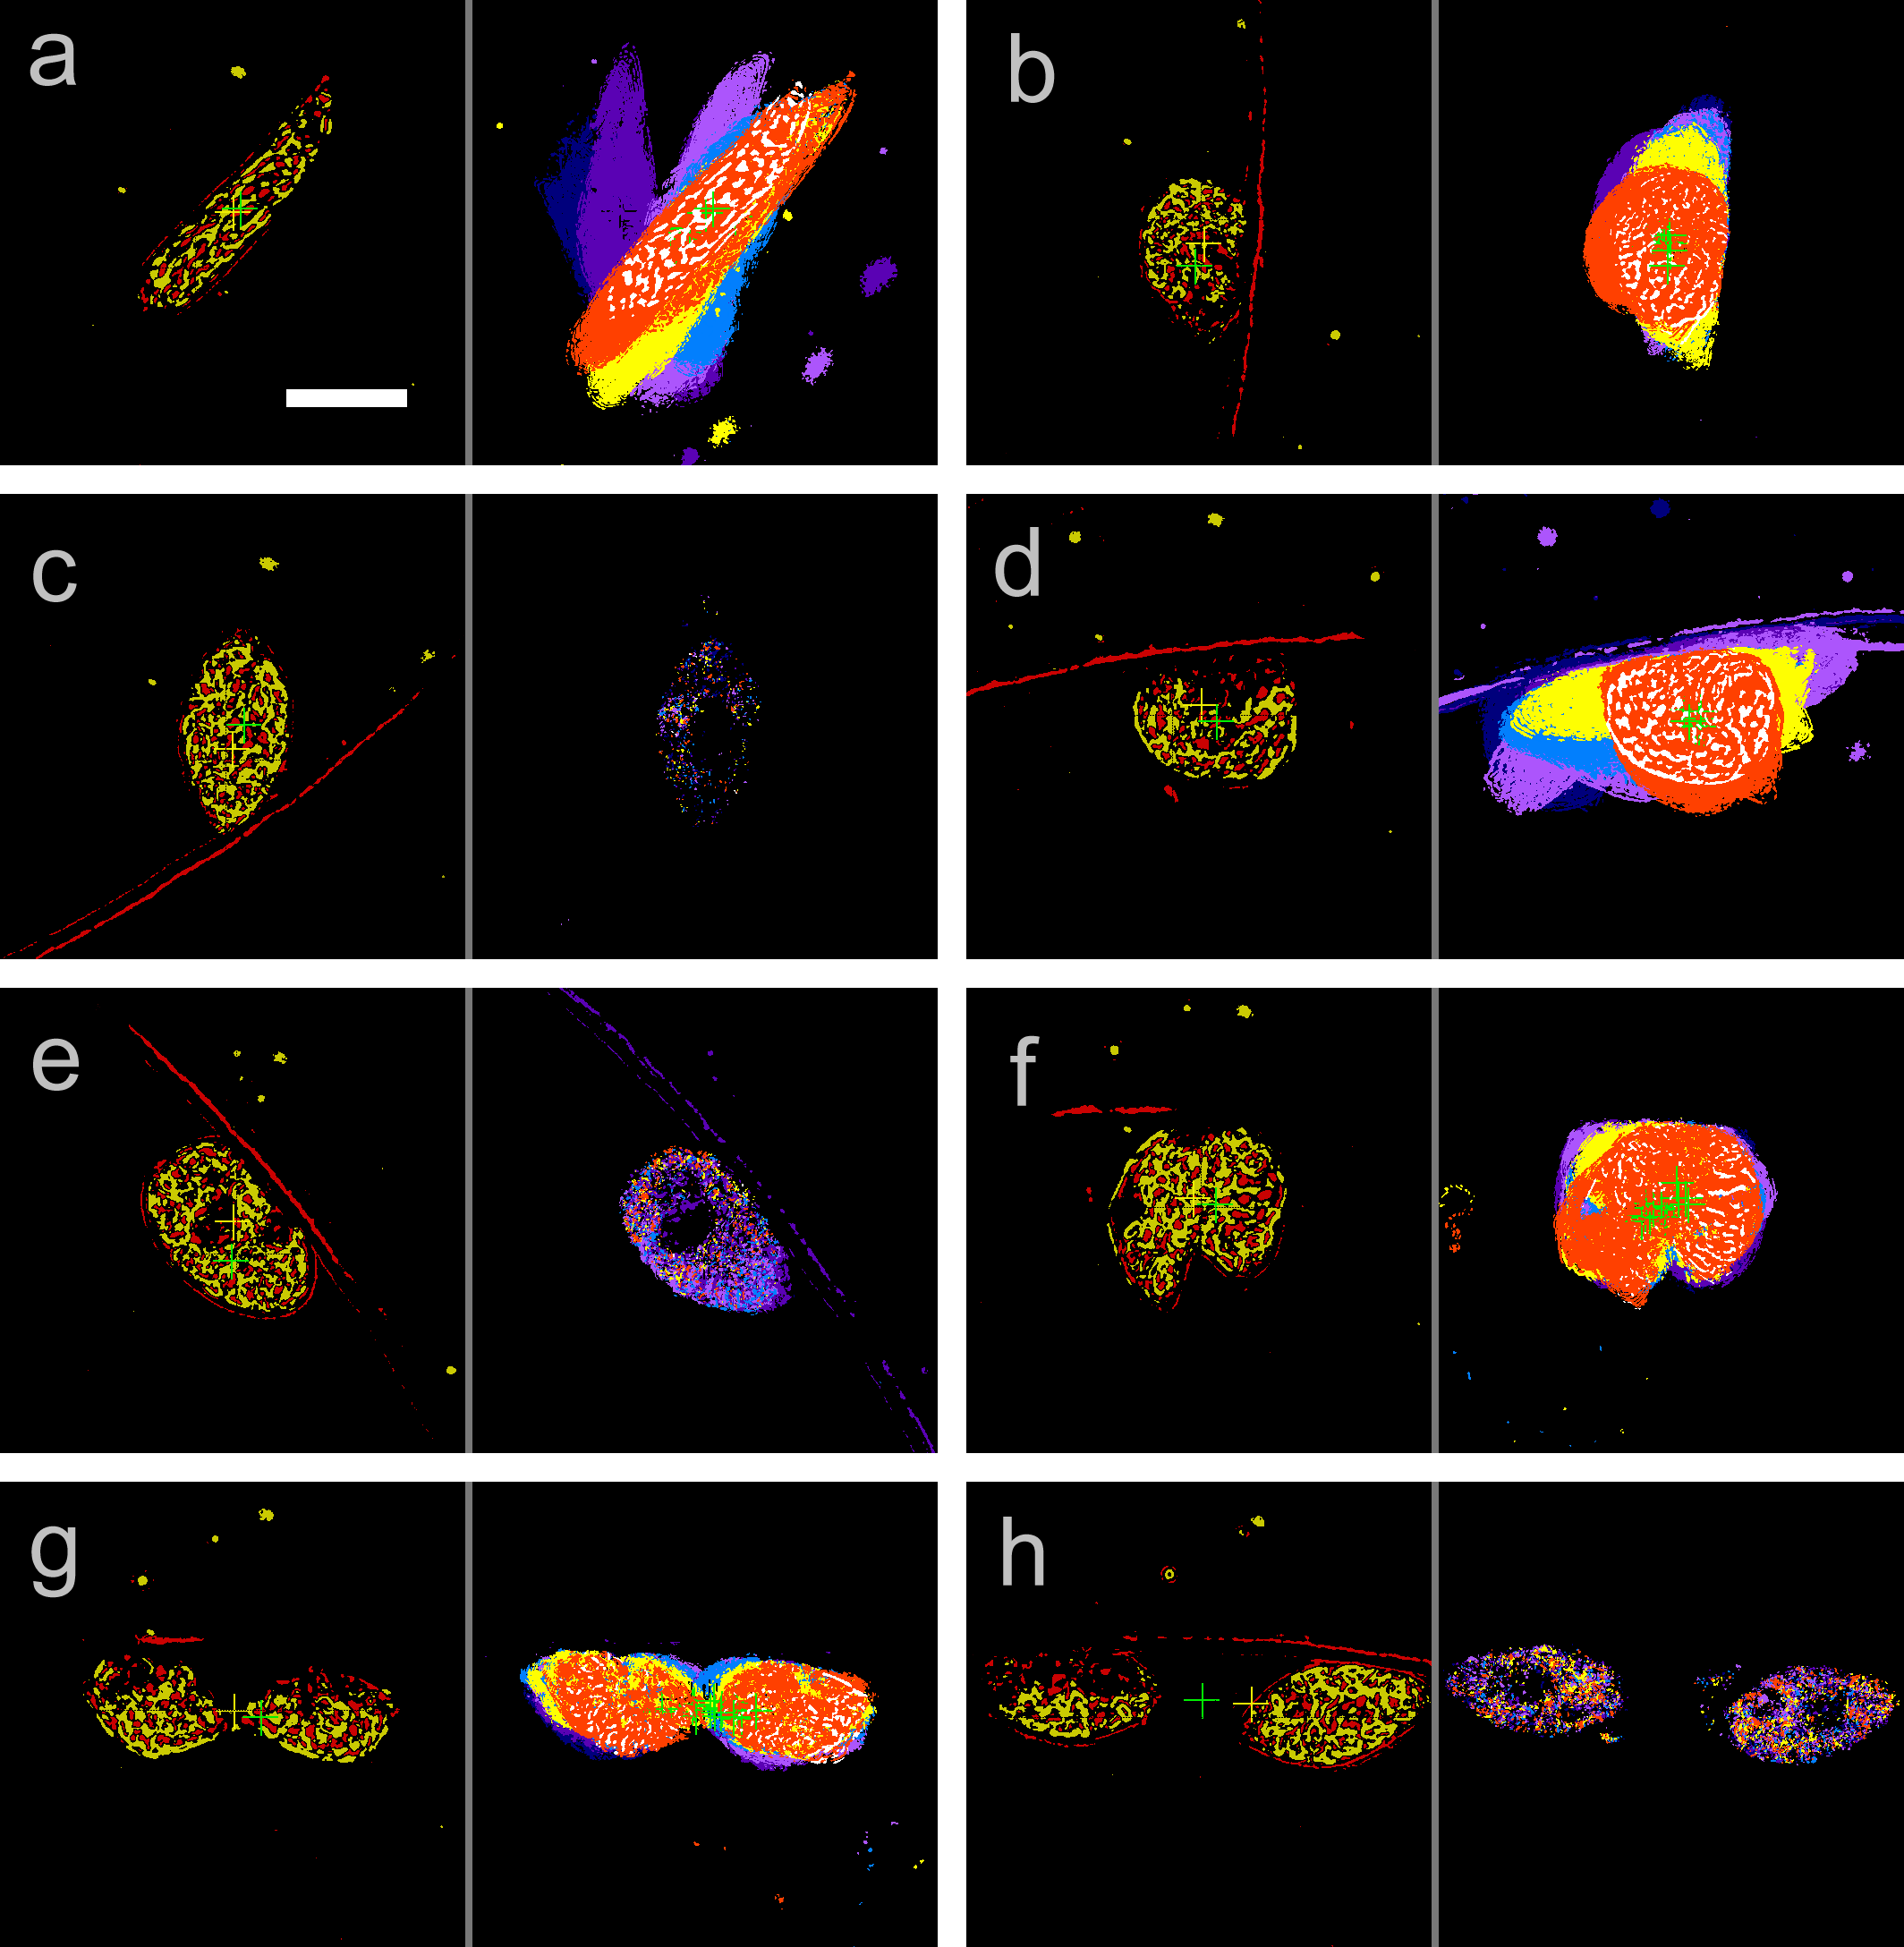
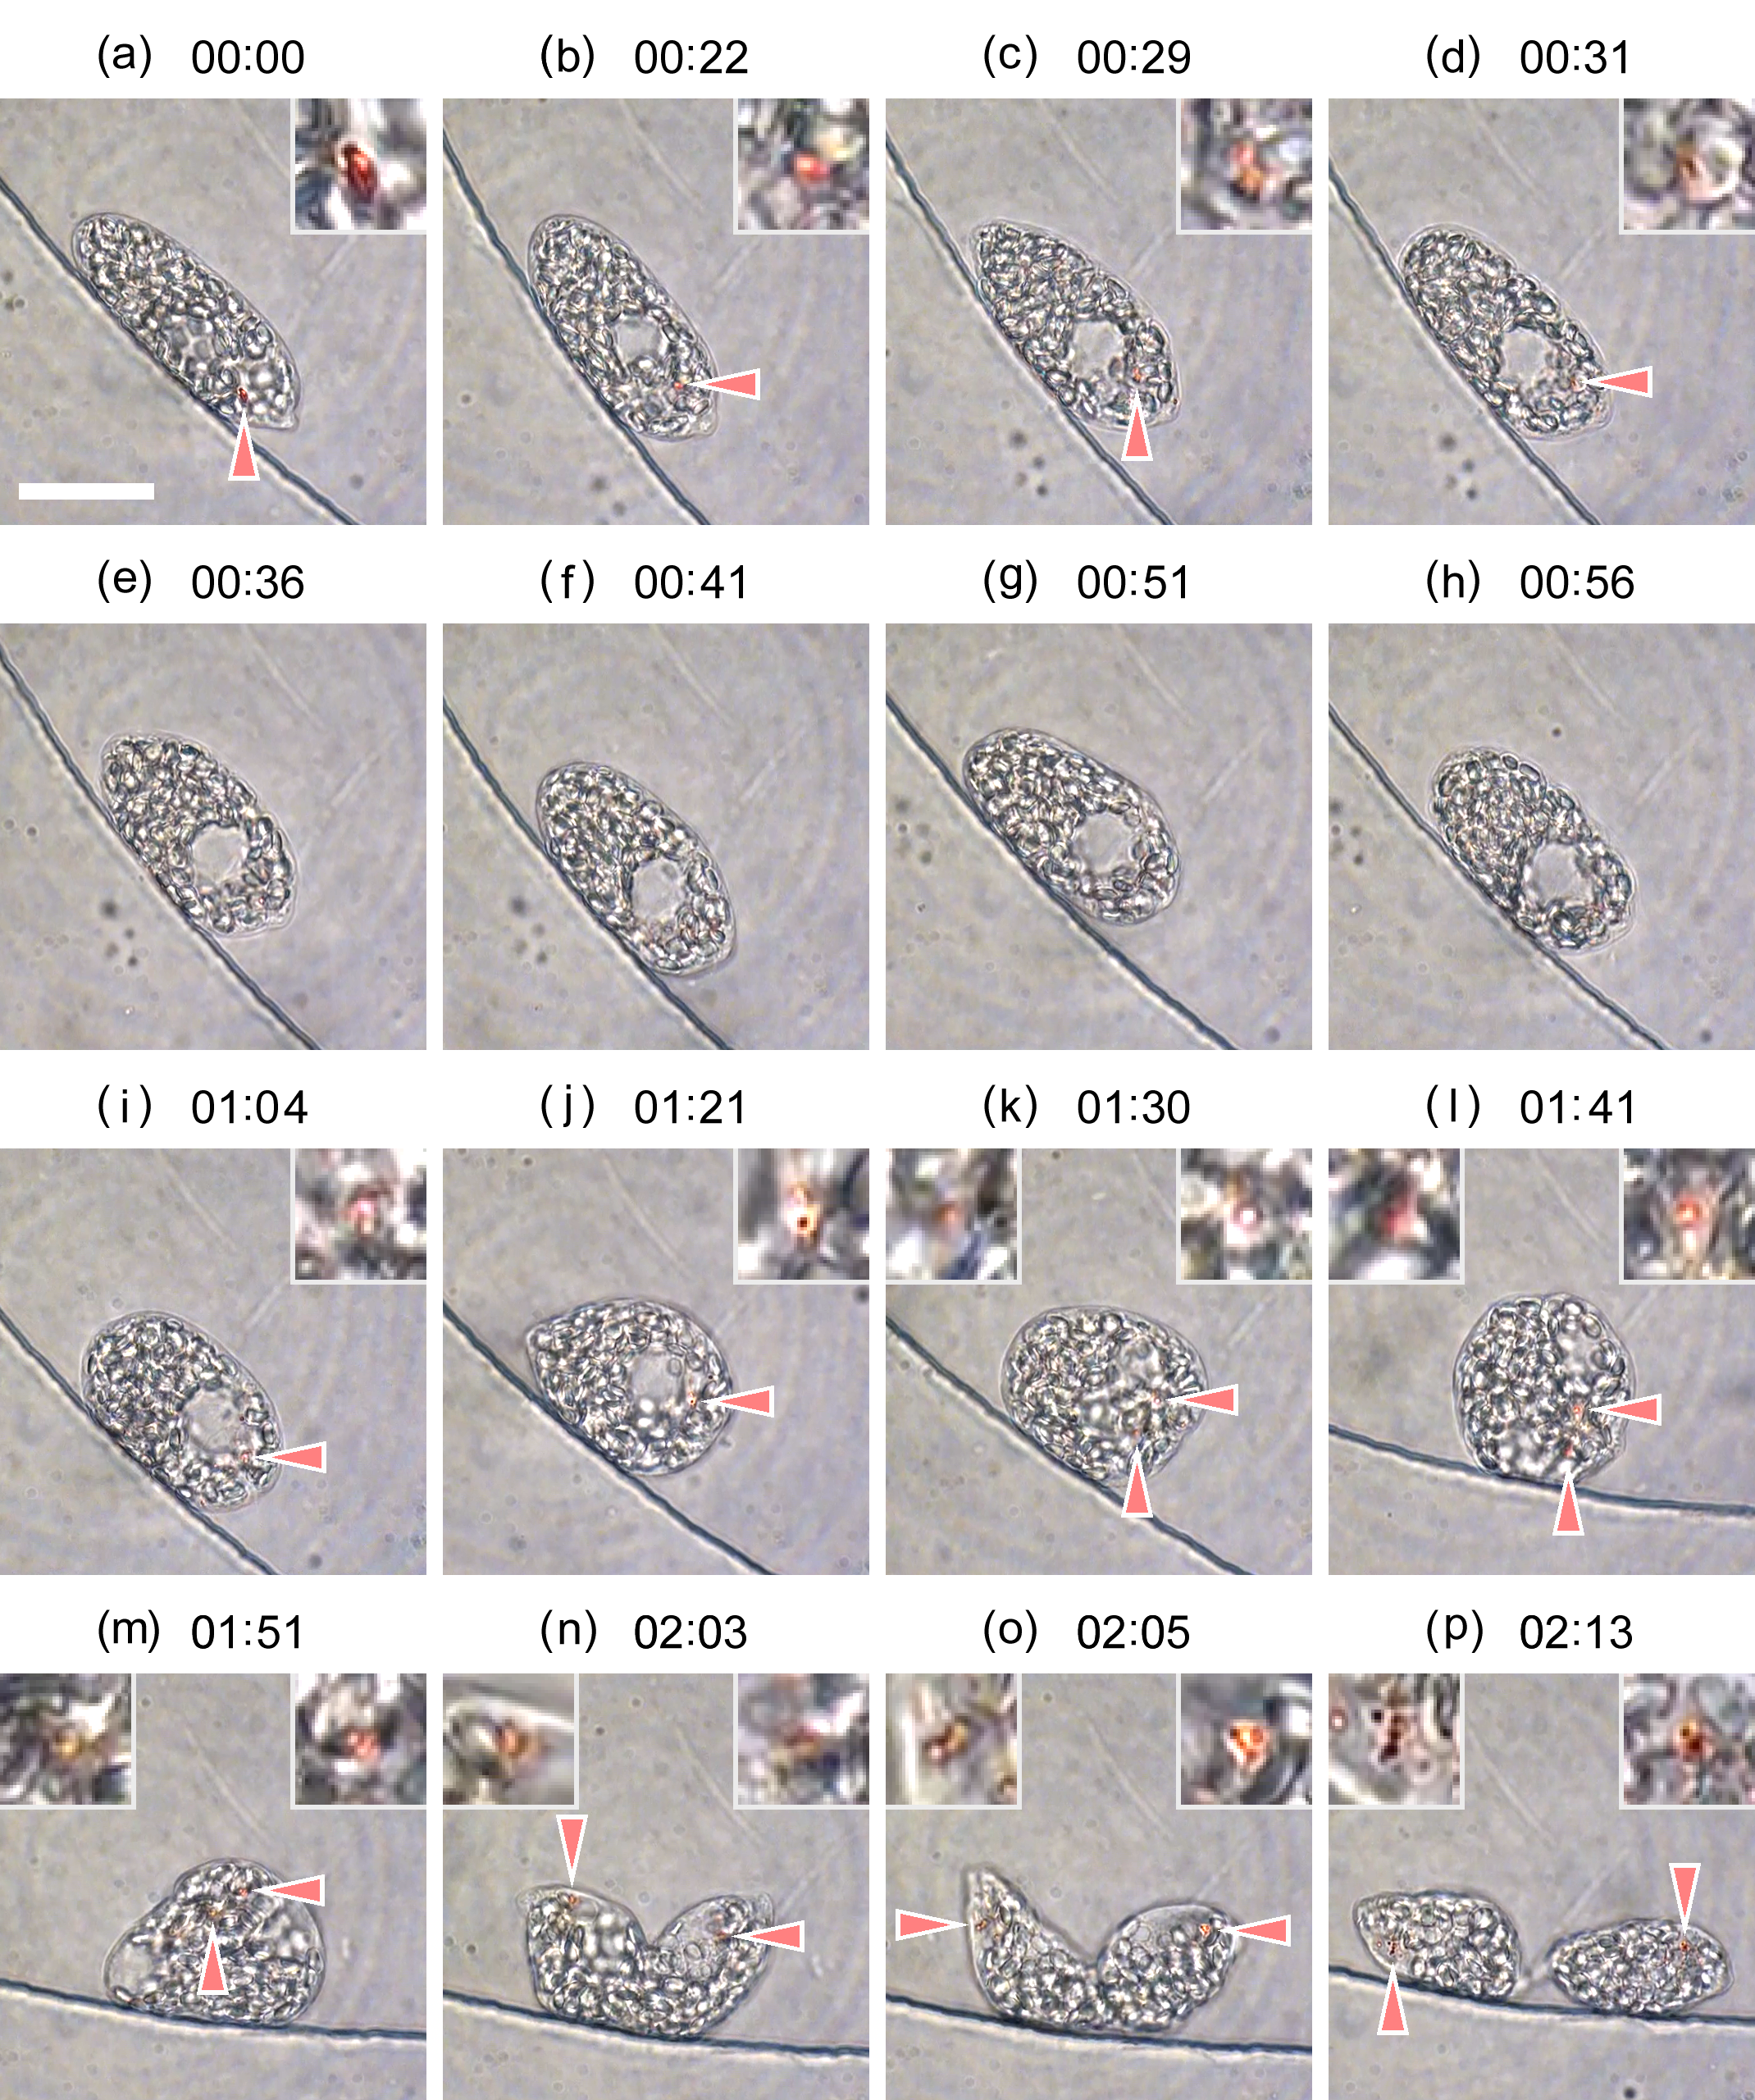
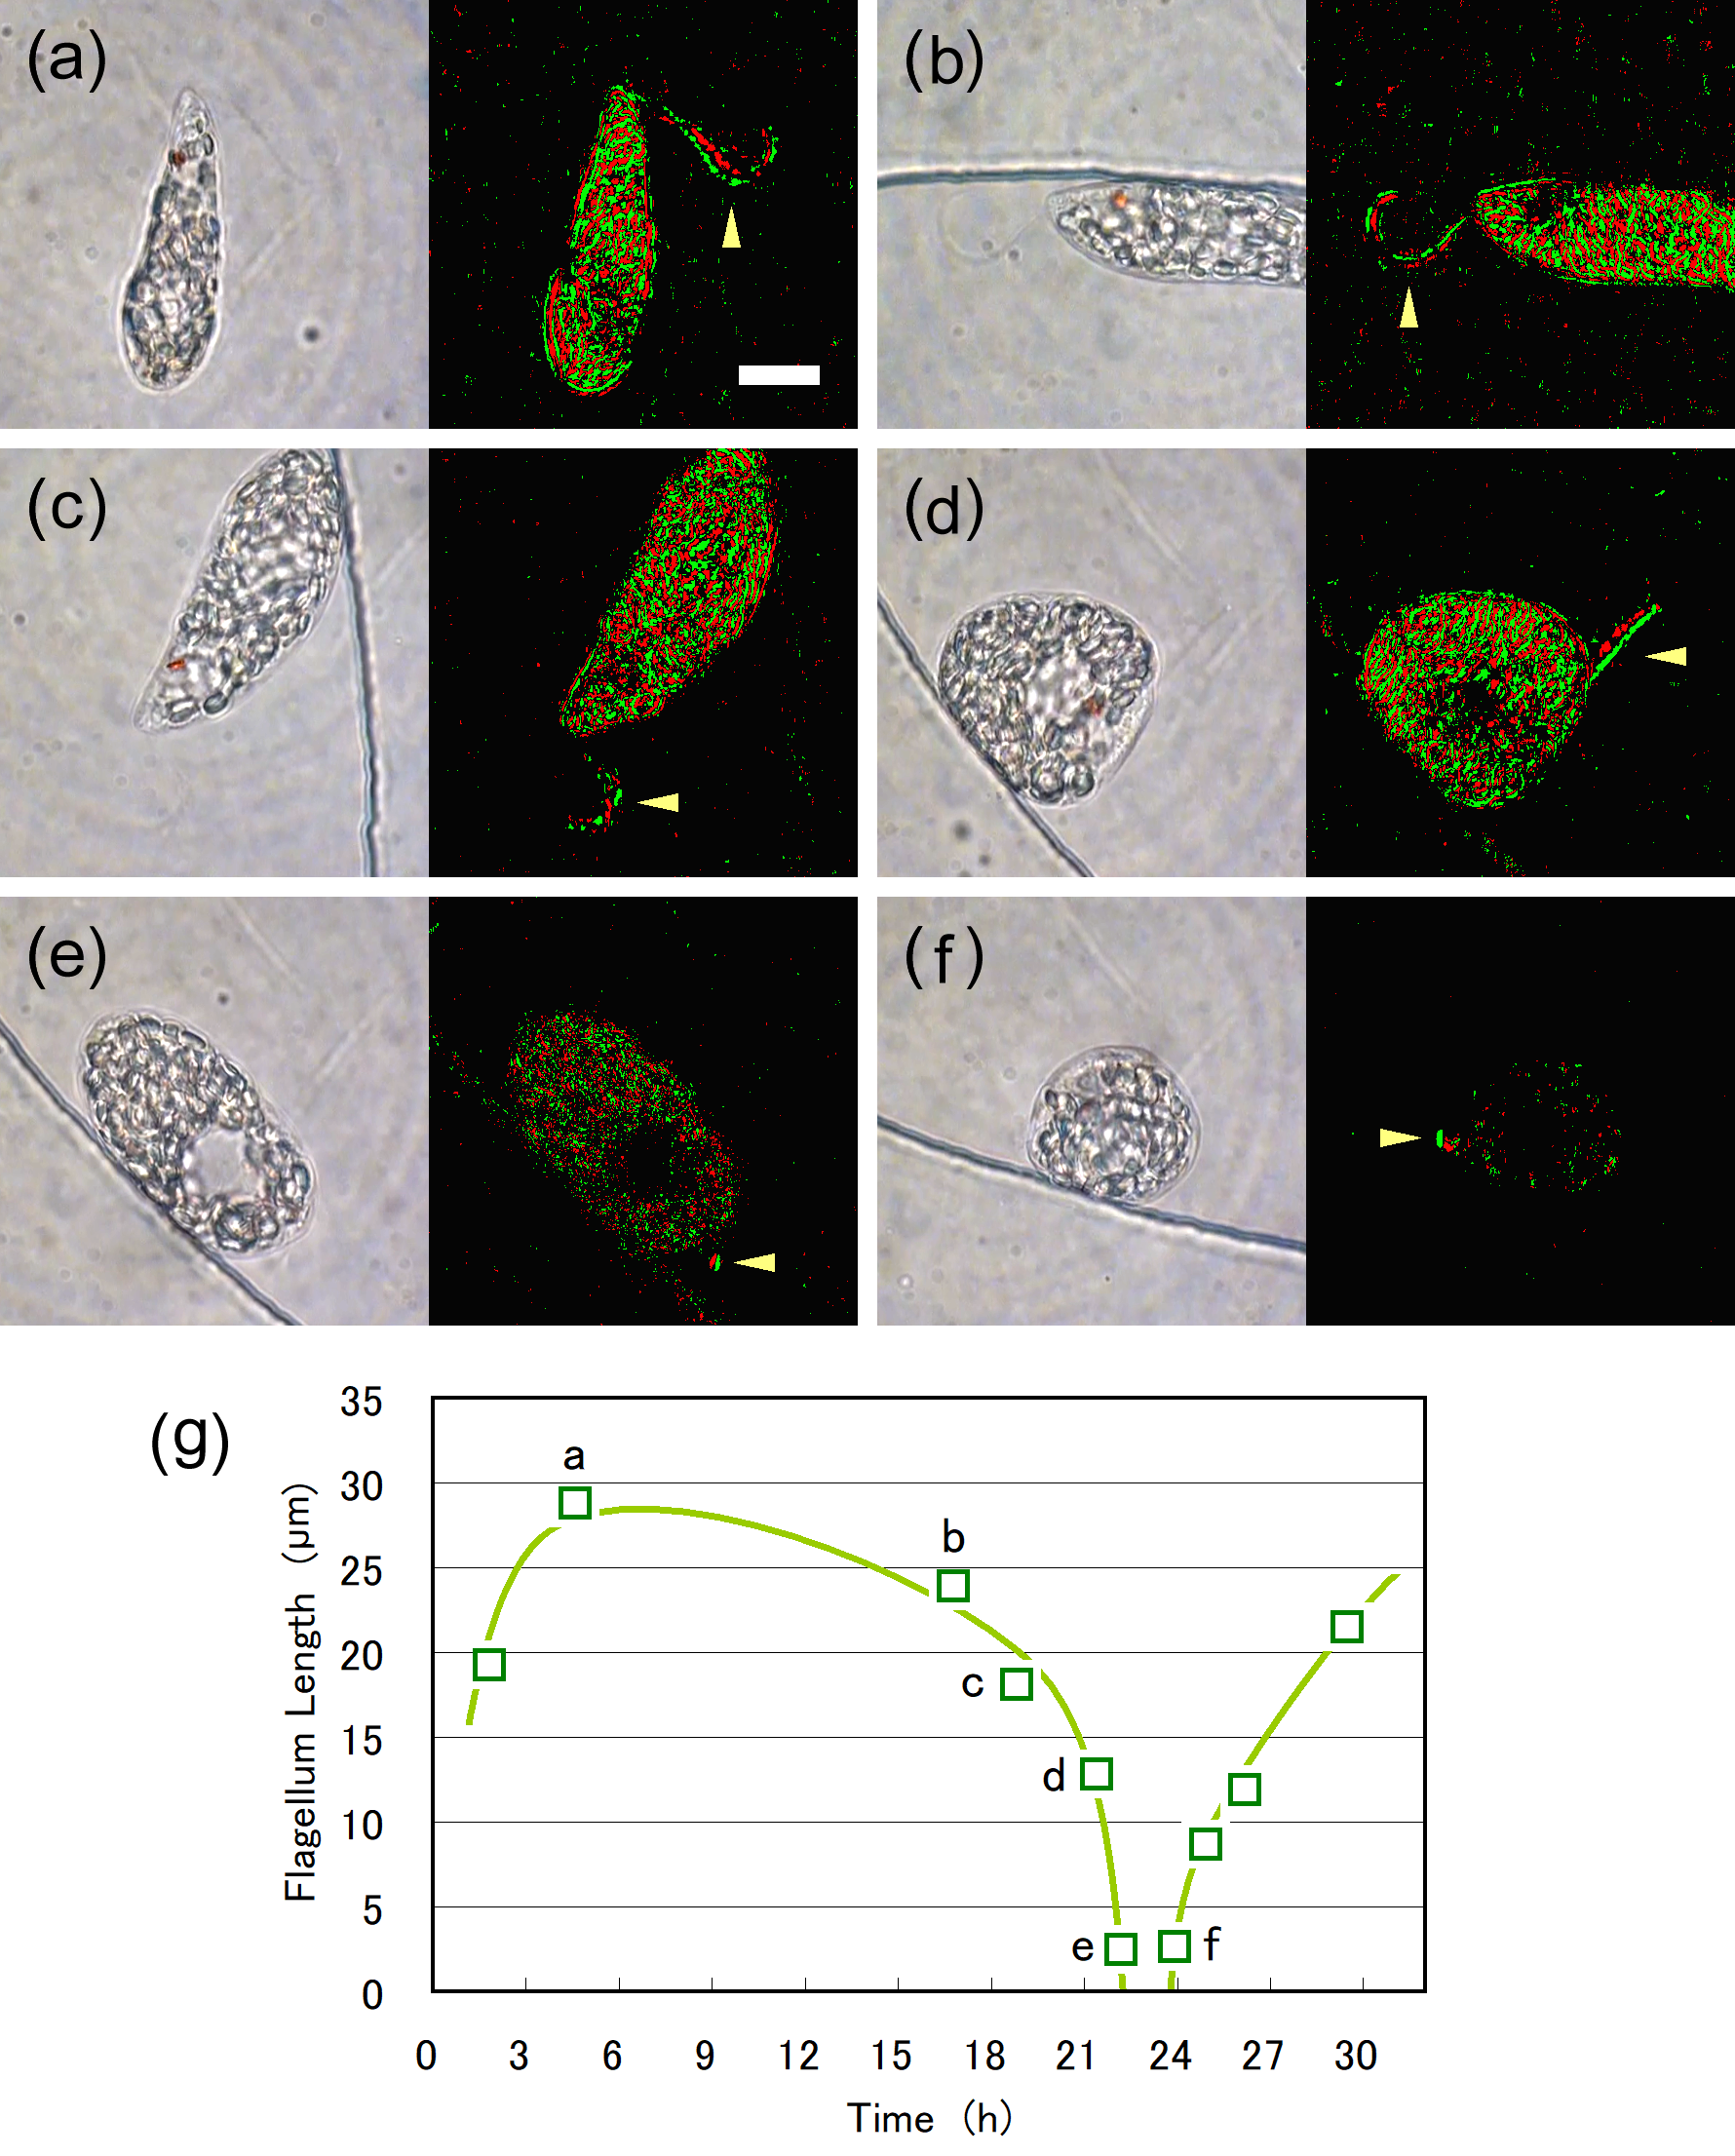
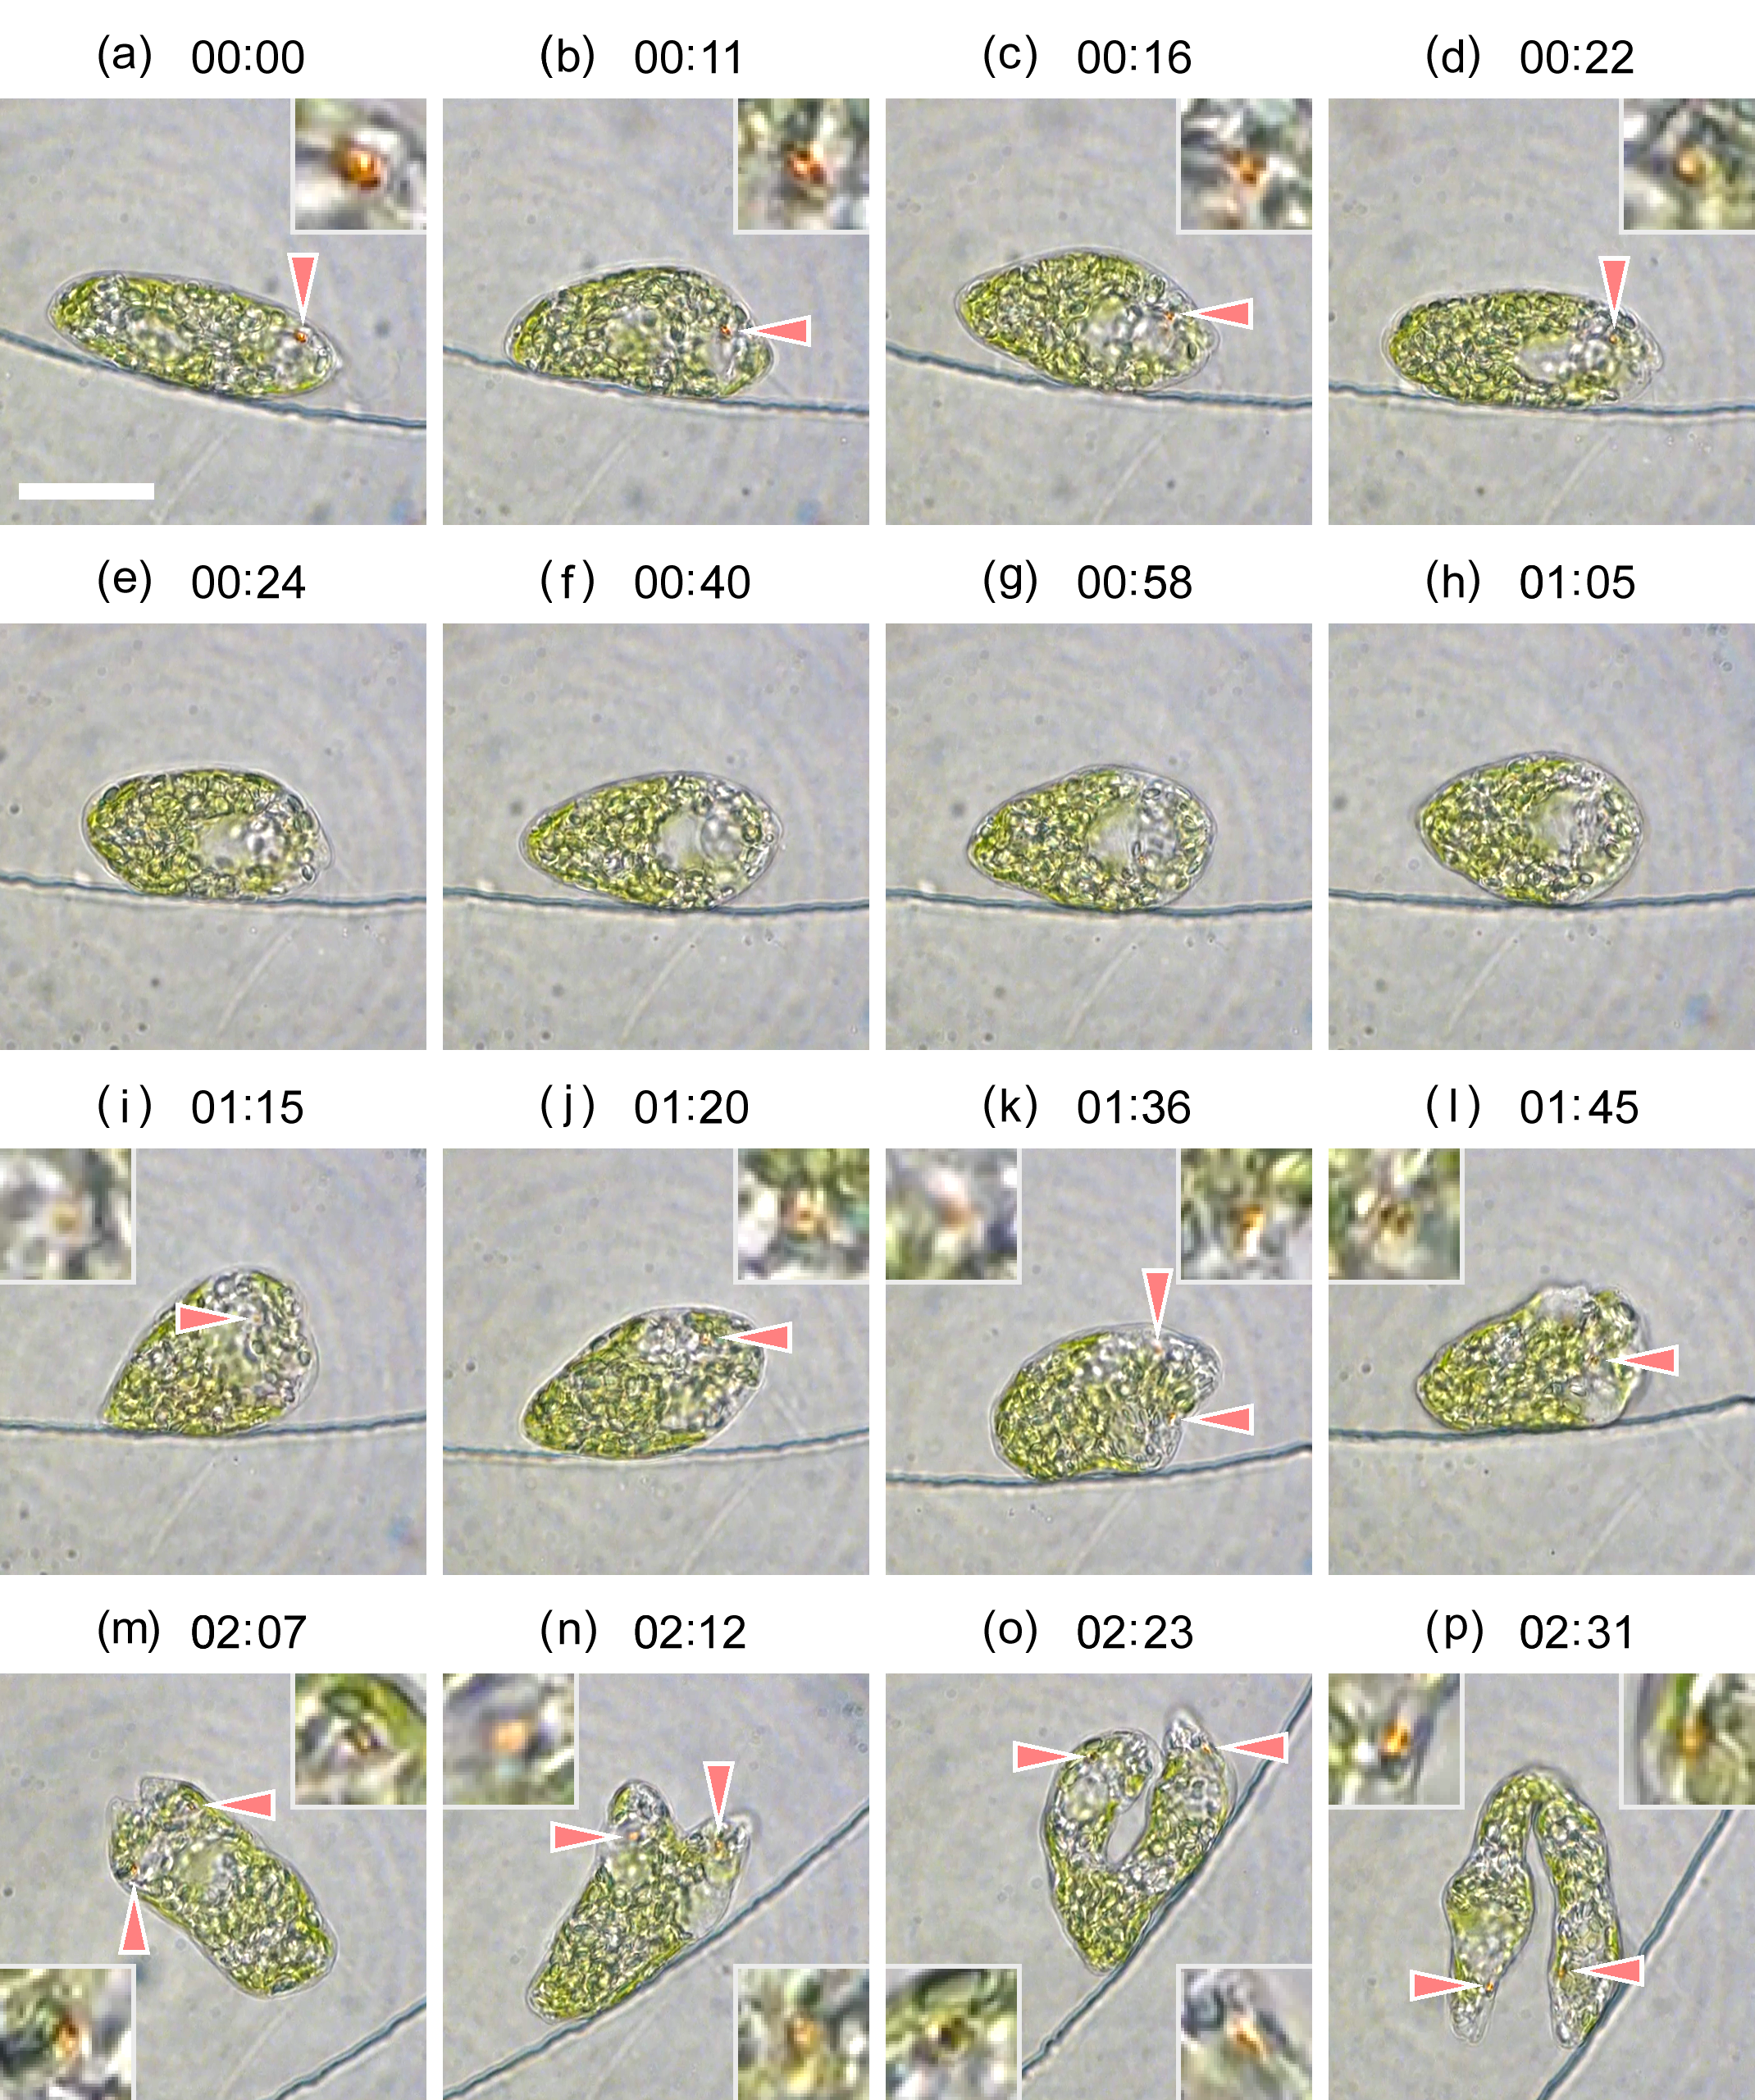
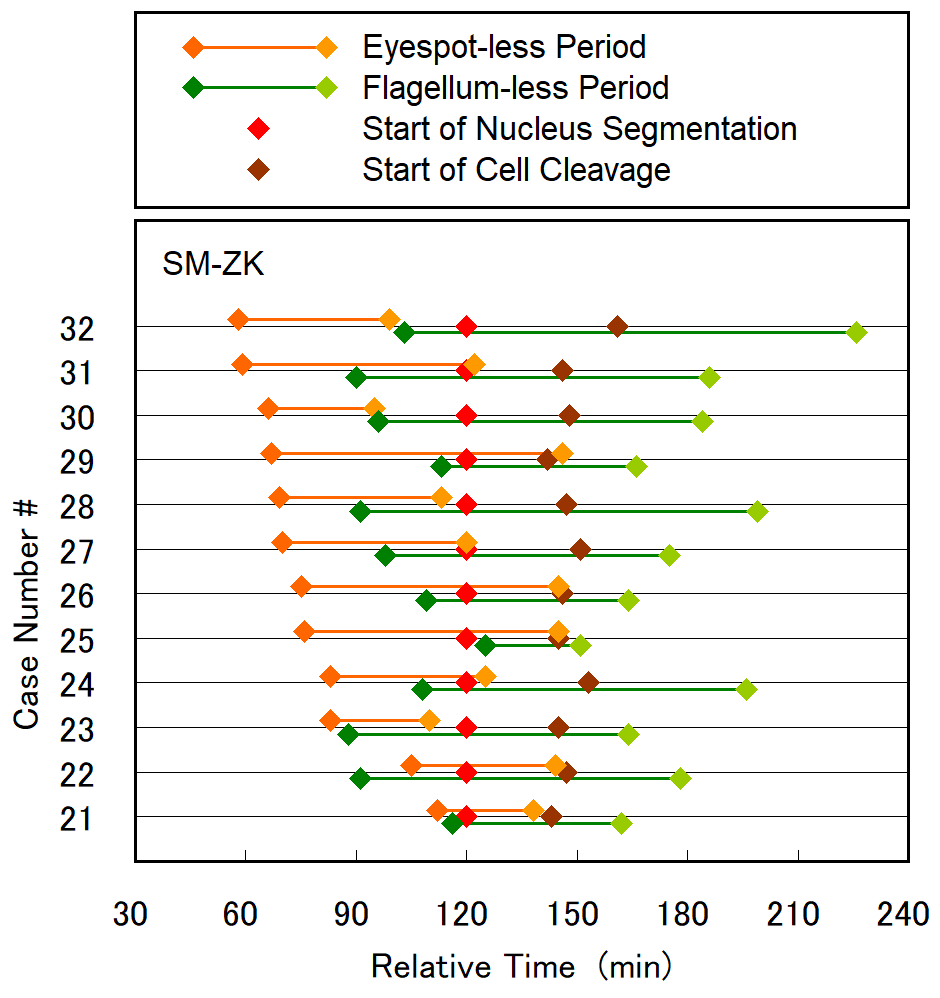
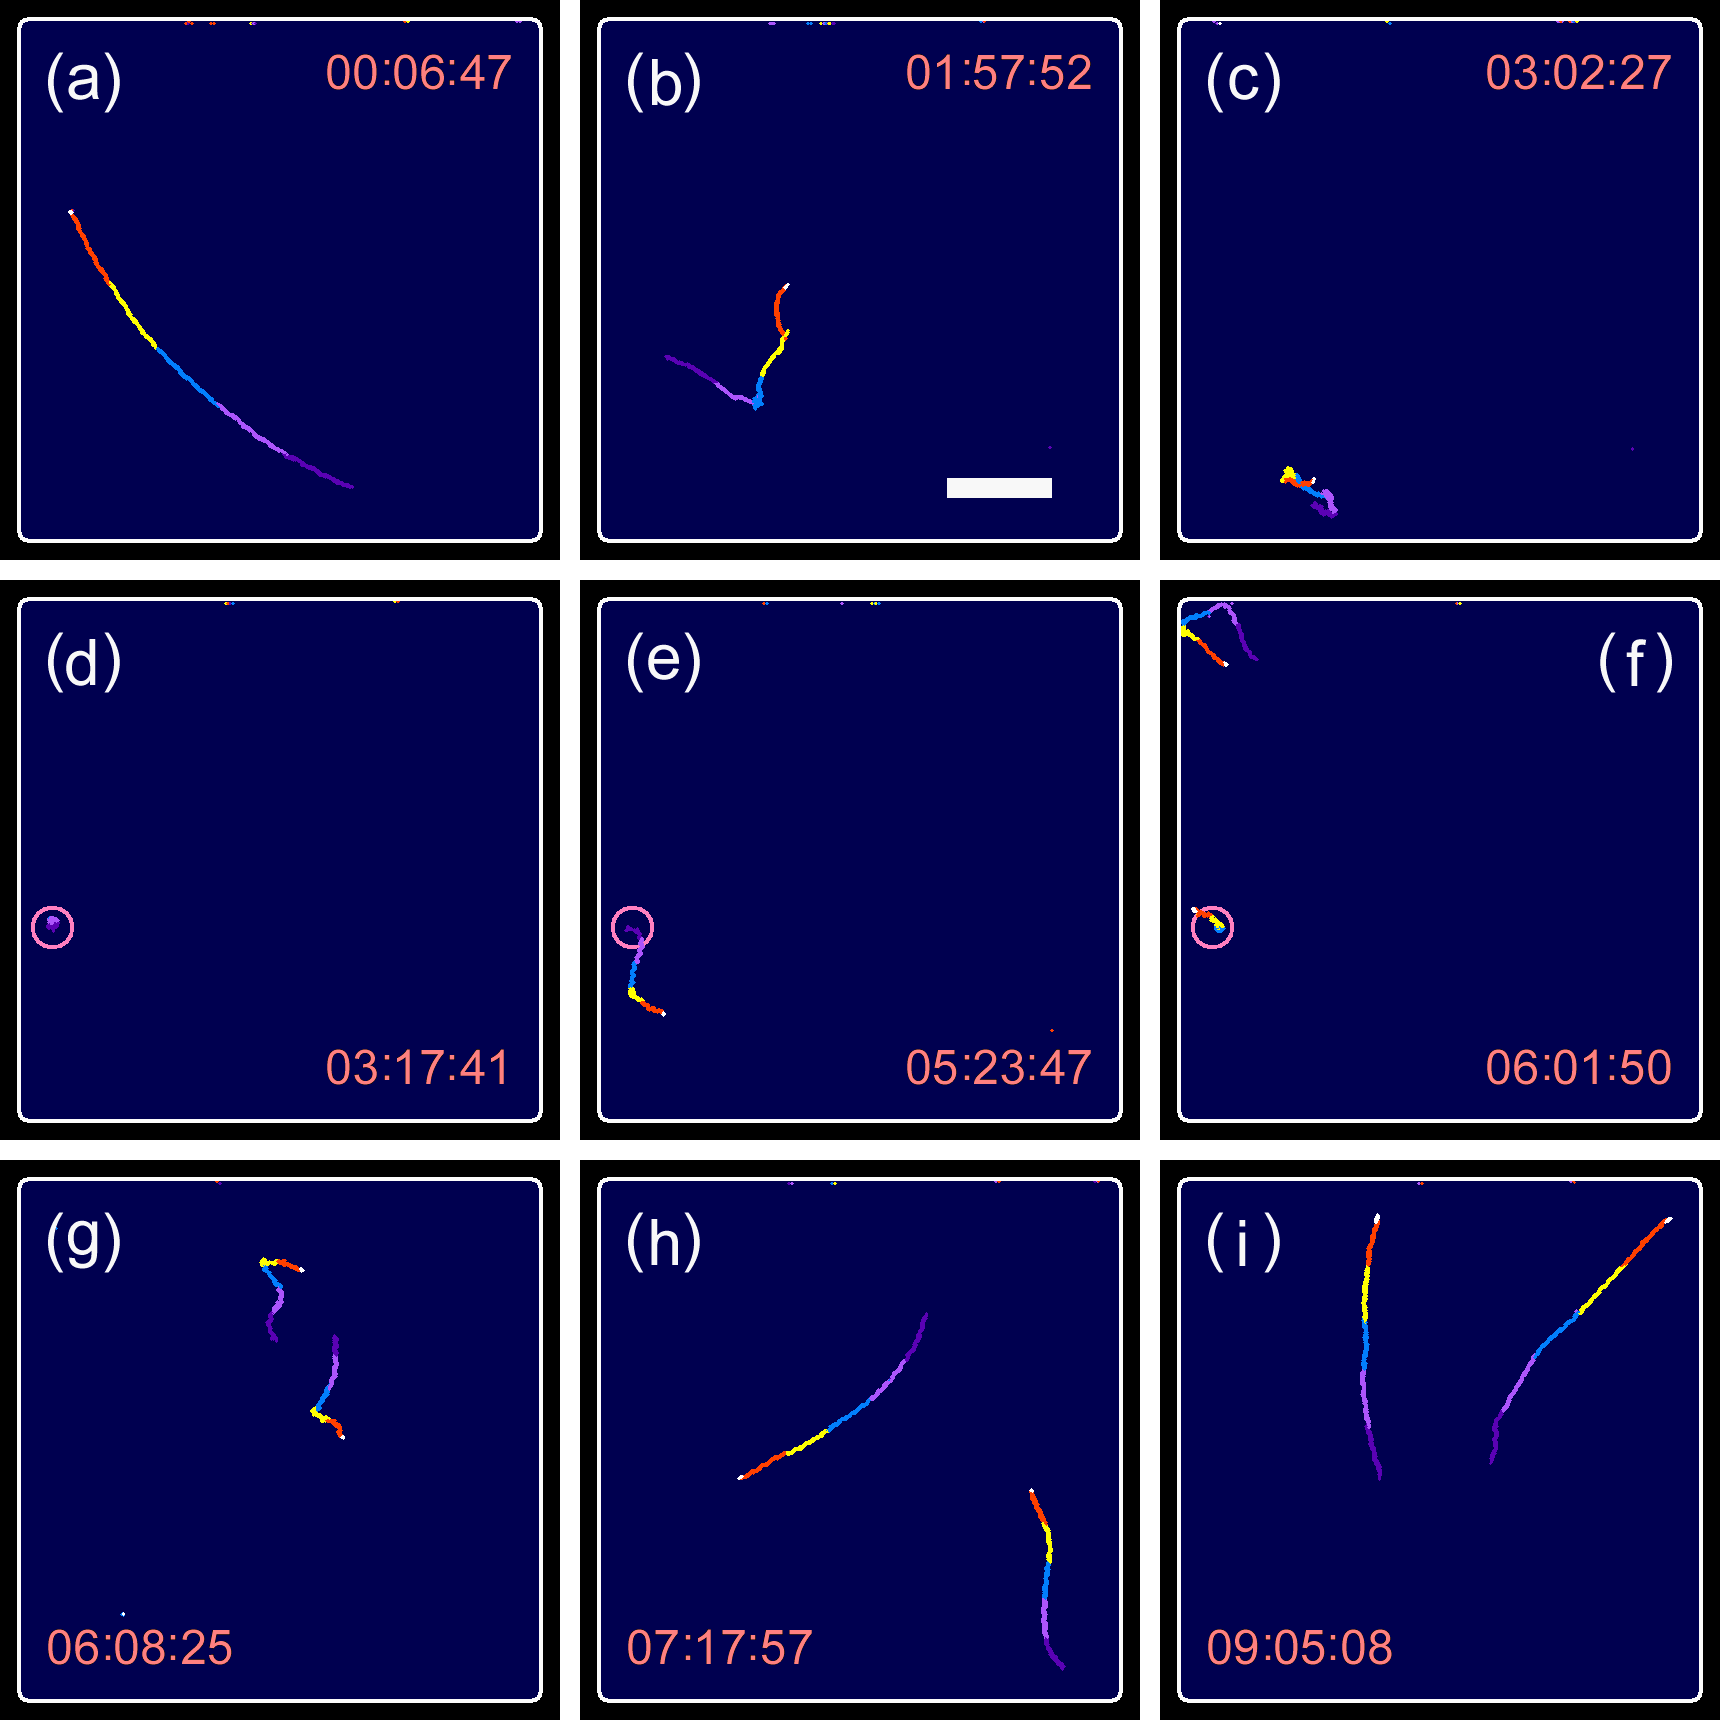
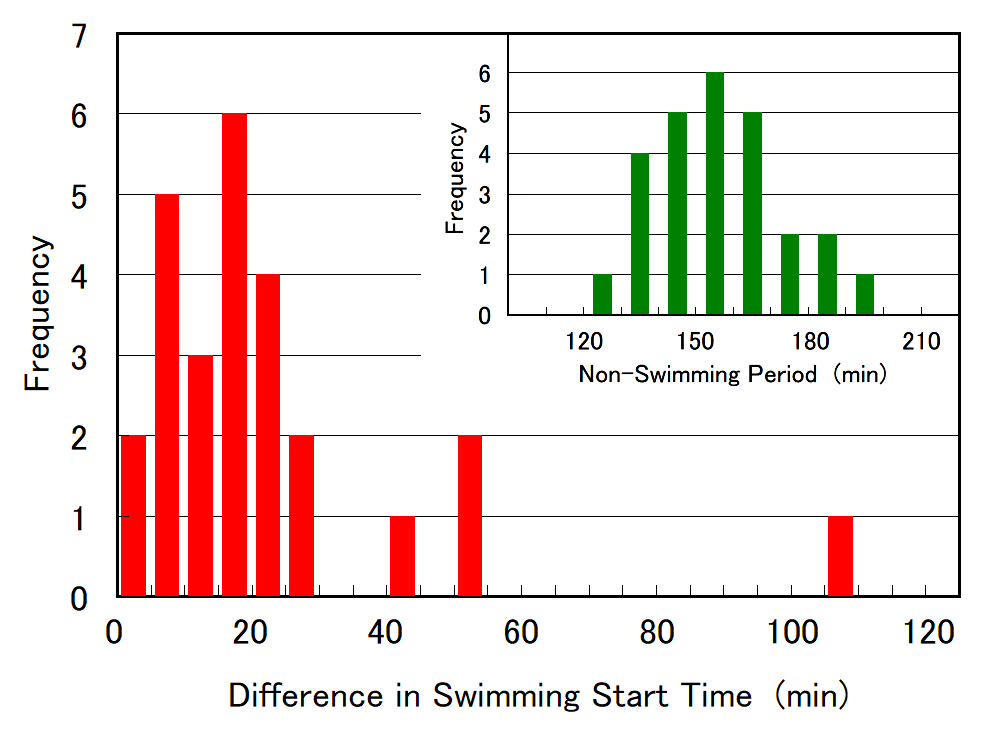
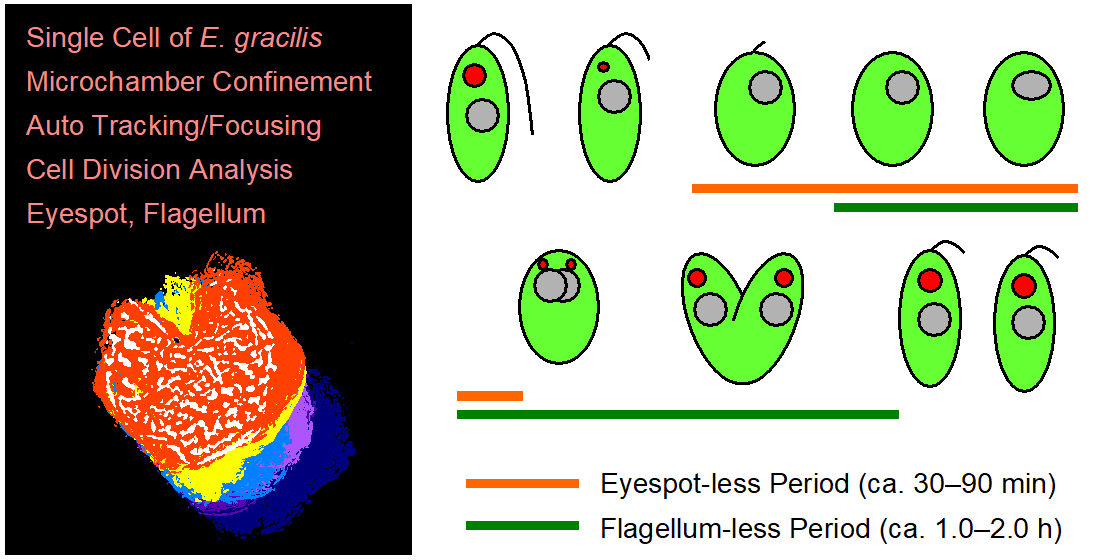
Cell division of unicellular microalgae is a fascinating process of proliferation, at which whole organelles are regenerated and distributed to two new lives. We performed dynamic live cell imaging of Euglena gracilis using optical microscopy to elucidate the mechanisms involved in the regulation of the eyespot and flagellum during cell division and distribution of the organelles into the two daughter cells. Single cells of the wild type (WT) and colorless SM-ZK cells were confined in a microfluidic device, and the appearance of the eyespot (stigma) and emergent flagellum was tracked in sequential video-recorded images obtained by automatic cell tracking and focusing. We examined 12 SM-ZK and 10 WT cells and deduced that the eyespot diminished in size and disappeared at an early stage of cell division and remained undetected for 26–97 min (62 min on average, 22 min in deviation). Subsequently, two small eyespots appeared and were distributed into the two daughter cells. Additionally, the emergent flagellum gradually shortened to zero-length, and two flagella emerged from the anterior ends of the daughter cells. Our observation revealed that the eyespot and flagellum of E. gracilis are degraded once in the cell division, and the carotenoids in the eyespot are also decomposed. Subsequently, the two eyespots/flagella are regenerated for distribution into daughter cells. As a logical conclusion, the two daughter cells generated from a single cell division possess the equivalent organelles and each E. gracilis cell has eternal or non-finite life span. The two newly regenerated eyespot and flagellum grow at different rates and mature at different timings in the two daughter cells, resulting in diverse cell characteristics in E. gracilis.
1. Introduction
2. Development and Findings
3. Conclusions
References
- D. E. Buetow, The biology of Euglena, Vol. III: Physiology, New York, Academic Press (1982).
- P. Gualtieri, K. Barsanti, V. Passarelli, F. Verni, G. Rosati, A look into the reservoir of Euglena gracilis: SEM investigations of the flagellar apparatus, Micron Microscopica Acta, 21, 131-138 (1990).
- T. W. James, F. Crescitelli, E. R. Loew, W. N. McFarland, The eyespot of euglena gracilis: a microspectrophotometric study, Vision Res., 32, 1583-1591 (1992).
- R. K. Mortimer, J. R. Johnston, Life span of individual yeast cells, Nature, 183, 1751-1752 (1959).
- K. K. Steffen, B. K. Kennedy, M. Kaeberlein, Measuring replicative life span in the budding yeast, J. Vis. Exp., 28, e1209 (2009).
- J. M. Murray, Control of cell shape by calcium in the Euglenophyceae, J. Cell Sci., 49, 99-117 (1981).
- P. L. Walne and H. J. Arnott, The comparative ultrastructure and possible function of eyespots: Euglena granulata and Chlamydomonas eugametos, Planta, 77, 325-353 (1967).
- T. Osafune and J. A. Schiff, Stigma and flagellar swelling in relation to light and carotenoids in Euglena gracilis var. bacillaris, J. Ultrastruct. Res., 73, 336-349 (1980).
- N. M. L. Morel-Laurens, D. J. Bird, Effects of cell division on the stigma of wild-type and an eyeless mutant of Chlamydomonas, J. Ultrastruct. Res., 87, 46-61 (1984).
- F. R. Cross, J. G. Umen, The Chlamydomonas cell cycle, Plant J., 82, 370-392 (2015).
- J. J. Wolken, E. Shin, Photomotion in Euglena gracilis I. Photokinesis II. Phototaxis, Eukaryotic Microbiol., 5, 39-46 (1958).
- S. P. Gibbs, The fine structure of Euglena gracilis with special reference to the chloroplasts and pyrenoids, J. Ultrastruct. Res., 4, 127-148 (1960).
- G. F. Leedale, The nucleus in Euglena, chap 5, in D. E. Buetow Ed., The biology of Euglena, Vol. I, New York, Academic Press (1968).
- R. P. Hall, T. L. Jahn, On the comparative cytology of certain euglenoid flagellates and the systematic position of the families euglenidae stein and astasiidae butschli, Trans. Am. Micrscop. Soc., 48, 388-405 (1929).
- R. P. Hall, T. L. Jahn, Dispersed stages of the stigma in euglena, Science, 69, 522 (1929).
- M. Gojdics, The cell morphology and division of euglena deses ehrge, Trans. Am. Microscop. Soc., 53, 299-310 (1934).
- M. A. Gillott, R. E. Triemer, The ultrastructure of cell division in Euglena gracilis, J. Cell Sci., 31, 25-35 (1978).
- P. A. Kivic, M. Vesk, Structure and function of the euglenoid eyespot, J. Exper. Botany, 23, 1070-1075 (1972).
- P. A. Kivic, M. Vesk, Structure and function in the euglenoid eyespot apparatus: the fine structure, and response to environmental changes, Planta, 105, 1-14 (1972).
- S. Kato, K. Ozasa, M. Maeda, Y. Tanno, S. Tamaki, M. Higuchi-Takeuchi, K. Numata, Y. Kodama, M. Sato, K. Toyooka, T. Shinomura, Carotenoids are essential for light perception by the eyespot apparatus to initiate the phototactic movement of Euglena gracilis, Plant J., 101, 1091-1102 (2020).
- T. Cavalier-Smith, Basal body and flagellar development during the vegetative cell cycle and the sexual cycle of Chlamydomonas Reinhardii, J. Cell Sci., 16, 529-556 (1974).
- G. M. Habib, B. G. Bouck, Synthesis and mobilization of flagellar glycoprotein during regeneration in Euglena, J. Cell Biol., 93, 432-441 (1982).
- H. Okuwa-Hayashi, H. Inui, J. Inagaki, M. Nakazawa, S. Ebara, T. Sakamoto, Y. Nakano, Effect of nicotinamide on the flagellar detachment and regeneration of Euglena, Vitamins (Japan), 93, 115-122 (2019).
- P. L. Beech, K. Heimann, M. Melkonian, Development of the flagellar apparatus during the cell cycle in unicellular algae, Protoplasma, 164, 23-37 (1991).
- K. Ozasa, H. Kang, S. Song, S. Kato, T. Shinomura, M. Maeda, Temporal Evolution of the Gravitaxis of Euglena gracilis from a Single Cell, Plants, 10, 1411 (2021).
- K. Ozasa, J. Lee, S. Song, M. Hara, M. Maeda, Gas/liquid sensing via chemotaxis of Euglena cells confined in an isolated micro-aquarium, LabChip, 13, 4033-4039 (2013).
- M. Iseki, S. Matsunaga, A. Murakami, K. Ohno, K. Shiga, K. Yoshida, M. Sugai, T. Takahashi, T. Hori, M. Watanabe, A blue-light activated adenylyl cyclase mediates photoavoidance in Euglena gracilis. Nature 415, 1047-1051 (2002).
- K. Ozasa, J. Lee, S. Song, M. Maeda, Transient freezing behavior in photophobic responses of Euglena gracilis investigated in a microfluidic device, Plant Cell Physiol., 55, 1704-1712 (2014).
- K. Ozasa, J. Won, S. Song, S. Tamaki, T. Ishikawa, M. Maeda, Temporal change of photophobic step-up responses of Euglena gracilis investigated through motion analysis. PLoS ONE, 12, e0172813 (2017).
- S. Tamaki, Y. Tanno, S. Kato, K. Ozasa, M. Wakazaki, M. Sato, K. Toyooka, T. Maoka, T. Ishikawa, M. Maeda, T. Shinomura, Carotenoid accumulation in the eyespot apparatus required for phototaxis is independent of chloroplast development in Euglena gracilis, Plant Sci., 298, 110564 (2020).
- A. Vogel, J. Noack, G. Huttmann, G. Paltauf, Mechanisms of femtosecond laser nanosurgery of cells and tissues, Appl. Phys. B, 81, 1015-1047 (2005).


