 +1 credit
| Version | Summary | Created by | Modification | Content Size | Created at | Operation |
|---|---|---|---|---|---|---|
| 1 | Muntasir Billah | + 2233 word(s) | 2233 | 2020-03-23 10:57:25 | | | |
| 2 | Rita Xu | -129 word(s) | 2104 | 2020-03-31 04:09:28 | | | | |
| 3 | Rita Xu | -71 word(s) | 2033 | 2020-10-29 10:21:33 | | |
Video Upload Options
Autophagy is a cellular process by which mammalian cells degrade and assist in recycling damaged organelles and proteins. This study aimed to ascertain the role of autophagy in RIPC-induced cardioprotection. Sprague Dawley rats were subjected to RIPC at the hindlimb followed by 30 min transient blockade of the left coronary artery to simulate I/R injury. Hindlimb muscle and the heart were excised 24 h post reperfusion. RIPC prior to I/R upregulated autophagy in the rat heart at 24 h post reperfusion. In vitro, autophagy inhibition or stimulation prior to RIPC respectively, either ameliorated or stimulated the cardioprotective effect, measured as improved cell viability to mimic the preconditioning effect. Recombinant IL-6 treatment prior to I/R increased in vitro autophagy in a dose dependent manner activating the JAK-STAT pathway without affecting the other kinase pathways such as p38 MAPK, and GSK-3β pathways. Prior to I/R, in vitro inhibition of the JAK-STAT pathway reduced autophagy upregulation despite recombinant IL-6 pre-treatment. Autophagy is an essential component of RIPC-induced cardioprotection that may upregulate autophagy through an IL-6/JAK-STAT dependent mechanism, thus identifying a potentially new therapeutic option for the treatment of ischemic heart disease.
1. RIPC Prior to I/R Upregulates Autophagic Activity In Vitro and In Vivo
To determine autophagic activity, Atg5-Atg12 and LC3-II autophagic markers were assessed in vitro and in vivo. Stimulating with RHPC prior to H/R (RHPC-H/R) in H9c2 cells increased Atg5-Atg12 expression by 1.70 ± 0.08-fold relative to the normoxic control (p < 0.05) (Figure 1A). Similarly, LC3-II was significantly increased in RHPC H/R compared to the H/R group (1.95 ± 0.21 vs. 1.38 ± 0.11-fold relative to normoxic control, p < 0.05) (Figure 1B). Consistent with the in vitro results, RIPC stimulation in the hindlimb prior to I/R (RIPC I/R) significantly elevated the Atg5-Atg12 conjugate (2.24 ± 0.36 vs. 1.29 ± 0.0.19-fold relative to sham, p < 0.05) (Figure 1C) and LC3-II (2.07 ± 0.28 vs. 1.16 ± 0.12-fold relative to sham, p < 0.05) (Figure 1D) compared to I/R injury alone. Induction of autophagy was confirmed by pre-treatment of H9c2 cells with bafilomycin A-1 prior to exposing them to H/R. Increased levels of LC3-II in the presence of bafilomycin A-1 are indicative of autophagy flux. However, to assess if H/R and RHPC alter the autophagic flux through substrate digestion, it is important to compare the treatment plus bafilomycin A-1 with the treatment alone group [1]. An additive effect of LC3-II levels with bafilomycin A-1 is suggestive of autophagy flux due to the treatment/intervention; however, if the treatment plus bafilomycin A-1 does not increase LC3-II levels, then it is likely that the autophagy process is impaired [2][3]. In our study, the treatment plus bafilomycin significantly increased LC3-II levels compared to the treatment alone (p < 0.001) in all the study groups, suggesting functioning autophagy flux in the normoxia, H/R, and RHPC H/R groups (Figure 1E).
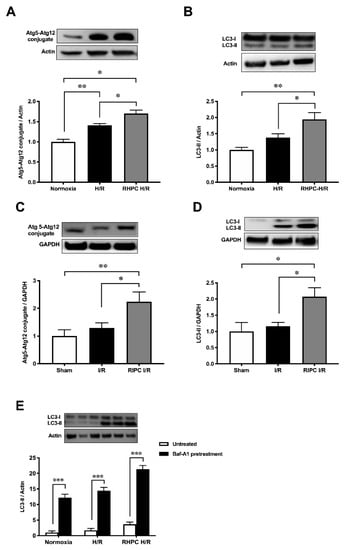
Figure 1. Effect of RIPC prior to I/R on autophagy protein expression in vitro and in vivo. Western blot analysis of Atg5-Atg12 conjugate in (A) H9c2 cells, (B) rat heart lysate and LC3 protein levels in (C) H9c2 cells, (D) rat heart lysate, and (E) bafilomycin-A1-treated H9c2 cell extracts, expressed as mean ± SEM, fold relative to control; * p < 0.05, ** p < 0.01.
2. Autophagy Functions as a Signaling Mechanism for RIPC and Confers Cardioprotection Against I/R Injury in Rats
Consistent with the increase of autophagy in H9c2 cells exposed to RHPC-H/R, RHPC alone significantly increased LC3-II protein by 2.29 ± 0.44-fold relative to the normoxic control (p < 0.05) (Figure 2A) in vitro. In order to evaluate the contribution of RIPC alone, without left coronary artery (LCA) occlusion and reperfusion, on myocardial autophagy and the cardioprotective JAK-STAT3 pathway, myocardial tissue was assessed for LC3-II and phosphorylated STAT3 levels immediately post-RIPC (0 min post-RIPC) and 24 h post-RIPC. In rats subjected to RIPC only, LC3-II protein in the myocardial tissue increased 1.37 ± 0.13-fold relative to the control group at 24 h post-RIPC (p < 0.05 vs. sham, p < 0.05 vs. 0 min post-RIPC) (Figure 2B). However, no effect on LC3-II was observed at 0 min post-RIPC compared to the control group (1.04 ± 0.08-fold relative to sham). Interestingly, at 0 min post-RIPC, the autophagy regulator STAT3 was increasingly phosphorylated (3.97 ± 1.33-fold relative to the sham (p < 0.05) in myocardial tissue (Figure 2C). However, this value decreased to 2.21 ± 0.45-fold relative to the sham (p = 0.32 vs. 0 min post-RIPC) at 24 h post-RIPC.
In confirmation of previous studies, infarct size 24 h following I/R injury was reduced to 36.66 ± 3.87% with RIPC prior to I/R injury compared to I/R injury alone (52.96 ± 1.48%) (p < 0.01) (Figure 2D). There was no significant difference in the area at risk (AAR) between groups (Figure 2E). This cardioprotection from RIPC was confirmed by the reduction of cleaved poly(ADP-ribose) polymerase (PARP), an apoptotic marker, in RIPC I/R cardiac tissue compared to I/R alone (1.75 a± 0.44 vs. 5.45 ± 1.12-fold relative to sham, p < 0.01) (Figure 2F). Cardioprotective kinase signaling pathways, JAK-STAT, GSK-3β, and p38 MAPK, showed varied outcomes with RIPC prior to I/R. In RIPC I/R, STAT3 phosphorylation was significantly increased compared to I/R only (3.81 ± 0.26 vs. 2.26 ± 0.38-fold relative to sham, p < 0.01) (Figure 2G). Interestingly, phosphorylated GSK-3β was significantly elevated in I/R (1.78 ± 0.14-fold relative to the sham group (p < 0.05) but reversed to almost the sham group level in RIPC I/R (0.80 ± 0.07-fold relative to the sham group, p < 0.05) (Figure 2H). In contrast, p38 MAPK phosphorylation was unchanged after RIPC I/R and I/R alone (Figure 2I).
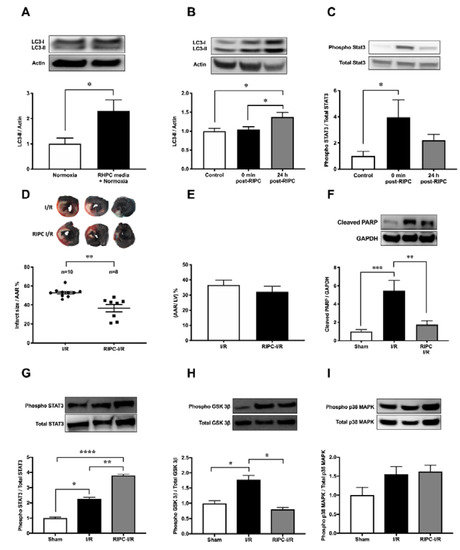
Figure 2. Effect of RIPC on autophagy and the cardioprotective signaling mechanism. Western blot analysis of (A) LC3 in H9c2 cells subjected to RHPC (preconditioned) media under normoxic conditions and (B) LC3 in the rat heart and (C) STAT3 phosphorylation in the rat heart assessed in the control group (without any intervention or sham surgery), at 0 min and 24 h post-RIPC. (D–I) Rats subjected to I/R with and without prior RIPC. (D) MI size expressed as the percentage of infarct size/AAR, (E) cumulative data of AAR/LV expressed as the percentage of the mean ± SEM. Western blot analysis of rat heart tissue assessing the (F) cleaved PARP (n = 8), (G) phosphorylated STAT3 (n = 8), (H) phosphorylated GSK-3β (n = 8), and (I) phosphorylated p38 MAPK (n = 8) levels at 24 h post-I/R with and without prior hindlimb RIPC. Results are expressed as mean ± SEM relative to control; * p < 0.05, ** p < 0.01, *** p < 0.001, **** p < 0.0001.
3. Autophagy is Essential for RHPC-Induced Cardioprotection In Vitro
To assess the importance of autophagy in the RIPC protective effect, H9c2 cells were pre-treated with 3-Methyladenine (3-MA) (inhibits autophagy) or rapamycin (Rapa) (promotes autophagy) prior to stimulation in the H/R injury model (Figure 3A). Pre-treatment with 3-MA significantly reduced cell viability in 3-MA RHPC-H/R cells compared to RHPC-H/R alone (38.89 ± 4.44% vs. 78.43 ± 3.68%, p < 0.0001). In contrast, pre-treating the cells with rapamycin significantly reduced cell viability in the RAPA-RHPC-H/R group compared to RHPC-H/R alone (64.93 ± 3.47% vs. 78.43 ± 3.68%, p < 0.05) and in Rapa H/R compared to H/R (61.32 ± 2.22 vs. 34.83 ±3.63, p < 0.05). Consistent with these results, pro-apoptotic Bax protein expression was significantly increased with 3-MA RHPC-H/R treatment compared to RHPC-H/R alone (7.02 ± 1.60 vs. 1.44 ± 0.11-fold relative to the normoxic control, p < 0.01) (Figure 3B). Additionally, 3-MA pre-treatment resulted in a significant increase in H9c2 apoptosis in the RHPC-H/R group compared to the untreated RHPC-H/R group (6.13 ± 0.77% vs. 2.97 ± 0.69%, p < 0.05) (Figure 3C). However, treatment with rapamycin prior to H/R resulted in a significant decrease in apoptosis in the H/R group compared to the untreated H/R group (2.75 ± 0.79% vs. 5.01 ± 0.30%, p < 0.05) (Figure 3D). Changes in the mitochondrial membrane potential triggers the cycle of reactive oxygen species (ROS) formation [4], and is linked with cell death [5][6]. We analyzed the mitochondrial membrane potential level in H9c2 cells with and without RHPC prior to H/R. The mitochondrial membrane potential was lost in the H/R group (0.66 ± 0.05%-fold relative to control, p < 0.01); however, the mitochondrial membrane potential was maintained in the RHPC-H/R group (1.01 ± 0.08%-fold relative to control, p < 0.05 vs. H/R) (Figure 3E).
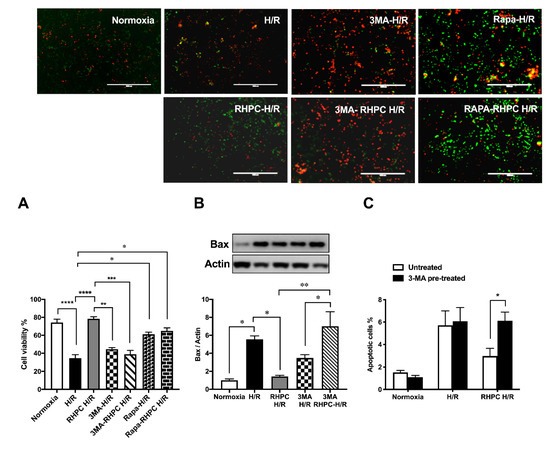
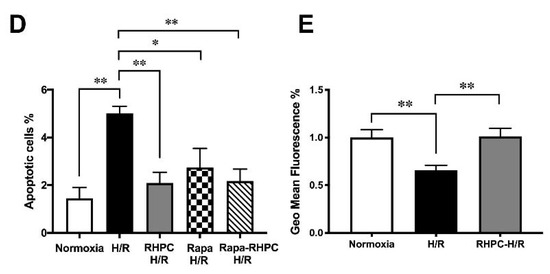
Figure 3. Effect of autophagy modulation on cell viability. (A) H9c2 cells were stained with calcein AM (green) and ethidium homodimer-1 (red). Green: live cells, Red: dead cells; the scale bar is 1000 μm. Quantitative analysis of percentage of live/dead cells expressed as mean ± SEM, (B) Western blot analysis of pro-apoptotic Bax protein expression are expressed as mean ± SEM, fold relative to the normoxic control, (C) and (D) Cell apoptosis assessed by fluorescein isothiocyanate (FITC)-labeled annexin V (annexin V-FITC) and propidium iodide (PI) double staining and fluorescence-activated cell sorting (FACS). Quantitative analysis of percentage of apoptotic cells (annexin-V+/PI+) cells are represented as mean ± SEM; (E) Mitochondrial membrane potential at 1 h post-reoxygenation assessed by 1,1′,3,3,3′,3′‐hexamethylindodicarbocyanine iodide (DiLC5) staining and FACS represented as the percentage geo mean fluorescence ± SEM, fold relative to the normoxia control; n = at least 3 independent experiments, * p < 0.05, ** p < 0.01, *** p < 0.001, **** p < 0.0001.
4. RIPC-Induced Autophagy Regulated by the IL-6-Dependent JAK-STAT Pathway
After RIPC, the secretion of cytokines critical in cardiovascular pathology was assessed. In rats subjected to RIPC, circulating IL-6 protein levels in the plasma were significantly increased to 103.4 ± 1.08 pg/mL compared to 98.4 ± 0.68 pg/mL in the sham group (p < 0.01) (Figure 4A). Similarly, in rat hindlimb tissue where RIPC was performed, localized messenger RNA (mRNA) IL-6 expression was upregulated by 1.87 ± 0.22-fold relative to the sham group (p < 0.05, Figure 4B). In contrast, RIPC did not modulate the expression of other critical cytokines in cardiovascular pathology, including cardiotrophin-1 (Card-1) (1.30 ± 0.16-fold relative to the sham group) (Figure 4C), interleukin-11 (IL-11) (0.84 ± 0.33-fold relative to the sham group) (Figure 4D), leukemia inhibitory factor (LIF) (0.89 ± 0.21-fold relative to the sham group) (Figure 4E), and IL-1β (1.53 ± 0.32-fold relative to the sham group) (Figure 4F).
When H9c2 cells were treated with increasing doses of recombinant IL-6, LC3-II protein was upregulated compared to the untreated H/R group (p < 0.05) (Figure 4G). However, the LC3-II protein levels in the IL-6-treated H/R groups were similar to the RHPC-H/R group. Similarly, increasing concentrations of IL-6 treatment during hypoxia followed by reoxygenation increased STAT3 phosphorylation in a dose-dependent manner (Figure 4H). However, recombinant IL-6 treatment during hypoxia followed by reoxygenation did not modulate the phosphorylation level of p38 MAPK (Figure 4I) and GSK-3β (Figure 4J).
Pre-treatment of H9c2 cells with the STAT3 inhibitor tyrphostin AG-490 (50μM) prior to RHPC-H/R significantly reduced the RHPC-H/R-induced increase in LC3-II protein levels compared to the untreated RHPC-H/R group (0.41 ± 0.17-fold relative to the untreated RHPC-H/R group, p < 0.05) (Figure 4K). Tyrphostin AG-490 pre-treatment prior to H/R failed to upregulate LC3-II protein levels despite pre-treating H9c2 cells with 500 pg/mL of recombinant IL-6 during the hypoxic period prior to exposure to reoxygenation (1.44 ± 0.05 vs. 2.02 ± 0.08-fold relative to the normoxic control, p < 0.01) (Figure 4L).
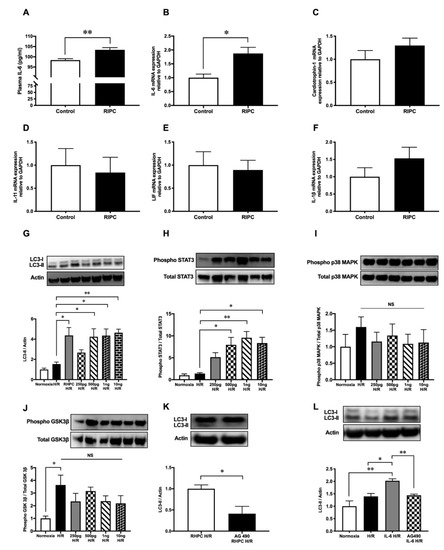
Figure 4. RIPC modulates cytokines’ expression and recombinant IL-6 treatment induces autophagy through the JAK-STAT pathway. (A) Plasma IL-6 protein levels at 0 min post-RIPC expressed as mean ± SEM, n = 5, p < 0.01. mRNA expression of (B) IL-6, (C) cardiotrophin-1, (D) IL-11, (E) LIF, and (F) IL-1β in rat hind limb muscle at 0 min post-RIPC assessed by qPCR and expressed as mean ± SEM; n = 9, * p < 0.05. Western blot analysis of (G) LC3, (H) phosphorylated STAT3, (I) phosphorylated GSK-3β, and (J) phosphorylated p38 MAPK in H9c2 cells pre-treated with different concentrations of IL-6 (250 pg/mL, 500 pg/mL, 1 ng/mL, 10 ng/mL) during hypoxia followed by reoxygenation. The expression levels of phosphorylated proteins were normalized to total STAT3, GSK-3β, and p38 MAPK, respectively. Results are expressed as mean ± SEM; * p < 0.05, ** p < 0.01. H9c2 cells exposed to RHPC-H/R with and without the JAK-STAT pathway inhibitor tyrphostin AG-490. Representative immunoblots and statistical data of (K) LC3 protein are expressed as mean ± SEM, fold relative to the RHPC-H/R group. (L) Representative immunoblot of the LC3 protein level in H9c2 cells with IL-6 treatment during hypoxia with and without tyrphostin AG-490 pre-treatment followed by reoxygenation are expressed as mean ± SEM, fold relative to the normoxic control; n = at least 3 independent experiments, * p < 0.05, ** p < 0.01.
References
- Klionsky, D.J.; Abdelmohsen, K.; Abe, A.; Abedin, M.J.; Abeliovich, H.; Acevedo Arozena, A.; Adachi, H.; Adams, C.M.; Adams, P.D.; Adeli, K.; et al. Guidelines for the use and interpretation of assays for monitoring autophagy (3rd edition). Autophagy 2016, 12, 1–222.
- David C. Rubinsztein; Ana Maria Cuervo; Brinda Ravikumar; Sovan Sarkar; Viktor I. Korolchuk; Susmita Kaushik; Daniel J. Klionsky; In search of an “autophagomometer”. Autophagy 2009, 5, 585-589, 10.4161/auto.5.5.8823.
- Sovan Sarkar; Brinda Ravikumar; David C. Rubinsztein; Chapter 5 Autophagic Clearance of Aggregate‐Prone Proteins Associated with Neurodegeneration. Methods in Enzymology 2009, 453, 83-110, 10.1016/s0076-6879(08)04005-6.
- Guido Kroemer; Bruno Dallaporta; Michèle Resche-Rigon; THE MITOCHONDRIAL DEATH/LIFE REGULATOR IN APOPTOSIS AND NECROSIS. Annual Review of Physiology 1998, 60, 619-642, 10.1146/annurev.physiol.60.1.619.
- Derek J Hausenloy; Derek M. Yellon; The mitochondrial permeability transition pore: its fundamental role in mediating cell death during ischaemia and reperfusion.. Journal of Molecular and Cellular Cardiology 2003, 35, 339-41, 10.1016/s0022-2828(03)00043-9.
- Guido Kroemer; John C. Reed; Mitochondrial control of cell death. Nature Medicine 2000, 6, 513-519, 10.1038/74994.


