Your browser does not fully support modern features. Please upgrade for a smoother experience.
Submitted Successfully!
 +1 credit
Thank you for your contribution! You can also upload a video entry or images related to this topic.
For video creation, please contact our Academic Video Service.
| Version | Summary | Created by | Modification | Content Size | Created at | Operation |
|---|---|---|---|---|---|---|
| 1 | Elyakim BenHakoun | + 1213 word(s) | 1213 | 2022-01-14 09:06:31 | | | |
| 2 | Yvaine Wei | Meta information modification | 1213 | 2022-01-17 02:16:18 | | |
Video Upload Options
We provide professional Academic Video Service to translate complex research into visually appealing presentations. Would you like to try it?
Cite
If you have any further questions, please contact Encyclopedia Editorial Office.
Benhakoun, E. Trends in Emission of Marine Traffic Haifa Port. Encyclopedia. Available online: https://encyclopedia.pub/entry/18248 (accessed on 07 February 2026).
Benhakoun E. Trends in Emission of Marine Traffic Haifa Port. Encyclopedia. Available at: https://encyclopedia.pub/entry/18248. Accessed February 07, 2026.
Benhakoun, Elyakim. "Trends in Emission of Marine Traffic Haifa Port" Encyclopedia, https://encyclopedia.pub/entry/18248 (accessed February 07, 2026).
Benhakoun, E. (2022, January 14). Trends in Emission of Marine Traffic Haifa Port. In Encyclopedia. https://encyclopedia.pub/entry/18248
Benhakoun, Elyakim. "Trends in Emission of Marine Traffic Haifa Port." Encyclopedia. Web. 14 January, 2022.
Copy Citation
The vessel fleet calling at Israel ports mainly comprises vessels that have a lower engine tier grade (i.e., Tier 0 and 1), which is considered a heavy contributor to nitrogen oxide (NOx) pollution. The entry recommends an additional cost charged (selective tariff) to reflect the external social cost linked to the single vessel air pollution combined with supportive technological infrastructure and economic incentive tools (e.g., electric subsidy) to attract or influence vessel owners to assign vessels equipped with new engine tier grades for calls at Israeli ports.
Selective Tariff
Haifa Port Emission Inventory
Daily Port Emission Inventory
Port Emission Inventory
Haifa Bay Emission Inventory
Emission Selective Tariff
1. Introduction
1.1. Israel Ports
Israel seaports are responsible for more than 99% of Israel international trade in terms of export and import and around 80% in terms of value [1]. Israel’s main international trade ports are Haifa and Ashdod, as illustrated in Figure 1. All Israel ports are all currently (2021) publicly owned port companies except for the Haifa–Israel Shipyard company port and Eilat Port that are privately owned.
Haifa Port
The Port of Haifa was constructed in 1933 by the British Empire. Since 1948, it has been rebuilt and developed by the Israeli government. Haifa Port serves as one of the two main significant ports and economic bridges connecting Israel with the outside world. During 2010, under the port expansion program, it was resolved to open a new container terminal. The new Carmel Port dock provides an additional 700 m of quayage with a depth of 15.8 m which is capable of handling up to 14 K TEU size container vessels [2].
Located in the Middle East, Haifa Port serves both local and international trade interests (from Asia, Europe, America, Africa, etc.). The port was included in the Belt and Road initiative. As a result, an expansion program of Haifa Port is now underway and is expected to complete the construction of a newer container terminal. The HaMifratz Port dock, which is scheduled to open in late 2021. The new dock will feature an additional 800 m of quay-age with a depth of 17.3 m and will be capable of handling up to 15 K TEU size container vessels. Haifa’s new port is expected to enhance traffic at the port and to contribute to local economic growth.
Haifa Port includes container, bulk and general cargo (i.e., break-bulk), cruise and oil/liquid (included chemical) terminals. Haifa Port is located in a high-altitude terrain topography that surrounds the Haifa Bay area. The dominant wind direction is northwest to southeast, while in the summer the dominant wind direction shifts to southwest to northwest [3], as illustrated in Figure 2.
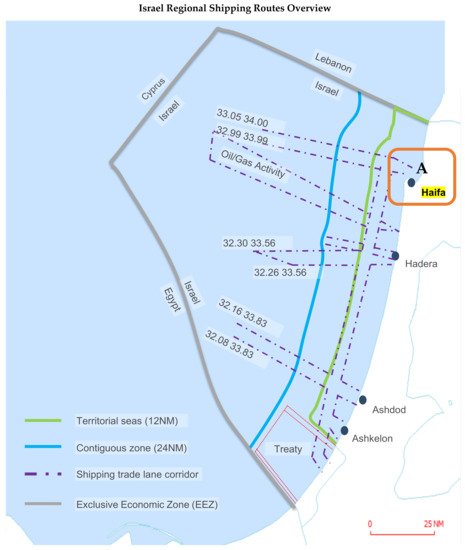
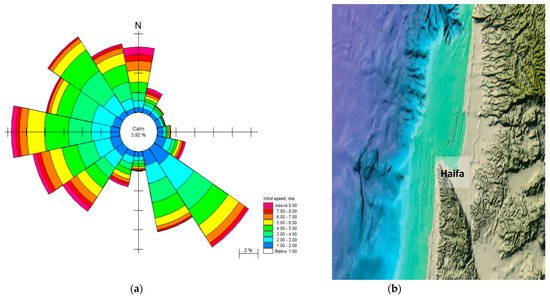
Figure 2. (a) Wind rose diagram based on 9 years of 10 min averaged wind observation at Haifa. (b) Haifa bay—Shaded Relief Map. Source: Wind Rose—CAMERI report PN 736 [3]; Haifa bay—Shaded Relief Map [6].
1.2. Claims and Contributions
This entry claims that on certain days, emissions arising from the port area exceed even the daily industrial zone limits. This entry makes an analogous claim that each area should be examined and managed as a collection of “flue gas stacks”, as shown in Figure 3. In addition, this entry claims that, due to the height of the flue gas stacks on board vessels, which are significantly lower compared to flue gas stacks installed in land-based plants, they may affect area air quality significantly more than the industrial zone. The latter are usually subject to extensive environmental emission regulations compared to vessels in port.
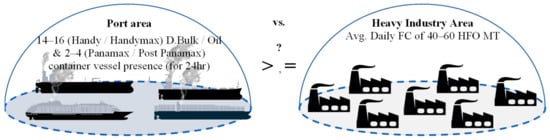
Figure 3. Emission level contribution; Vessel presences at port area vs. Heavy industry area. Source: Own composition.
2. Model Results
2.1. Port Emission Inventory and Maritime Transportation (Freight and Fleet) Trend Effect
While examining the emission inventory in ports and its magnitude in relation to the maritime transportation in Israeli ports, this study assumed that segmentation of each category of vessel to class could play a significant role in the calculation of port emission inventory. This factor could reflect changes in both freight, fleet size and emission trends.
Fleet Call Israel Ports
Findings from the Port Emission Inventory Model framework shows that between 2010 and 2018, the 5360 unique vessels of the merchandise fleet called at Israel’s main ports. This fleet is dominated by Tier 0 and Tier 1 engine grade, 36% and 48%, respectively, where Tier 2 and 3 totals 16%, as can be seen in Figure 4. These findings are based on the analysis of vessels’ technical characteristics and year of manufacture.
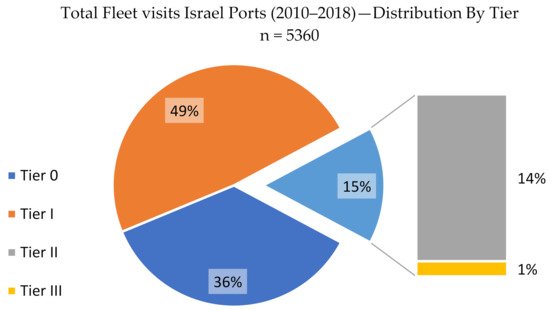
Figure 4. Fleet visit distribution by tier level—Israel ports—years 2010–2018.
Analysis of the Israel Navy and ASP datasets’ classification processes for the actual and predictive vessel size for this model framework made it possible to segment the current fleet into different category types and into different of classes of engine tier grade as shown in Figure 5.
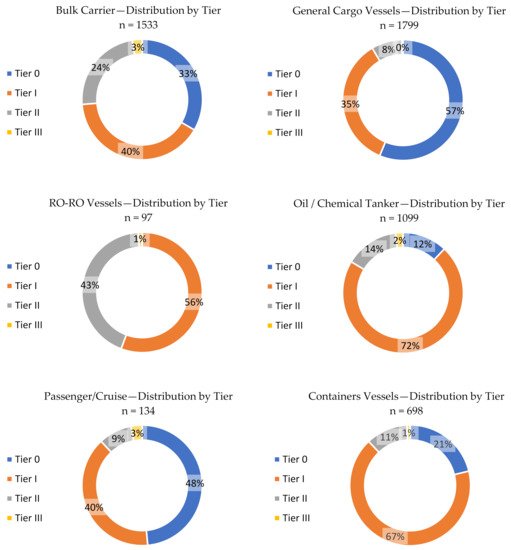
Figure 5. Vessel visit segmented by tier level and category type—Israel ports—years 2010–2018.
In terms of tier analysis per category, there is a similar ratio for the Tier 0 and Tier 1 engine grades for almost all vessels in different category types, except for the Bulk and RO-RO category, which shows a greater ratio for engine grade Tier 2 and 3.
2.2. Haifa Port Emission Inventory
Findings from the Port Emission Inventory Model framework show that container, general cargo, and oil tankers dominate Haifa vessel statistics port calls, as shown in Figure 6. The average annual statistic for port calls for the investigated periods is ~2600 unique visits. Furthermore, the results indicate an increase in the dry bulk, general cargo and container vessels’ port call statistics, in contrast to a decrease in the chemical tanker sector. The reduction in the chemical tanker sector can be explained due to the closing of the Haifa chemicals plant and its ammonia tank, which were the main players in this vessel sector.
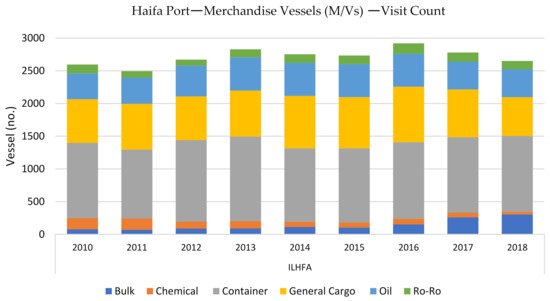
Figure 6. Haifa Port—merchandise vessels—visit count, segmented by vessel category, 2010–2018.
2.3. Haifa Port Emission Inventory
To better understand the magnitude of the vessel’s emissions during their port stay, a wide comparison analysis between all Haifa Bay emission sources is required. However, an additional technique could be considered, i.e., comparative assessments of annual emission inventories of all known sources of pollution in the Haifa Bay area. Therefore, a comparative assessment was made, comparing all known sources of cumulative emission inventory with Haifa Port vessels traffic.
Emission data regarding industrial sources are based on the Israel Ministry of Environmental Pollution (MoEP) Pollutant Release and Transfer Register (PRTR) inventory database for all emission sources. The database includes information for the years 2012–2018. Therefore, model findings were compared to the total emission pollution in the Haifa Bay area for each year in the Israel MoEP PRTR analysis period [7].
From an analysis of seven years of historical OGV maritime traffic in port and emission inventory performance, findings from the model indicate a gradual increase in the yearly inventory for the period 2012–2018, compared to Haifa industrial area’s similar period performance. The reduction trend described in Figure 7 is a result of the switching effort in Haifa Bay industrial plants to use clean, gas-based energy as their main energy source along with additional efforts to reduce CAC emission levels [8].
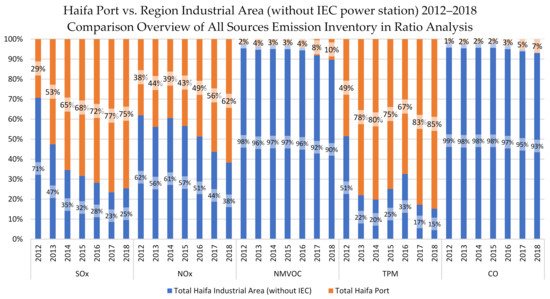
Figure 7. Haifa Port vs. Industrial area—comparison overview of all-source emission inventory in ratio analysis—segmented by emission type, 2012–2018. Remark: Haifa Port—Ocean Going Vessels (excluding Trailing Suction Hopper Dredger, 2016–2018). Remark: Israel Electric Corporation (IEC).
References
- Maritime Policy for Israel’s Mediterranean Waters 2018. Available online: https://www.gov.il/BlobFolder/generalpage/policy_maritime/he/Water_Energy_Communication_merhav_yami_english_v5.pdf (accessed on 21 November 2019).
- Haifa Port. Available online: https://www.haifaport.co.il/wp-content/uploads/2019/05/booklet-en.pdf (accessed on 21 November 2019).
- Levin, A.; Glozman, M.; Sladkevich, M.; Kroszynski, U.; Kit, E.; Drimer, N. Processing of Hydrographic Data for the Haifa Region. CAMERI Report. PN 737; CAMERI: Technion City, Haifa, Israel, 2012.
- CSA Ocean Sciences Inc. Environmental Impact Report for Production Drilling, Production Tests, and Completion—Leviathan Field; Stuart, FL, USA, 2016. Available online: https://www.gov.il/BlobFolder/generalpage/enviromental_info_file/he/Drill_EIA_leviathan_Mar_2016.pdf (accessed on 21 November 2019).
- Claus, S.; De Hauwere, N.; Vanhoorne, B.; Dias, F.S.; García, P.O.; Hernandez, F.; Mees, J. Maritime Boundaries Geodatabase: Maritime Boundaries and Exclusive Economic Zones (200NM). Integrated Marine Information System (IMIS). 2016. Available online: https://www.marineregions.org/ (accessed on 21 November 2019).
- John, K.H.; Calvo, R. PLATE XI: Digital Shaded Relief Maps of Israel; CYBAES: Princeton, Jerusalem, 2002; p. 2.
- MoEP—Israel. Israel MoEP PRTR Inventory Database. MoEP—Israel Ministry of Environmental Protection. 2020. Available online: https://www.gov.il/he/departments/publications/reports/prtr_report (accessed on 1 January 2020).
- MoEP—Israel. Haifa Bay Air Quality—Overview Years 2017–2018. 2019. Available online: https://www.gov.il/en/departments/news/haifa_bay_report_2015_to_2018 (accessed on 21 November 2019).
More
Information
Contributor
MDPI registered users' name will be linked to their SciProfiles pages. To register with us, please refer to https://encyclopedia.pub/register
:
View Times:
1.9K
Entry Collection:
Environmental Sciences
Revisions:
2 times
(View History)
Update Date:
17 Jan 2022
Table of Contents


Notice
You are not a member of the advisory board for this topic. If you want to update advisory board member profile, please contact office@encyclopedia.pub.
OK
Confirm
Only members of the Encyclopedia advisory board for this topic are allowed to note entries. Would you like to become an advisory board member of the Encyclopedia?
Yes
No
${ textCharacter }/${ maxCharacter }
Submit
Cancel
Back
Comments
${ item }
|
${ item.createdUser.fullName }
${ item.createdAt }
${ item.vote }
${ item.reply }
Delete
${ reply.createdUser.fullName }
${ reply.createdAt }
${ reply.vote }
Delete
There is no reply to this comment~
${ item.replyTextCharacter }/${ item.replyMaxCharacter }
Submit
Cancel
More
No more~
There is no comment~
${ textCharacter }/${ maxCharacter }
Submit
Cancel
${ selectedItem.replyTextCharacter }/${ selectedItem.replyMaxCharacter }
Submit
Cancel
Confirm
Are you sure to Delete?
Yes
No