Your browser does not fully support modern features. Please upgrade for a smoother experience.
Submitted Successfully!
 +1 credit
Thank you for your contribution! You can also upload a video entry or images related to this topic.
For video creation, please contact our Academic Video Service.
| Version | Summary | Created by | Modification | Content Size | Created at | Operation |
|---|---|---|---|---|---|---|
| 1 | Takemi Akahane | + 1574 word(s) | 1574 | 2021-11-09 07:01:57 | | | |
| 2 | Amina Yu | -17 word(s) | 1557 | 2021-11-19 09:57:43 | | |
Video Upload Options
We provide professional Academic Video Service to translate complex research into visually appealing presentations. Would you like to try it?
Cite
If you have any further questions, please contact Encyclopedia Editorial Office.
Akahane, T. Equol Production Status and Nonalcoholic Steatohepatitis. Encyclopedia. Available online: https://encyclopedia.pub/entry/16129 (accessed on 07 February 2026).
Akahane T. Equol Production Status and Nonalcoholic Steatohepatitis. Encyclopedia. Available at: https://encyclopedia.pub/entry/16129. Accessed February 07, 2026.
Akahane, Takemi. "Equol Production Status and Nonalcoholic Steatohepatitis" Encyclopedia, https://encyclopedia.pub/entry/16129 (accessed February 07, 2026).
Akahane, T. (2021, November 18). Equol Production Status and Nonalcoholic Steatohepatitis. In Encyclopedia. https://encyclopedia.pub/entry/16129
Akahane, Takemi. "Equol Production Status and Nonalcoholic Steatohepatitis." Encyclopedia. Web. 18 November, 2021.
Copy Citation
Equol is a metabolite of daidzein, a major soybean isoflavone with estrogenic and antioxidant activities. As the production of equol depends on the presence of certain members of the intestinal microflora, not all individuals can produce equol. Treatment with equol-rich soy product, SE5-OH markedly attenuated the development of liver fibrosis and the expression of alpha-smooth muscle actin in obese OLETF rats, and in the clinical study, the degree of fibrosis and ballooning in equol nonproducers was significantly higher than that of producers in women with NASH. In addition, the percentage of nonproducers with NAS ≥ 5 was significantly higher than that of producers in women with NASH.
equol
nonalcoholic steatohepatitis
estrogen
1. Introduction
Nonalcoholic fatty liver disease (NAFLD) is the most common chronic liver disease globally, representing a significant health burden worldwide. Briefly, NAFLD includes a broad range of conditions, including simple steatosis and nonalcoholic steatohepatitis (NASH) [1]. The pathophysiology of NASH is multifactorial, involving genetic and epigenetic factors, insulin resistance, adipose-derived hormones, and nutritional factors [2]. The most potent driver of NASH is lipotoxicity-induced hepatocyte death, which triggers inflammation and fibrosis, leading to cirrhosis or liver cancer.
After menopause, women have an increased risk of insulin resistance, hyperlipidemia, and visceral fat accumulation, all of which are known risk factors of NAFLD [3]. A higher incidence of NAFLD is found in postmenopausal women than in premenopausal women, as estrogen inhibits stellate cell activation and fibrogenesis, suggesting a correlation with the progression of NAFLD/NASH [4].
Soy-based foods, which are largely consumed in Asian countries, have become popular in non-Asian countries because of their beneficial effects on health. Equol, which is produced by the gut microbiota in the gastrointestinal tract, is a metabolite of daidzein, a major isoflavone found in soybean [5]. Equol has been reported to exert estrogenic activity, with an affinity for both ER alpha and ER beta estrogen receptors. Equol is superior to all other isoflavones in terms of its antioxidant activity [6]. As the production of equol depends on the presence of certain intestinal microflora, not all individuals have the ability to produce equol from the metabolism of isoflavones [7]. Only 25–30% of the adult population in Western countries can produce equol after consuming soy-based foods containing isoflavones [8][9][10]. This percentage is significantly lower than the reported 50–60% frequency of equol-producers in adults from Japan, Korea, and China [11][12][13], or Western adult vegetarians [14]. Usui et al. reported that the ratio of equol nonproducers in overweight or obese Japanese women was lower than the generally reported range [15]. Yoshikaka et al. reported that equol production was significantly associated with lower arterial stiffness and uric acid levels, and a high ratio of eicosapentaenoic acid to arachidonic acid in women in their 50s [16]. As NAFLD/NASH has been associated with both the visceral fat area and metabolic syndrome, and the incidence of NAFLD/NASH is known to increase after menopause in women, the ability to produce equol is expected to be related to the pathogenesis of NAFLD/NASH; however, to date, no relationship has been reported between them.
Otsuka Long-Evans Tokushima fatty (OLETF) rats develop multiple metabolic and hormonal abnormalities that have similar features as obesity in humans [17][18]. OLETF rats spontaneously develop obesity, hypertriglyceridemia, hyperglycemia, hyperinsulinemia, and insulin resistance.
2. Animal Study
SE5-OH Ameliorated Porcine-Serum-Induced Liver Fibrosis in OLETF Rats
Histological findings were evaluated after a 6-week treatment with porcine serum and SE5-OH. Porcine serum-induced hepatic fibrosis was ameliorated by SE5-OH treatment (Figure 1). Treatment with SE5-OH decreased αSMA-positive activated hepatic stellate cells (HSCs) (Figure 2).
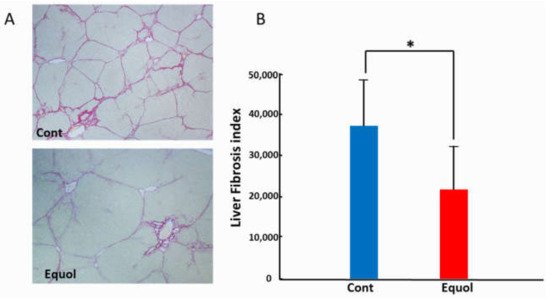
Figure 1. Effect of equol on the liver fibrosis development in the OLETF rats. (A) Representative sirius red staining photomicrographs of the liver in OLETF rats (original magnification, ×40). (B) Semi-quantitative analysis of the development of liver fibrosis by an image analyzer. Equol-rich soy product (SE5-OH) significantly suppressed liver fibrosis development. Data represent the mean ± SD values. * p < 0.01, indicating a significant difference between groups.
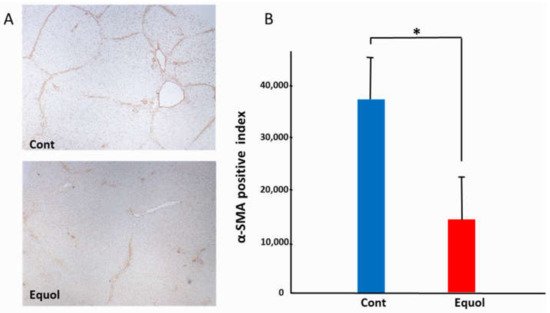
Figure 2. Effect of equol on the activated hepatic stellate cells (HSCs) in the OLETF rats. (A) Representative αSMA immunohistochemistry in OLETF rats (original magnification, ×40). (B) Semi-quantitative analysis of the αSMA-positive HSCs. The αSMA-positive cells were significantly suppressed by treatment with SE5-OH. Data represent the mean ± SD values. * p < 0.01, indicating a significant difference between groups.
3. Clinical Research
3.1. Subject Baseline Characteristics
Although the exact amount of soy products consumed is unknown, all NAFLD participants were in the habit of consuming soy products. We found that the number of equol nonproducers was 23 out of 38. The urine equol of all nonproducers was below the limit of quantitation. The prevalence of diabetes was shown to be significantly lower in nonproducers than in producers. We did not detect any significant differences in any of the other parameters tested between the two groups (Table 1). When subjects were stratified by sex, seven male (53%) and eight female (32%) patients were identified as equol producers. No significant differences were detected in any of the tested parameters between nonproducers and producers in men. We observed, however, that in women, the prevalence of diabetes was significantly lower, whereas the prevalence of dyslipidemia was higher, although not significantly different (p = 0.054) in nonproducers compared to producers (Table 2). Among nonproducers, fourteen patients (82.4%) were menopausal, two had irregular menstruation and one had amenorrhea. Among the producers, seven patients (87.5%) were menopausal, and the other was 46 years old and had undergone a total hysterectomy. There was no significant difference in the frequency of menopause between producers and non-producers. The mean age at menopause was 47.6 ± 6.2 years for nonproducers and 51.4 ± 1.0 years for producers, with no significant difference between them.
Table 1. Clinical characteristics of equol nonproducers and producers.
| Variable | Nonproducer (n = 23) | Producer (n = 15) | p-Value |
|---|---|---|---|
| Age (y) | 54.6 ± 15.0 | 60.4 ± 9.3 | 0.697 |
| Sex (Male/Female) | (6/17) | (7/8) | 0.191 |
| Equol (nmol/mL) | BLQ | 23.0 ± 34.2 | |
| Daidzein (nmol/mL) | 50.2 ± 46.1 | 12.0 ± 7.4 | 0.01 |
| Log (Equol/Daidzein) | - | 0.0 ± 0.75 | |
| Hypertension (%) | 11 (47.8) | 7 (46.7) | 0.944 |
| Dyslipidemia (%) | 11 (47.8) | 5 (33.3) | 0.376 |
| Diabetes Mellitus (%) | 11 (47.8) | 12 (80.0) | 0.047 |
| BMI (kg/m2) | 28.6 ± 4.2 | 28.5 ± 4.1 | 0.945 |
| Platelet count (×104/μL) | 20.3 ± 6.4 | 16.4 ± 5.5 | 0.062 |
| AST (IU/L) | 62.0 ± 26.7 | 62.3 ± 35.4 | 0.97 |
| ALT (IU/L) | 78.8 ± 45.4 | 73.0 ± 41.2 | 0.696 |
| Fasting glucose (mg/dL) | 103.6 ± 24.7 | 115.7 ± 30.0 | 0.205 |
| HOMA-IR | 5.8 ± 5.8 | 11.6 ± 11.1 | 0.129 |
| Ferritin | 173.5 ± 192.9 | 238.0 ± 128.0 | 0.278 |
| Type 4 collagen 7S (ng/mL) | 6.2 ± 3.1 | 6.0 ± 2.2 | 0.822 |
| P-III-P (U/mL) | 0.7 ± 0.3 | 0.7 ± 0.2 | 0.895 |
| FIB-4 index | 2.5 ± 1.6 | 3.3 ± 2.7 | 0.258 |
| APRI | 1.1 ± 0.7 | 1.5 ± 1.3 | 0.214 |
Values are n (%) or mean ± standard deviation. BMI, body mass index; AST, aspartate aminotransferase; ALT, alanine aminotransferase; HOMA-IR, homeostasis model assessment-insulin resistance, type III procollagen peptide; P-III-P, the aspartate aminotransferase to platelet ratio index; APRI, below the limit of quantitation; BLQ.
Table 2. Comparison of clinical characteristics between equol nonproducers and producers stratified by sex.
| Male | Female | |||||
|---|---|---|---|---|---|---|
| Variable | Nonproducer (n = 6) |
Producer (n = 7) |
p-Value | Nonproducer (n = 17) |
Producer (n = 8) |
p-Value |
| Age, y | 53.4 ± 17.9 | 56.0 ± 8.4 | 0.734 | 60.5 ± 14.0 | 64.1± 8.8 | 0.512 |
| Equol (nmol/mL) | BLQ | 34.3 ± 46.5 | BLQ | 11.7 ± 8.9 | ||
| Daidzein (nmol/mL) | 52.1 ± 41.7 | 10.7 ± 7.9 | 0.059 | 49.5 ± 48.9 | 13.4 ± 7.1 | 0.011 |
| Log (Equol/Daidzein) | - | 0.17 ± 0.73 | - | −0.2 ± 0.8 | ||
| Hypertension (%) | 3 (50.0) | 4 (57.1) | 0.797 | 8 (47.1) | 3 (37.5) | 0.653 |
| Dyslipidemia (%) | 2 (33.3) | 4 (57.1) | 0.391 | 9 (52.9) | 1 (12.5) | 0.054 |
| Diabetes Mellitus (%) | 4 (66.7) | 5 (71.4) | 0.853 | 7 (41.2) | 7 (87.5) | 0.03 |
| Menopause | - | - | - | 14 (82.4) | 7 (87.5) | 0.743 |
| BMI (kg/m2) | 28.9 ± 2.6 | 28.5 ± 3.7 | 0.852 | 28.5 ± 4.7 | 28.5 ± 4.7 | 0.997 |
| Platelet count (×104/μL) | 19.3 ± 4.9 | 17.6 ± 5.0 | 0.552 | 20.6 ± 6.9 | 15.4 ± 6.0 | 0.078 |
| AST (IU/L) | 60.2 ± 16.3 | 60.0 ± 24.3 | 0.989 | 62.6 ± 30.1 | 64.4 ± 44.7 | 0.907 |
| ALT (IU/L) | 94.5 ± 45.7 | 78.4 ± 45.6 | 0.54 | 73.2 ± 45.3 | 68.3 ± 39.4 | 0.797 |
| Fasting glucose (mg/dL) | 113.3 ± 40.7 | 129.9 ± 27.8 | 0.405 | 100.1 ± 16.5 | 103.3 ± 27.6 | 0.725 |
| HOMA-IR | 9.4 ± 9.8 | 16.7 ± 14.7 | 0.397 | 4.4 ± 2.9 | 8.6 ± 8.2 | 0.101 |
| Ferritin | 273.8 ± 352.4 | 242.6 ± 140.0 | 0.834 | 144.0 ± 117.2 | 233.4 ± 126.5 | 0.111 |
| Type 4 collagen 7S (ng/ML) | 4.8 ± 0.9 | 5.6 ± 2.9 | 0.634 | 6.5 ± 3.3 | 6.3 ± 1.7 | 0.853 |
| P-III-P (U/mL) | 0.8 ± 0.3 | 0.7 ± 0.2 | 0.831 | 0.7 ± 0.3 | 0.7 ± 0.2 | 0.803 |
| FIB-4 index | 1.9 ± 1.0 | 2.5 ± 1.1 | 0.414 | 2.7 ± 1.8 | 4.1 ± 3.5 | 0.317 |
| APRI | 1.1 ± 0.3 | 1.3 ± 0.6 | 0.495 | 1.1 ± 0.7 | 1.7 ± 1.7 | 0.358 |
Values are n (%) or mean ± standard deviation. BMI, body mass index; AST, aspartate aminotransferase; ALT, alanine aminotransferase; HOMA-IR, homeostasis model assessment-insulin resistance, type III procollagen peptide; P-III-P, the aspartate aminotransferase to platelet ratio index; APRI, below the limit of quantitation; BLQ.
3.2. Comparison of Pathological Features between Equol Nonproducers and Producers
It compared the four histological features of NAS (steatosis, lobular inflammation, hepatocellular ballooning, and fibrosis) between nonproducers and producers stratified by sex (Table 3), noticed that in men, none of the histological features were significantly different between nonproducers and producers. In contrast, we found that in women, the degree of fibrosis in nonproducers was significantly higher than that in producers. Although we did not observe any stage 4 fibrosis in producers, the percentage of stage 4 fibrosis in nonproducers was found to be 23.5%. Likewise, the degree of ballooning in nonproducers was shown to be significantly higher than that in producers, with the percentage of ballooning score 2 in nonproducers being 58.8%, whereas in producers the percentage was 12.5%.
Table 3. Comparison of pathological features between equol nonproducers and producers stratified by sex.
| Male | Female | |||||
|---|---|---|---|---|---|---|
| Nonproducer n, (%) |
Producer n, (%) |
p-Value | Nonproducer n, (%) |
Producer n, (%) |
p-Value | |
| Fibrosis stage | 0.292 | 0.047 | ||||
| 0 | 1, (16.7) | 0, (0) | 2, (11.8) | 0, (0) | ||
| 1 | 1, (16.7) | 0, (0) | 3, (17.6) | 0, (0) | ||
| 2 | 1, (16.7) | 1, (14.3) | 4, (23.5) | 7, (87.5) | ||
| 3 | 3, (50.0) | 3, (42.9) | 4, (23.5) | 1, (12.5) | ||
| 4 | 0, (0) | 3, (42.9) | 4, (23.5) | 0, (0) | ||
| Steatosis | 0.629 | 0.44 | ||||
| 1 | 0, (0) | 1, (14.3) | 6, (35.3) | 5, (62.5) | ||
| 2 | 5, (83.3) | 5, (71.4) | 7, (41.2) | 2, (25.0) | ||
| 3 | 1, (16.7) | 1, (14.3) | 4, (23.5) | 1, (12.5) | ||
| Lobular inflammation | 0.489 | 0.262 | ||||
| 0 | 0, (0) | 0, (0) | 1, (5.9) | 0, (0) | ||
| 1 | 2, (33.3) | 2, (28.6) | 5, (29.4) | 5, (62.5) | ||
| 2 | 3, (50.0) | 5, (71.4) | 11, (64.7) | 3, (37.5) | ||
| 3 | 1, (16.7) | 0, (0) | 0, (0) | 0, (0) | ||
| Ballooning | 0.612 | 0.03 | ||||
| 1 | 5, (83.3) | 5, (71.4) | 7, (41.2) | 7, (87.5) | ||
| 2 | 1, (16.7) | 2, (28.6) | 10, (58.8) | 1, (12.5) | ||
| NAS score | 0.292 | 0.084 | ||||
| 3 | 0, (0) | 1, (14.3) | 2, (11.8) | 3, (37.5) | ||
| 4 | 2, (33.3) | 0, (0) | 1, (5.9) | 3, (37.5) | ||
| 5 | 2, (33.3) | 4, (57.1) | 9, (52.9) | 1, (12.5) | ||
| 6 | 1, (16.7) | 2, (28.6) | 4, (23.5) | 1, (12.5) | ||
| 7 | 1, (16.7) | 0, (0) | 1, (5.9) | 0, (0) | ||
Compared the percentage of nonproducers and producers with NAS ≥ 5. Accordingly, It was found that in men, the percentage of nonproducers with NAS ≥ 5 was not significantly different from that in producers. However, in women, the percentage of nonproducers with NAS ≥ 5 was demonstrated to be significantly higher than that of producers (Figure 3).
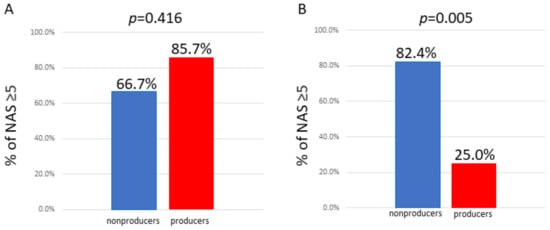
Figure 3. Comparison of the percentage of individuals with NAS ≥ 5 between equol nonproducers and producers. (A) Male; the percentage of nonproducers with NAS ≥ 5 was not significantly different from that in producers. (B) Female; the percentage of nonproducers with NAS ≥ 5 was significantly higher than that in producers.
3.3. Prediction Model for NAS ≥ 5 Using Decision Trees Analysis
To clarify the profiles associated with NAS ≥ 5, created a decision-tree algorithm, setting the following factors as independent variables: age, menopause, hypertension, dyslipidemia, diabetes mellitus, BMI, platelet count, fasting glucose, HOMA-IR, ferritin, type 4 collagen 7S, P-III-P, FIB-4, APRI, and equol producers. Among the factors expected to predict NAS ≥ 5, we selected equol producers as the initial distinguishable factor for NAS ≥ 5 in women. It observed a NAS ≥ 5 in 25% of equol producers. In contrast, a NAS ≥ 5 was identified in 82% of equol nonproducers. Fasting glucose was demonstrated to be the second most distinguishable factor among equol nonproducers, observed a NAS ≥ 5 in 93% of nonproducers with fasting glucose levels >84 mg/dL. In contrast, none of the nonproducer patients with fasting glucose ≤ 84 mg/dL was found to have a NAS ≥ 5 (Figure 4). The mean fasting glucose levels were not significantly different between equol nonproducers with NAS ≥ 5 (103.1 ± 15.4 mg/dL) and those with NAS < 5 (88.0 ± 16.6 mg/dL) (p = 0.143).
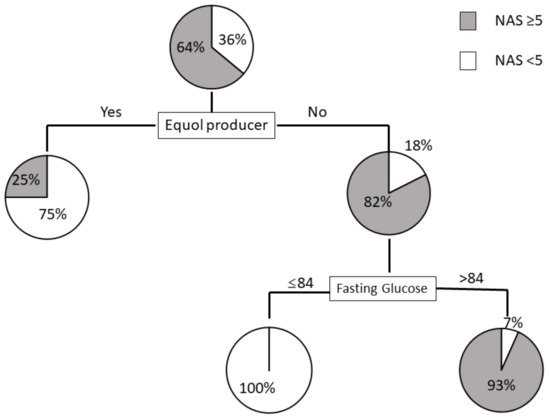
Figure 4. Decision tree analysis of factors predicting NAS ≥ 5 in women. Pie graphs indicate the proportions of patients with NAS ≥ 5 and NAS < 5.
References
- Younossi, Z.; Tacke, F.; Arrese, M.; Chander Sharma, B.; Mostafa, I.; Bugianesi, E.; Wai-Sun Wong, V.; Yilmaz, Y.; George, J.; Fan, J.; et al. Global Perspectives on Nonalcoholic Fatty Liver Disease and Nonalcoholic Steatohepatitis. Hepatology 2019, 69, 2672–2682.
- Peng, C.; Stewart, A.G.; Woodman, O.L.; Ritchie, R.H.; Qin, C.X. Non-Alcoholic Steatohepatitis: A Review of Its Mechanism, Models and Medical Treatments. Front. Pharmacol. 2020, 11, 603926.
- Lovejoy, J.C.; Champagne, C.M.; de Jonge, L.; Xie, H.; Smith, S.R. Increased visceral fat and decreased energy expenditure during the menopausal transition. Int. J. Obes. (Lond.) 2008, 32, 949–958.
- Yang, J.D.; Abdelmalek, M.F.; Pang, H.; Guy, C.D.; Smith, A.D.; Diehl, A.M.; Suzuki, A. Gender and menopause impact severity of fibrosis among patients with nonalcoholic steatohepatitis. Hepatology 2014, 59, 1406–1414.
- Xu, X.; Harris, K.S.; Wang, H.J.; Murphy, P.A.; Hendrich, S. Bioavailability of soybean isoflavones depends upon gut microflora in women. J. Nutr. 1995, 125, 2307–2315.
- Setchell, K.D.; Brown, N.M.; Lydeking-Olsen, E. The clinical importance of the metabolite equol-a clue to the effectiveness of soy and its isoflavones. J. Nutr. 2002, 132, 3577–3584.
- Setchell, K.D.; Clerici, C. Equol: History, chemistry, and formation. J. Nutr. 2010, 140, 1355S–1362S.
- Lampe, J.W.; Karr, S.C.; Hutchins, A.M.; Slavin, J.L. Urinary equol excretion with a soy challenge: Influence of habitual diet. Proc. Soc. Exp. Biol. Med. 1998, 217, 335–339.
- Atkinson, C.; Frankenfeld, C.L.; Lampe, J.W. Gut bacterial metabolism of the soy isoflavone daidzein: Exploring the relevance to human health. Exp. Biol. Med. (Maywood) 2005, 230, 155–170.
- Rowland, I.R.; Wiseman, H.; Sanders, T.A.; Adlercreutz, H.; Bowey, E.A. Interindividual variation in metabolism of soy isoflavones and lignans: Influence of habitual diet on equol production by the gut microflora. Nutr. Cancer 2000, 36, 27–32.
- Watanabe, S.; Yamaguchi, M.; Sobue, T.; Takahashi, T.; Miura, T.; Arai, Y.; Mazur, W.; Wähälä, K.; Adlercreutz, H. Pharmacokinetics of soybean isoflavones in plasma, urine and feces of men after ingestion of 60 g baked soybean powder (kinako). J. Nutr. 1998, 128, 1710–1715.
- Arai, Y.; Uehara, M.; Sato, Y.; Kimira, M.; Eboshida, A.; Adlercreutz, H.; Watanabe, S. Comparison of isoflavones among dietary intake, plasma concentration and urinary excretion for accurate estimation of phytoestrogen intake. J. Epidemiol. 2000, 10, 127–135.
- Song, K.B.; Atkinson, C.; Frankenfeld, C.L.; Jokela, T.; Wähälä, K.; Thomas, W.K.; Lampe, J.W. Prevalence of daidzein-metabolizing phenotypes differs between Caucasian and Korean American women and girls. J. Nutr. 2006, 136, 1347–1351.
- Setchell, K.D.; Cole, S.J. Method of defining equol-producer status and its frequency among vegetarians. J. Nutr. 2006, 136, 2188–2193.
- Usui, T.; Tochiya, M.; Sasaki, Y.; Muranaka, K.; Yamakage, H.; Himeno, A.; Shimatsu, A.; Inaguma, A.; Ueno, T.; Uchiyama, S.; et al. Effects of natural S-equol supplements on overweight or obesity and metabolic syndrome in the Japanese, based on sex and equol status. Clin. Endocrinol. (Oxf.) 2013, 78, 365–372.
- Yoshikata, R.; Myint, K.Z.; Ohta, H. Relationship between equol producer status and metabolic parameters in 743 Japanese women: Equol producer status is associated with antiatherosclerotic conditions in women around menopause and early postmenopause. Menopause 2017, 24, 216–224.
- Kawano, K.; Hirashima, T.; Mori, S.; Saitoh, Y.; Kurosumi, M.; Natori, T. Spontaneous long-term hyperglycemic rat with diabetic complications. Otsuka Long-Evans Tokushima Fatty (OLETF) strain. Diabetes 1992, 41, 1422–1428.
- Wanezaki, S.; Saito, S.; Inoue, N.; Tachibana, N.; Shirouchi, B.; Sato, M.; Yanagita, T.; Nagao, K. Soy β-Conglycinin Peptide Attenuates Obesity and Lipid Abnormalities in Obese Model OLETF Rats. J. Oleo Sci. 2020, 69, 495–502.
More
Information
Subjects:
Gastroenterology & Hepatology
Contributor
MDPI registered users' name will be linked to their SciProfiles pages. To register with us, please refer to https://encyclopedia.pub/register
:
View Times:
598
Revisions:
2 times
(View History)
Update Date:
19 Nov 2021
Table of Contents


Notice
You are not a member of the advisory board for this topic. If you want to update advisory board member profile, please contact office@encyclopedia.pub.
OK
Confirm
Only members of the Encyclopedia advisory board for this topic are allowed to note entries. Would you like to become an advisory board member of the Encyclopedia?
Yes
No
${ textCharacter }/${ maxCharacter }
Submit
Cancel
Back
Comments
${ item }
|
${ item.createdUser.fullName }
${ item.createdAt }
${ item.vote }
${ item.reply }
Delete
${ reply.createdUser.fullName }
${ reply.createdAt }
${ reply.vote }
Delete
There is no reply to this comment~
${ item.replyTextCharacter }/${ item.replyMaxCharacter }
Submit
Cancel
More
No more~
There is no comment~
${ textCharacter }/${ maxCharacter }
Submit
Cancel
${ selectedItem.replyTextCharacter }/${ selectedItem.replyMaxCharacter }
Submit
Cancel
Confirm
Are you sure to Delete?
Yes
No