Your browser does not fully support modern features. Please upgrade for a smoother experience.
Submitted Successfully!
 +1 credit
Thank you for your contribution! You can also upload a video entry or images related to this topic.
For video creation, please contact our Academic Video Service.
| Version | Summary | Created by | Modification | Content Size | Created at | Operation |
|---|---|---|---|---|---|---|
| 1 | ANA PAULA CAMARGO LAROCCA | + 2013 word(s) | 2013 | 2021-09-24 08:14:11 | | | |
| 2 | Vicky Zhou | Meta information modification | 2013 | 2021-09-24 15:54:04 | | |
Video Upload Options
We provide professional Academic Video Service to translate complex research into visually appealing presentations. Would you like to try it?
Cite
If you have any further questions, please contact Encyclopedia Editorial Office.
Larocca, A. Intelligent Transport Systems. Encyclopedia. Available online: https://encyclopedia.pub/entry/14542 (accessed on 07 February 2026).
Larocca A. Intelligent Transport Systems. Encyclopedia. Available at: https://encyclopedia.pub/entry/14542. Accessed February 07, 2026.
Larocca, Ana. "Intelligent Transport Systems" Encyclopedia, https://encyclopedia.pub/entry/14542 (accessed February 07, 2026).
Larocca, A. (2021, September 24). Intelligent Transport Systems. In Encyclopedia. https://encyclopedia.pub/entry/14542
Larocca, Ana. "Intelligent Transport Systems." Encyclopedia. Web. 24 September, 2021.
Copy Citation
Intelligent transport systems enable vehicles to communicate with each other and with the environment, ensuring road safety. Their implementation can help reduce the number of accidents, especially in stretches of s-curves, where speed control is essential to ensure the safety of drivers, and under hazardous weather conditions. Such systems promptly notify drivers about potentially dangerous road conditions, such as fog, so that they can better adapt their driving behavior.
connected-vehicle
driving simulator
fog
speed profile
warning-system
1. Introduction
Intelligent Transport Systems (ITS), based on connected vehicles communication, help drivers take actions from externally acquired information by, for example warning them of a potentially dangerous situation to be avoided by automatic braking or automatic steering. The development of information technology promotes traffic efficiency and safety through real-time information interaction between vehicles (V2V) and vehicles and infrastructure (V2I).
External factors like weather conditions impact roadway situations and traffic safety [1], and adverse phenomena, such as fog reduce visibility, contributing to traffic crashes. Fog increases the risk of accidents since it hides long-range visual information and hampers the prediction of the path to be taken and events (e.g., pileups or vehicle decelerations) [2].
In Brazil, according to the annual traffic statistics of road traffic crashes issued by the federal highway patrol, fog was a probable cause for 11,753 accidents between 2011 and 2020, which represent 5% of the total number of crashes occurred under adverse weather conditions (rain, fog, snow, strong wind, etc.) [3]. Although the percentage of accidents under fog is smaller than those under normal visibility conditions, they tend to be more severe and involve multiple vehicles [1][4][5].
According to Mueller and Trick [6], reduced visibility increases the risk of collision. However, not all drivers are affected in the same way—some are more likely to make safety-related adaptations, which can be measured primarily by speed compensation and ability to follow a car or stay in the lane. Speed compensation is the most typical adjustment to driving behavior under fog conditions. Previous studies have confirmed drivers tend to make safety-related adaptations, such as slowing down, to compensate for insecurity due to the limited visual field [7][8].
However, a study with a driving simulator conducted by Yan et al. [9] confirmed driver’s reduction in speed under low-visibility conditions is not enough to respond in time to impending changes in road geometries, speed variation of vehicles ahead, and an emergency event. Although some drivers would keep longer headway distances, rear-end crashes may still occur, since they may not be able to see the breaking lights of the front vehicle [10].
Efforts have been devoted to solving the traffic safety problems in a fog area. The warning system that alerts drivers about a fog location helps them improve their speed adjustment before entering the fog zone. The most typical warning systems that provide drivers with real-time traffic alerts are located in the highway infrastructure Dynamic Message Sign (DMS), and inside Connected Vehicles (CV), called in-vehicle information systems. Liu and Khattak [11] claim vehicles sharing their status information with other vehicles or with the infrastructure leads to better-planned actions during driving, earlier identification of hazards, and safer responses.
Several studies on DMSs in fog situations have been conducted. Using a driving simulator, Boyle and Mannering [12] analyzed drivers’ speed adjustments under four different scenarios of advisory information under foggy conditions. According to the findings, although warning messages lead to significant speed reductions in the low-visibility area, drivers tend to increase speed downstream, when such adverse conditions no longer exist. Al-Ghamdi [13] studied traffic crashes caused by fog and concluded although the DMS warning system was ineffective in reducing speed variability, the mean speed was reduced by approximately 6.5 kph in fog sections. Wu et al. [10] conducted an empirical driving simulator study to assess the effectiveness of real-time fog warning systems, and the results showed drivers are more likely to reduce their speed or brake harder under thicker fog.
In recent years, due to the significant development of CV technology, investigations into the effectiveness of V2V systems have increased. Zhao et al. [14] used a connected vehicle test platform to analyze the speed adjustment of drivers after receiving warning information at different fog concentrations. The results indicated the warning system effectively led to speed reductions in all fog scenarios. Chang et al. [15] used a fixed-based driving simulator to investigate the effectiveness of fog warning systems in driving performance. According to the results, scenarios with fog warning systems significantly improved safety due to speed reduction prior to a fog area over the no warning system scenario. Wu et al. [16] conducted a driving simulator study to evaluate the effectiveness of the Head-Up Display (HUD) warning system in drivers’ braking behaviors. The results indicated the system can help decrease drivers’ reaction time and reduce the probability of accidents.
The information exchange between the CV technology and the driver is critical content to be studied, especially due to the benefits it can offer to highway management, reducing investments for the elimination of stretches with high accident indexes like s-curves (i.e., complex curves with a generally small radius and short tangent) [17].
The road geometry of curves is complex, thus hampering driving and often violating a driver’s expectations. Milosevic and Milic [18] investigated drivers’ perception of vehicle speed in curves and reported drivers tend to underestimate their speed. Speed underestimation on curved roads can significantly contribute to sudden speed variations, hence, accidents. Good accident-prevention measures must, therefore, be selected according to the characteristics of the curves for preventing drivers from misperceiving their speed.
Although previous studies have analyzed the effects of fog warning systems on drivers’ speed maneuvers, few have compared drivers’ behaviors while driving in curved segments in different weather scenarios.
Multiple ADAS implementation positively impacts drivers’ behavior but still lacks the ability to address some issues when there is foggy weather condition by assessing the relationship between human behavior and a single ADAS (fog warning system). This research analyzes the effects of an in-vehicle fog warning on a driver’s speed profile on a stretch of road with critical geometric (s-curves) and weather (fog) conditions. An experiment conducted in a driving simulator considered the benefits of its use since it helps evaluations of the effectiveness of inclement weather warning technologies due to their capacity to provide real-world scenarios at a relatively low cost (compared to real-world experiments) and no risks to the driver’s life [19].
Countries have different climates, traffic compositions, and road geometries, and these different characteristics may influence driving behavior. A broad understanding of low visibility driving behavior in different countries can help researchers and designers improve road safety through more effective safety measures.
2. Effects of Fog in a Brazilian Road Segment Analyzed by a Driving Simulator for Sustainable Transport: Drivers’ Speed Profile under In-Vehicle Warning Systems
2.1. General Results
Figure 1 shows the color path of all participants’ average speed changes in each scenario—the speed along the curve was not constant and was adjusted according to the curve geometry, as observed by Li et al. [17]. The average speed was higher before and after C6 in the clear weather scenario compared to other scenarios. The color path figure (Figure 1) is consistent with the graphic displayed in Figure 2, where the comparison of speeds between scenarios is easier. After C6, the speed is significantly decreased in the three scenarios, due to the influence of the road geometry. In presence of fog, the speed decrease was greater in the scenario with CV warning.
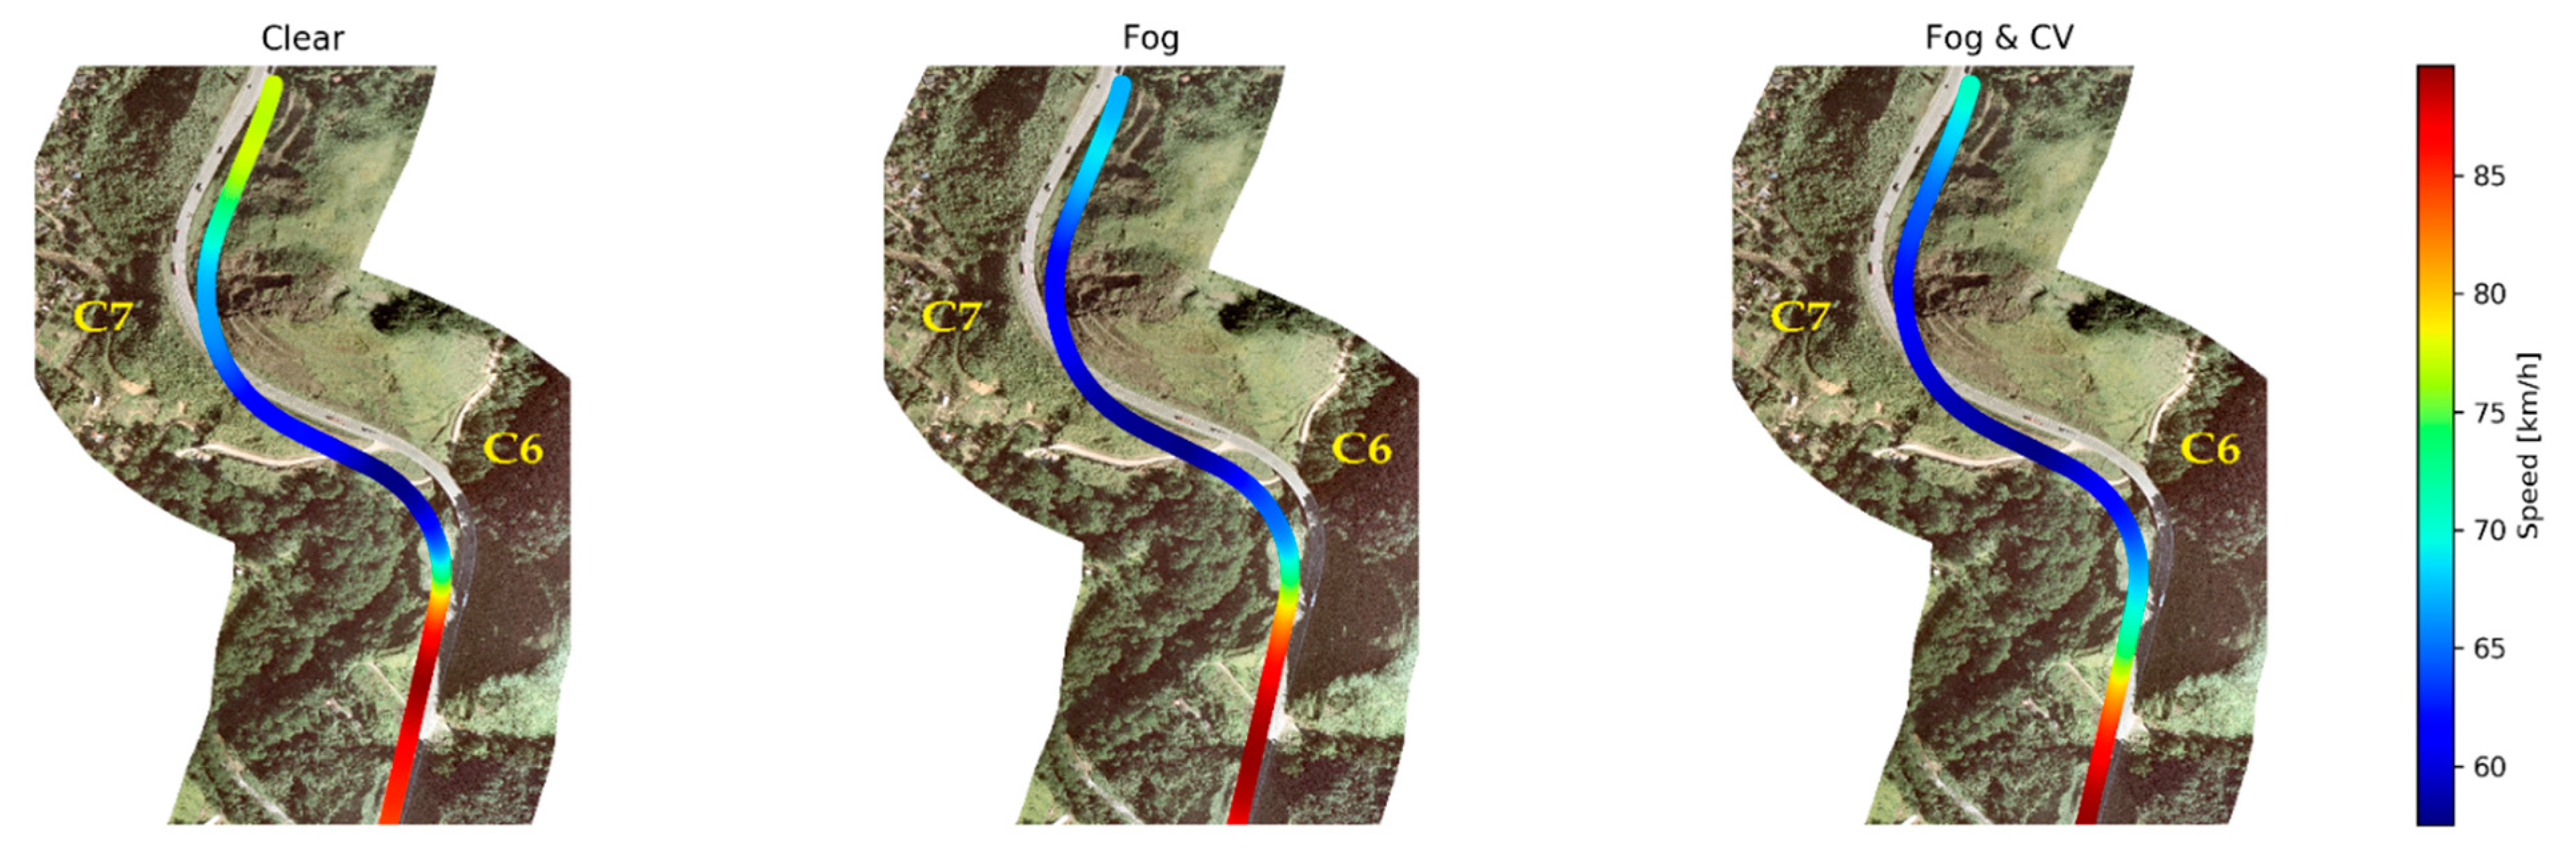
Figure 1. Color path of all participants´ average speeds (km/h) when performing the 6th curve (C6) and 7th curve (C7) in each scenario.
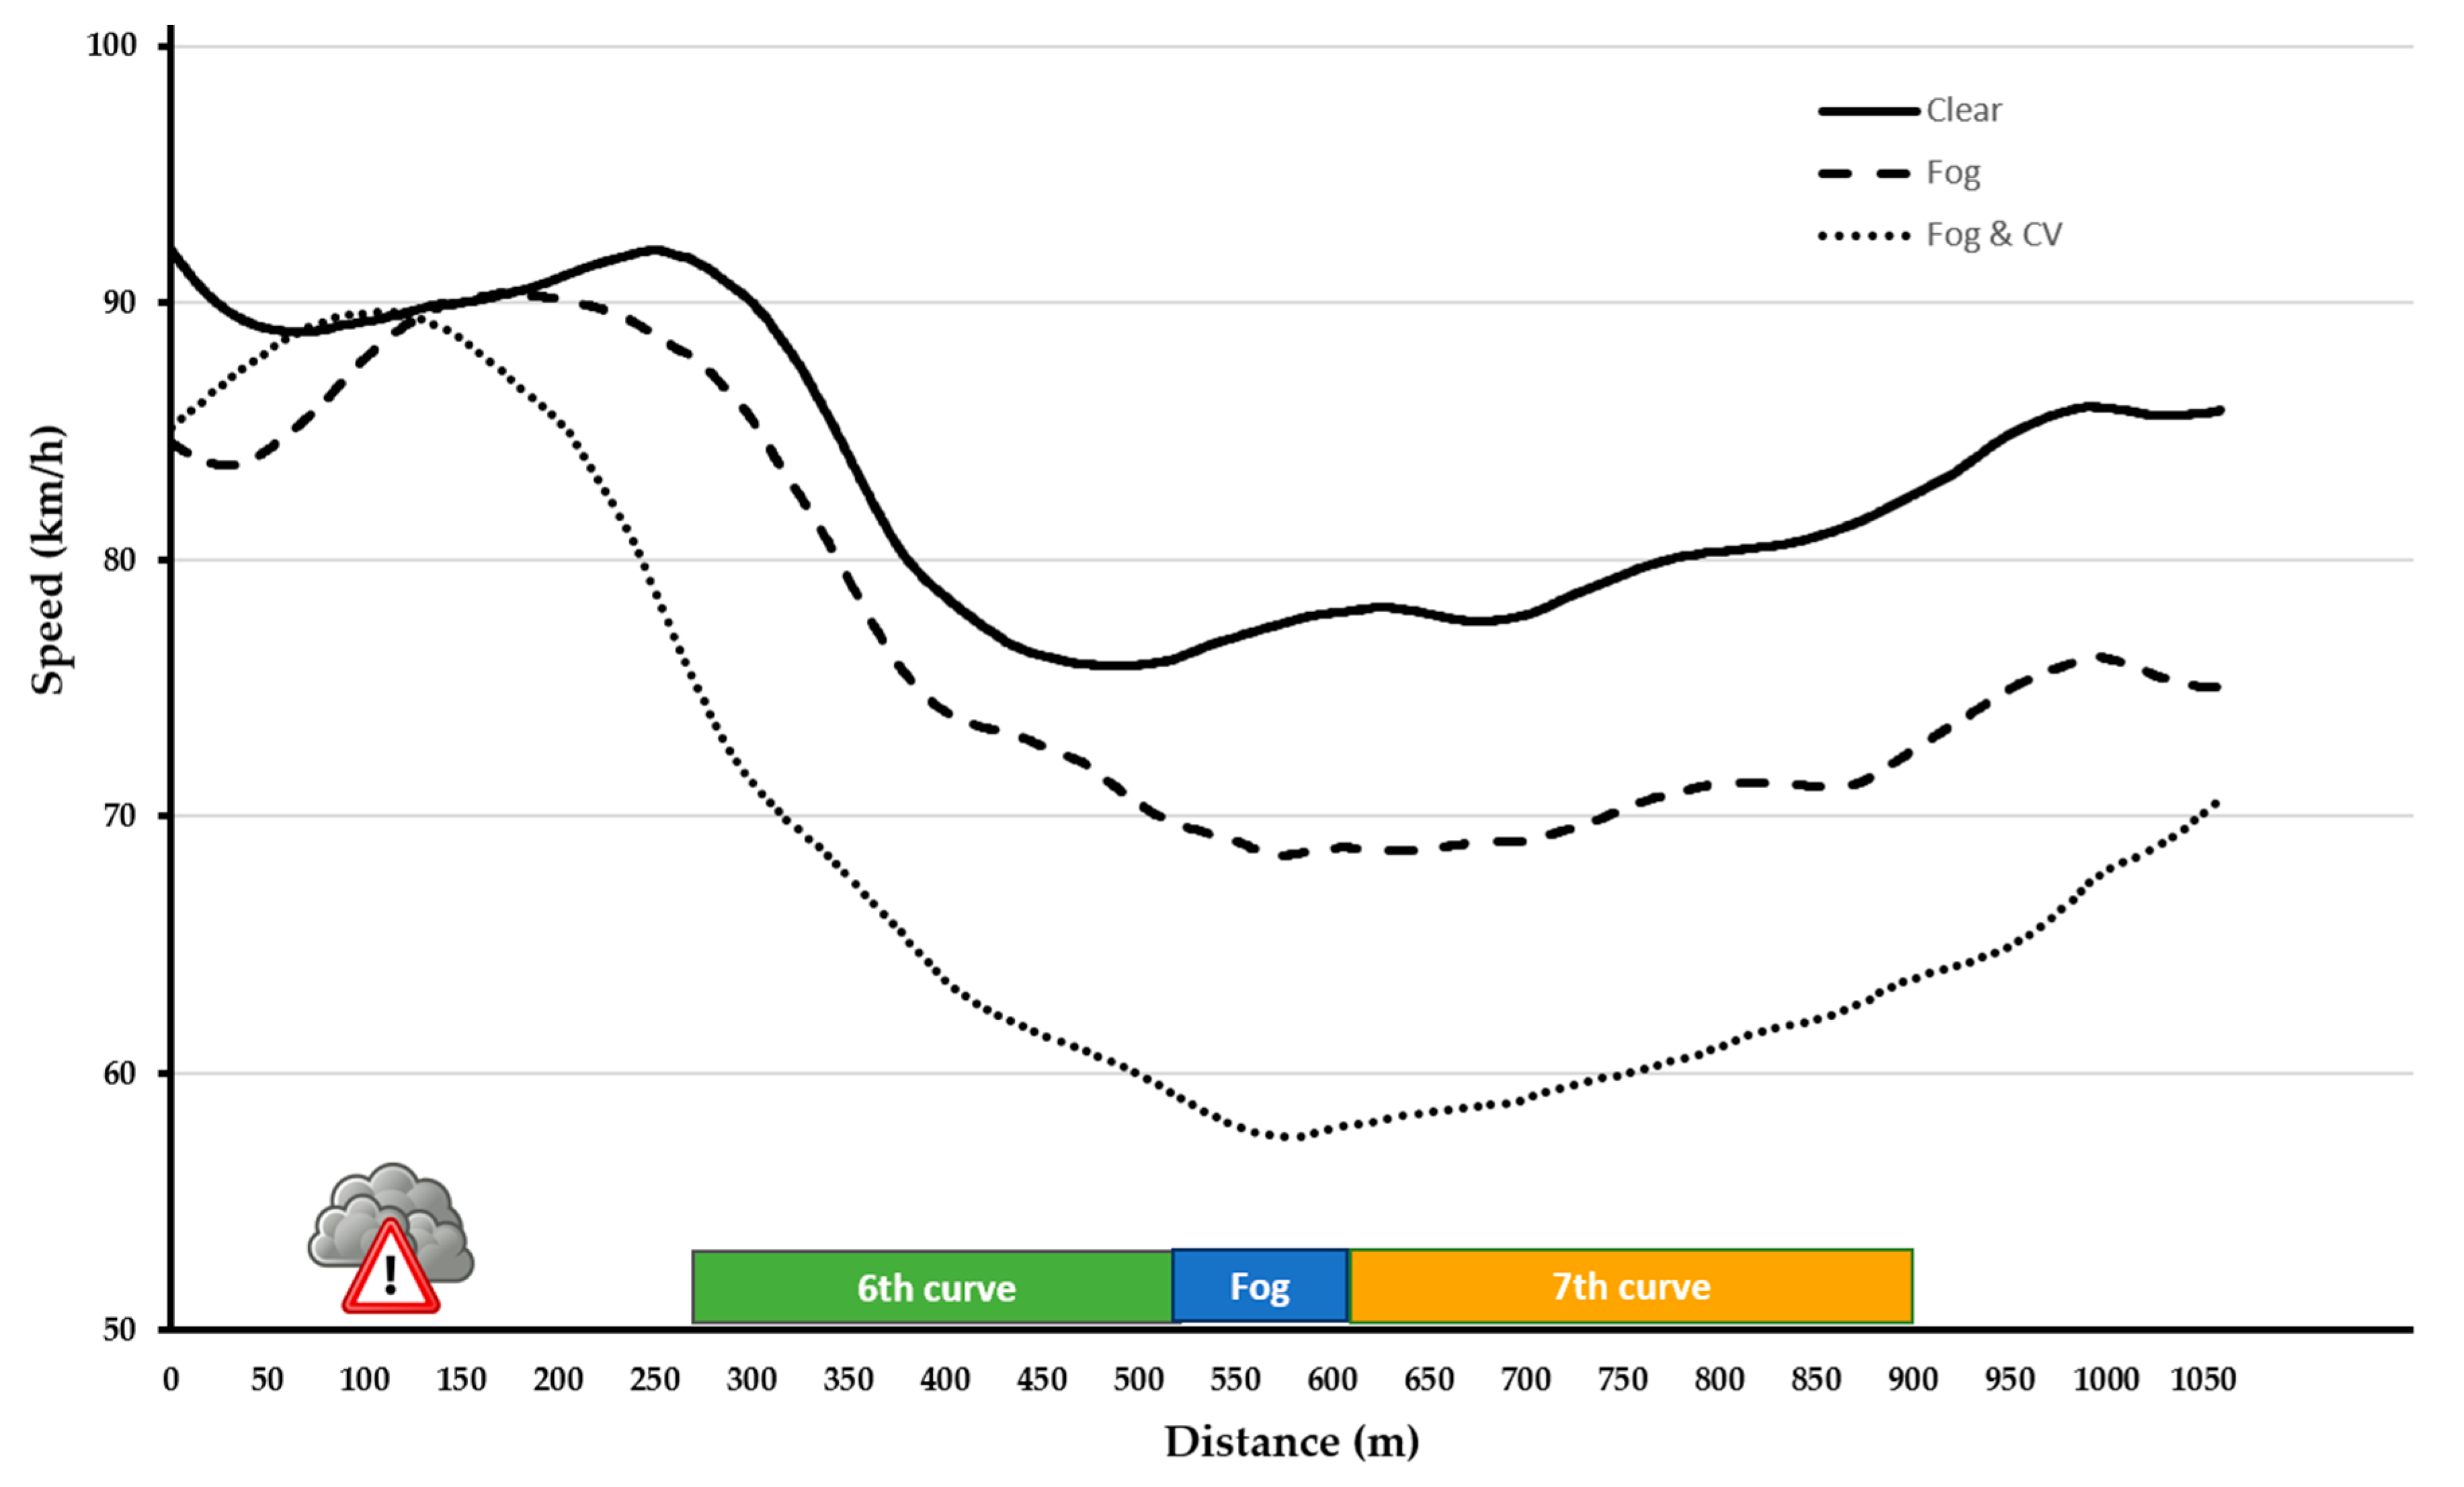
Figure 2. Comparison of all participants’ average speeds (km/h) in each scenario.
2.2. Summary Statistics
The average speeds at which the participants drove under clear weather in the simulator were 92.1 km/h before C6 and 77.8 km/h after C6. The average speeds driven under fog weather were 88.7 km/h before C6, and 68.6 km/h after C6. Finally, in the fog & CV scenario, the average driving speeds were 78.8 km/h before C6 and 57.5 km/h after C6. Table 1 shows the means and standard deviations speeds.
Table 1. Speed mean and standard deviation before and after C6 per scenario.
| Scenario | Speed (km/h) | |||
|---|---|---|---|---|
| Before C6 | After C6 | |||
| Mean | SD * | Mean | SD * | |
| Clear | 92.1 | 6.3 | 77.8 | 10.4 |
| Fog | 88.7 | 10.1 | 68.6 | 8.8 |
| Fog & CV | 78.8 | 16.1 | 57.5 | 10.9 |
* SD = Standard deviation.
2.3. Two-Way Repeated Measures ANOVA
Two-way ANOVA with repeated measures analyzed the average speed variations during the experiment before and after C6 and its interaction with the scenarios (Within Subjects Effects) shown in Table 2. The scenarios interaction (Between Subjects Effects) was also analyzed and is shown in Table 3. The hypothesis testing in the analysis was based on a 0.05 significance level.
Table 2. Repeated Measures ANOVA for within-subjects effects.
| Source | Sum of Squares | df | Mean Square | F | p | |
|---|---|---|---|---|---|---|
| C6 moment | * | 12,984 | 1 | 12,984 | 217.63 | <0.001 |
| C6 moment × Scenario | 830 | 2 | 415 | 6.96 | 0.002 | |
| Residual | 4833 | 81 | 59.7 | - | - | |
Note. Type 3 Sums of Squares. (*) interaction between scenario and moment in 6th curve.
Table 3. Repeated Measures ANOVA for between-subjects effects.
| Source | Sum of Squares | df | Mean Square | F | p |
|---|---|---|---|---|---|
| Scenario | 9452 | 2 | 4726 | 27.1 | <0 .001 |
| Residual | 14,146 | 81 | 175 | - | - |
Note. Type 3 Sums of Squares.
Both Clear/Fog/Fog&CV [F (2, 81) = 27.1; p < 0.001] and the curve moment (After/Before) [F (1, 81) = 217.63; p < 0.001] significantly influenced the average speed. The analyses also revealed an effect of the interaction between scenario and curve moment on speed [F (2, 81) = 6.96; p = 0.002]. Post hoc comparisons were performed with a Tukey test for identifying differences (Table 4).
Table 4. Post Hoc Comparisons—C6 moment × Scenario.
| Comparison | M * | SE | df | t | ptukey | |||
|---|---|---|---|---|---|---|---|---|
| C6 Moment | Scenario | C6 Moment | Scenario | |||||
| Before | Clear | Before | Fog | 3.41 | 2.89 | 130.6 | 1.178 | 0.847 |
| - | - | Before | Fog & CV | 13.35 | 2.89 | 130.6 | 4.614 | < 0.001 |
| - | - | After | Clear | 11.33 | 2.06 | 81.0 | 5.487 | <0 .001 |
| - | - | After | Fog | 23.57 | 2.89 | 130.6 | 8.149 | < 0.001 |
| - | - | After | Fog & CV | 34.60 | 2.89 | 130.6 | 11.960 | <0.001 |
| - | Fog | Before | Fog & CV | 9.94 | 2.89 | 130.6 | 3.436 | 0.010 |
| - | - | After | Clear | 7.92 | 2.89 | 130.6 | 2.738 | 0.075 |
| - | - | After | Fog | 20.17 | 2.06 | 81.0 | 9.769 | <0.001 |
| - | - | After | Fog & CV | 31.19 | 2.89 | 130.6 | 10.783 | <0.001 |
| - | Fog & CV | After | Clear | −2.02 | 2.89 | 130.6 | −0.698 | 0.982 |
| - | - | After | Fog | 10.23 | 2.89 | 130.6 | 3.536 | 0.007 |
| - | - | After | Fog & CV | 21.25 | 2.06 | 81.0 | 10.295 | <0.001 |
| After | Clear | After | Fog | 12.25 | 2.89 | 130.6 | 4.234 | <0.001 |
| - | - | After | Fog & CV | 23.27 | 2.89 | 130.6 | 8.045 | <0.001 |
| - | Fog | After | Fog & CV | 11.02 | 2.89 | 130.6 | 3.811 | 0.003 |
* M = Mean difference; SE = Standard Error; df = Degrees of freedom.
3. Conclusions
This study aims at spurring safety improvements in regions of visibility problems caused by fog, reducing their environmental impact, and preserving drivers’ lives.
A two-way ANOVA with repeated measures revealed both fog and in-vehicle fog warning systems can effectively reduce drivers´ driving speed. According to a paired comparison with Tukey’s correction, the warning shown on the HUD led to an earlier speed reduction in the Fog&CV scenario. The average driving speeds reduced from 78.8 km/h before C6 to 57.5 km/h after C6, which represents a reduction of approximately 27%. This reduction before and after the curve is more significant than the reductions of 15.5% and 22.7% observed in the clear and fog scenarios, respectively. Therefore, a vehicle with an in-vehicle warning system enables drivers to drive at lower speeds in a fog region.
Although in fog weather drivers tend to drive more cautiously and at lower speeds, this is not sufficient to compensate for the hazards imposed by adverse weather. A CV technology would substantially improve road safety since drivers would better adjust speed to enter a fog zone and proceed to a successive curve.
An in-vehicle warning system can improve the speed profile of drivers performing s-curves. Efficient CV technologies would lead to lower-cost changes in road safety in comparison to those in the highway infrastructure.
Connected vehicles technologies can potentially transform our way to drive. However, prior to their broad implementation, several technical challenges must be overcome.
Countries and regions must harmonize their research, standards, policies, and technology; the use of different communications standards, for instance, will hamper the application of connected vehicle technology, since the one used in a certain region may not work in another.
Such technology can also decrease crash risk through the incorporation of drivers’ personal characteristics in warning systems, and improve traffic safety under fog conditions. This study was limited to analyzing the drivers’ speed profile to detect differences due to the use of a single ADAS. Future research should investigate the effects of different delivery times of warning messages under fog conditions, different designs of the head-up display, and the implementation of multiple ADAS combined.
References
- Hassan, H.M.; Abdel-Aty, M. Analysis of drivers’ behavior under reduced visibility conditions using a Structural Equation Modeling approach. Transp. Res. Part F Traffic Psychol. Behav. 2011, 14, 614–625.
- Rosey, F.; Aillerie, I.; Espié, S.; Vienne, F. Driver behaviour in fog is not only a question of degraded visibility—A simulator study. Saf. Sci. 2017, 95, 50–61.
- DPRF Dados Abertos das Rodovias Federais. Available online: https://www.prf.gov.br/portal/dados-abertos (accessed on 13 June 2021).
- Park, J.; Abdel-Aty, M.; Wu, Y.; Mattei, I. Enhancing In-Vehicle Driving Assistance Information Under Connected Vehicle Environment. IEEE Trans. Intell. Transp. Syst. 2019, 20, 3558–3567.
- Wu, Y.; Abdel-Aty, M.; Cai, Q.; Lee, J.; Park, J. Developing an algorithm to assess the rear-end collision risk under fog conditions using real-time data. Transp. Res. Part C Emerg. Technol. 2018, 87, 11–25.
- Mueller, A.S.; Trick, L.M. Driving in fog: The effects of driving experience and visibility on speed compensation and hazard avoidance. Accid. Anal. Prev. 2012, 48, 472–479.
- Broughton, K.L.M.; Switzer, F.; Scott, D. Car following decisions under three visibility conditions and two speeds tested with a driving simulator. Accid. Anal. Prev. 2007, 39, 106–116.
- Ni, R.; Kang, J.J.; Andersen, G.J. Age-related declines in car following performance under simulated fog conditions. Accid. Anal. Prev. 2010, 42, 818–826.
- Yan, X.; Xue, Q.; Ma, L.; Xu, Y. Driving-simulator-based test on the effectiveness of auditory red-light running vehicle warning system based on time-to-collision sensor. Sensors 2014, 14, 3631–3651.
- Wu, Y.; Abdel-Aty, M.; Park, J.; Selby, R.M. Effects of real-time warning systems on driving under fog conditions using an empirically supported speed choice modeling framework. Transp. Res. Part C Emerg. Technol. 2018, 86, 97–110.
- Liu, J.; Khattak, A.J. Delivering improved alerts, warnings, and control assistance using basic safety messages transmitted between connected vehicles. Transp. Res. Part C Emerg. Technol. 2016, 68, 83–100.
- Boyle, L.N.; Mannering, F. Impact of traveler advisory systems on driving speed: Some new evidence. Transp. Res. Part C Emerg. Technol. 2004, 12, 57–72.
- Al-Ghamdi, A.S. Experimental evaluation of fog warning system. Accid. Anal. Prev. 2007, 39, 1065–1072.
- Zhao, X.; Xu, W.; Ma, J.; Li, H.; Chen, Y.; Rong, J. Effects of connected vehicle-based variable speed limit under different foggy conditions based on simulated driving. Accid. Anal. Prev. 2019, 128, 206–216.
- Chang, X.; Li, H.; Qin, L.; Rong, J.; Lu, Y.; Chen, X. Evaluation of cooperative systems on driver behavior in heavy fog condition based on a driving simulator. Accid. Anal. Prev. 2019, 128, 197–205.
- Wu, Y.; Abdel-Aty, M.; Park, J.; Zhu, J. Effects of crash warning systems on rear-end crash avoidance behavior under fog conditions. Transp. Res. Part C Emerg. Technol. 2018, 95, 481–492.
- Li, X.; Yan, X.; Wong, S.C. Effects of fog, driver experience and gender on driving behavior on S-curved road segments. Accid. Anal. Prev. 2015, 77, 91–104.
- Milosević, S.; Milić, J. Speed perception in road curves. J. Safety Res. 1990, 21, 19–23.
- Lucas, F.R.; Russo, L.E.A.; Kawashima, R.S.; Figueira, A.C.; Larocca, A.P.C.; Kabbach, F.I., Jr. Use of driving simulators Applied to road safety project. Bol. Ciencias Geod. 2013, 19, 341–352.
More
Information
Subjects:
Transportation
Contributor
MDPI registered users' name will be linked to their SciProfiles pages. To register with us, please refer to https://encyclopedia.pub/register
:
View Times:
1.2K
Entry Collection:
Environmental Sciences
Revisions:
2 times
(View History)
Update Date:
24 Sep 2021
Table of Contents


Notice
You are not a member of the advisory board for this topic. If you want to update advisory board member profile, please contact office@encyclopedia.pub.
OK
Confirm
Only members of the Encyclopedia advisory board for this topic are allowed to note entries. Would you like to become an advisory board member of the Encyclopedia?
Yes
No
${ textCharacter }/${ maxCharacter }
Submit
Cancel
Back
Comments
${ item }
|
${ item.createdUser.fullName }
${ item.createdAt }
${ item.vote }
${ item.reply }
Delete
${ reply.createdUser.fullName }
${ reply.createdAt }
${ reply.vote }
Delete
There is no reply to this comment~
${ item.replyTextCharacter }/${ item.replyMaxCharacter }
Submit
Cancel
More
No more~
There is no comment~
${ textCharacter }/${ maxCharacter }
Submit
Cancel
${ selectedItem.replyTextCharacter }/${ selectedItem.replyMaxCharacter }
Submit
Cancel
Confirm
Are you sure to Delete?
Yes
No