Your browser does not fully support modern features. Please upgrade for a smoother experience.
Submitted Successfully!
 +1 credit
Thank you for your contribution! You can also upload a video entry or images related to this topic.
For video creation, please contact our Academic Video Service.
| Version | Summary | Created by | Modification | Content Size | Created at | Operation |
|---|---|---|---|---|---|---|
| 1 | Ryad Bouzouidja | + 2244 word(s) | 2244 | 2021-08-06 12:21:30 | | | |
| 2 | Rita Xu | Meta information modification | 2244 | 2021-08-09 05:09:42 | | |
Video Upload Options
We provide professional Academic Video Service to translate complex research into visually appealing presentations. Would you like to try it?
Cite
If you have any further questions, please contact Encyclopedia Editorial Office.
Bouzouidja, R. Green Parking Lots. Encyclopedia. Available online: https://encyclopedia.pub/entry/12917 (accessed on 08 February 2026).
Bouzouidja R. Green Parking Lots. Encyclopedia. Available at: https://encyclopedia.pub/entry/12917. Accessed February 08, 2026.
Bouzouidja, Ryad. "Green Parking Lots" Encyclopedia, https://encyclopedia.pub/entry/12917 (accessed February 08, 2026).
Bouzouidja, R. (2021, August 08). Green Parking Lots. In Encyclopedia. https://encyclopedia.pub/entry/12917
Bouzouidja, Ryad. "Green Parking Lots." Encyclopedia. Web. 08 August, 2021.
Copy Citation
Green infrastructure has a role to play in climate change adaptation strategies in cities. Alternative urban spaces should be designed considering new requirements in terms of urban microclimate and thermal comfort. Pervious pavements such as green parking lots can contribute to this goal through solar evaporative cooling. However, the cooling benefits of such systems remain under debate during dry and warm periods.
green infrastructure
green parking lot
in-situ measurement
nature-based solutions
pervious pavement
1. Introduction
The urban heat island (UHI) phenomenon is triggered by several factors, such as the specific urban land cover, the canyon-shaped infrastructure morphology, the anthropogenic heat emissions, and the physical properties of the urban materials [1][2]. Many studies focus on identifying different patterns of urban expansion and their consequences on the urban microclimate [3][4][5][6]. Cai et al. [3] studied the influence of urbanization on the urban climate. They observed that the arrangement of urban areas in relation to water and vegetated areas affects energy fluxes. Several methods are proposed for reporting different types of land use. A major approach is the use of land cover indices [7][8], followed by the classification methods [9]. Jalan and Sharma [10] used land surface temperature (LST) to quantify the spatiotemporal changes in the UHI of Jaipur city (India). They found that urbanization affects the LST by about 3 °C.
Urbanization processes tend to increase the fraction of sealed and impervious surfaces. However, urban facets significantly influence the urban climate. Urban facets often demonstrate specific hygrothermal properties (e.g., low albedo, and reduced water absorption and retention), which lead to extreme surface temperature.
The development of sustainable and resilient cities requires alternative solutions and concepts, such as nature-based solutions (NBS) or green infrastructure (GI) [11]. Zölch et al. [12] reported that GI affects pedestrians’ thermal comfort. They conducted a study on high-density residential areas under current and future climatic conditions. GI (planting trees) demonstrates the strongest impact with an average physiological equivalent temperature (PET) reduction of 13% compared with existing vegetation. At ground level, several new pavement technologies are emerging, including pavement watering, reflective pavement, pervious pavement, and heat storage pavement [13].
Green parking lots (GPLs) are now being suggested as potential solutions for urban water management and UHI mitigation [14]. Onishi et al. [14] studied the influence of vegetation on urban parking in Nagoya city, Japan, during the warm period (spring and summer). They showed that parking with grass slightly reduced the LST (maximum LST decreased by 7.26 °C in the summer for one GPL). Park et al. [15] conducted a study of GPLs in Ulsan, Korea. They observed that the replacement of pavement materials reduces the radiant temperature of the surface. Considering the anthropogenic nature of its soil layers, a GPL can be considered as an urban soil or Technosol [16]. Pervious GPL systems included porous layers that retain water. Evaporation of stored water contributes to a cooling down perception for pedestrians and a sensible reduction of air ambient temperature [17]. In addition, GPLs could reduce surface temperature if vegetation is included [18].
Several studies show the importance of vegetation and biobased materials (e.g., wood chips) on the GPL behavior [19]. Wood chips may be locally produced and originate from sustainably managed forest. In addition, Buchanan et al. [20] argued that wood chips can be a solution adapted to the urban context because of their effectiveness in controlling soil erosion on a steeply sloping construction site.
Wang et al. [21] presented two types of driving factors for the evaporative cooling performance of pervious materials, namely the climatic parameters [22] and the hygrothermal parameters (albedo, water absorption, and water retention properties) [23]. Solar radiation has been reported to be the most significant climatic parameter, followed by air temperature, relative humidity, and wind speed [22].
Hygrothermal properties of pervious pavement are usually assessed under controlled conditions [24]. However, performance observed during laboratory experimental tests must be consolidated with summertime case studies of pervious pavement implemented at full scale. During dry and warm periods, water availability within pervious pavements may shrink dramatically. In these conditions, evaporation may be strongly reduced, and the cooling benefits of GPLs may be weakened. In the case of pervious concrete, Nemirovsky et al. [25] suggest that water stored far from the surface does not participate in the evaporation process.
Previous studies have shown that, without precipitation, pervious pavements may increase the urban overheating due to their high specific heat capacity and reduced evaporation [26]. Therefore, thermal performance of full-scale GPLs needs to be analyzed to investigate the extent to which pervious pavements can be considered as heat sinks during warm and dry periods.
2. Impact of Depth on Temperature Dynamics
Temporal variations of temperature of the parking lots (P1, P3, P4, and P5) and control zone (CZ9) at −3, −8, −16, −24, and −55 cm depths between 24 June and 30 June are shown in Figure 1. In general, the daily amplitude of temperature variations tended to decrease with increasing depth. The outdoor air temperature varied between 13.4 and 33.8 °C during this period. Temperatures at −3 cm were higher than the outdoor air temperature for all parking systems.
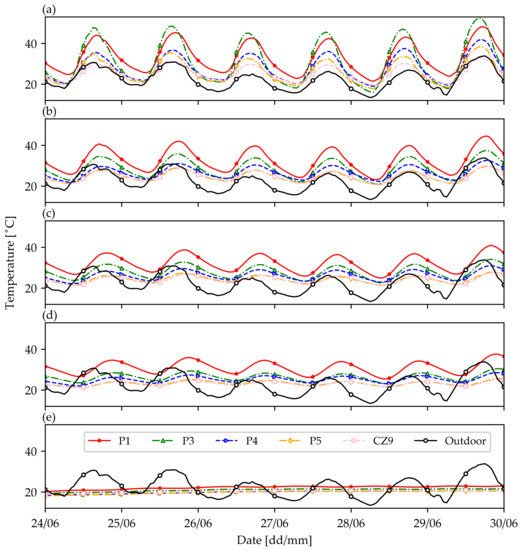
Figure 1. Temperature records at different depths: −3 cm (a); −8 cm (b); −16 cm (c); −24 cm (d); −55 cm (e) during the summer period from 24 June to 30 June 2019. P1 is represented with a red solid line with star markers. P3 is represented with a green dotted line with triangle up markers. P4 is represented with a blue dotted line with triangle right markers. P5 is represented with an orange dotted line with diamond markers. CZ9 is represented with a pink dashed line with square markers. The black continuous line with round markers represents air ambient temperature.
For the depth of −3 cm (Figure 1a), P3 was the warmest area during daytime and reached a maximum temperature of 51.0 °C. This confirms the existence of an energy storage effect, which induces an increase in the temperature. P3 also exhibited the highest daily temperature amplitude.
At a depth of −3 cm, P1 was the second warmest area during daytime and the warmest area during nighttime. For this depth, P1 was the warmest parking lot on average during the week (33.1 °C).
The temperature fluctuations of P4 (vegetation and substrate) recorded at a depth of −3 cm demonstrated a similar pattern to that of P5 (wood chips) on the first day. A difference in temperature between P4 and P5 began to occur on the third day (3–4 °C at noon). This small temperature gap may be explained by the hydrophilic properties of wood chips (considered to be an organic mulching) because wood may capture part of the morning dew.
CZ9 with grass and natural soil was the coolest area during most parts of the day. The lowest surface temperatures were recorded for CZ9 (29.6 to 32.9 °C at noon).
The depths of −8, −16, and −24 cm demonstrated similar patterns (Figure 1b–d). P1 was the warmest area at all times (day and night). P3 and P4 were cooler than P1, and P5 and CZ9 were the coolest areas. P3 tended to be warmer than P4 during daytime, but the two lots exhibited similar minimum temperatures. P5 and CZ9 showed almost identical thermal behavior. Each PLT presented a repeatable daily temperature pattern.
Measurements at a depth of 55 cm indicated similar patterns and described a plateau (between 18.2 and 22.7 °C). The amplitudes of the variations and the temporal shift, which were particularly visible on the temperature peaks, were negligible (Figure 10e).
3. Analysis of the Daily Temperature Cycle
The daily vertical heat transfer cycles were analyzed by the temperature profiles measured at different depths (Figure 2). For all systems, the depth of −3 cm demonstrated the highest temperature amplitude. The temperature amplitude decreased when the depth increased. During daytime, the heat received on the surface was transferred downward by conduction to the lower layers (−8, −16, and −24 cm depths). A daily maximum temperature was observed for all layers, except for the depth of −55 cm. However, the maximum temperature time differed between layers and time shifts were observed. The deeper the layer, the later the daily maximum temperature occurred.
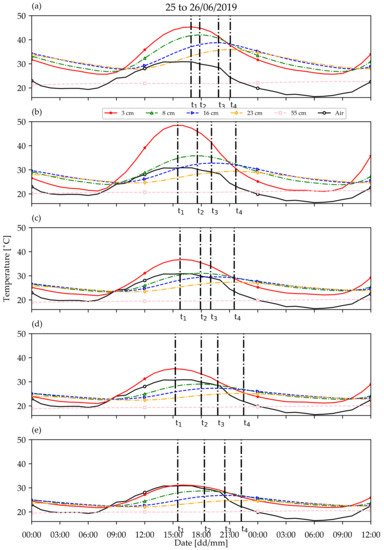
Figure 2. Representation of temperature curves at different depths for P1 (a), P3 (b), P4 (c), P5 (d), and CZ9 (e) systems from 25 June to 26 June 2019. Temperature at −3 cm depth is represented with a red solid line with star markers. Temperature at −8 cm depth is represented with a green dotted line with triangle up markers. Temperature at −16 cm depth is represented with a blue dotted line with triangle right markers. Temperature at −24 cm depth is represented with an orange dotted line with diamond markers. Temperature at −55 cm depth is represented with a pink dashed line with square markers. The black continuous line with round markers represents air ambient temperature. t1 represents maximum temperature at −3 cm depth. t2 represents maximum temperature at −8 cm depth. t3 represents maximum temperature at −16 cm depth. t4 represents maximum temperature at −24 cm depth.
At the beginning of the evening, the −3 cm depth layer started to cool due to convection and radiative transfer. During all the evenings and nights, the lower layers released the stored heat, and the conduction transfer was oriented upward.
The outdoor temperature was much lower than the layer temperatures of P1 and P3 (Figure 2). In the cases of P4 and P5, the temperature at −3 cm (resp. at −8, −16, and −24 cm depths) was higher than (resp. similar to) the outdoor temperature. It appears that CZ9 exhibited a temperature at −3 cm that was comparable to or slightly higher than the outdoor temperature (Figure 1).
Considering P1, the daytime conductive heat transfer toward the lower layers was fast and effective. The time shifts observed for P1 between the daily maximum temperatures (−3, −8, −16, and −24 cm depths) were the lowest of all the studied systems. Moreover, the P1 system stored solar energy in the superficial layer (second warmest daytime temperature at −3 cm depth) and efficiently transferred the heat toward the sublayers (warmest daytime temperature at −8, −16, and −24 cm depths).
P3, P4, and P5 systems included a slab at the superficial layer (between 0 and −6 cm depths). Results indicate that this element played a minor role regarding the thermal behavior of PLT, because the P3 system showed a significantly different underground temperature than that of the P4 and P5 systems.
4. Comparison between Studied Systems and Control Zone
Figure 12 presents the temperature differences between each parking lot (P1, P3, P4, and P5) and the control area (CZ9) (cf. Equation (1)). In the case of P1 (Figure 3a), from a depth of −3 to −24 cm, an increase in depth led to a decrease in the daily amplitude and a time shift in the daily temperature extrema. At −55 cm depth, the difference between P1 and CZ9 was almost negligible (0 to 2.0 °C).
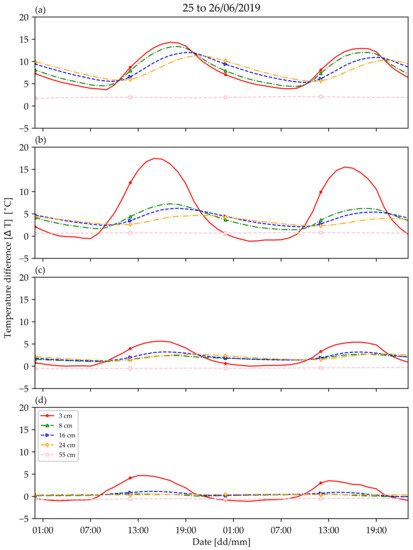
Figure 3. Representation of the temperature difference ΔT (°C) based on Equation (1) at the different depths for the P1 (a), P3 (b), P4 (c), and P5 (d) systems compared to the control area (CZ9) from 25 June–26 June 2019. Temperature at −3 cm depth is represented with a red solid line with star markers. Temperature at −8 cm depth is represented with a green dotted line with triangle up markers. Temperature at −16 cm depth is represented with a blue dotted line with triangle right markers. Temperature at −24 cm depth is represented with an orange dotted line with diamond markers. Temperature at −55 cm depth is represented with a pink dashed line with square markers.
The P3 system remained cooler than P1 on average (Figure 3b) for all depths except that of −3 cm. The paved stone was up to 19.5 °C warmer than the control zone during daytime but was cooler than grass during nighttime (−3.5 °C). The paving stone layer (P3) stored a significant amount of heat and increased its temperature. However, it transferred less heat toward the lower layers than P1.
P4 and P5 systems were consistently cooler than P1 (0 to 5.0 °C) (Figure 3c,d). During nighttime, the temperature at a depth of −3 cm was similar to that of CZ9. The difference in temperature reached approximately +9.0 °C for P4 and +5.0 °C for P5 during daytime. P4 demonstrated a positive difference in temperature for −8, −16, and −24 cm depths (average of 2.3 °C), and no temperature gap for the −55 cm depth. Except for the −3 cm depth, the temperature differences between P5 and CZ9 were not significant.
5. Cooling and Heating Rates
The cooling and heating rates were calculated for the −3 cm depth on 25 June and 26 June 2019 (cf. Equations (2) and (3)) (Figure 4). Two hours before and after sunrise, all RC rates tended to be similar (between 0.0 and 1.0 °C h−1). Heating started 1–2 h after sunrise (positive value of temperature rate, i.e., heating rate). The heating rates increased and reached their daily maximum around noon. The −3 cm depth layers started to cool around 5 pm (negative value of temperature rate, i.e., cooling rate). The daily minimum in the cooling rate was reached around sunset.
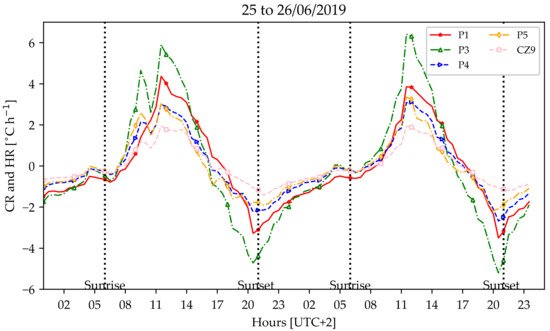
Figure 4. Representation of the rate of change (RC) (°C h−1) in five PLTs at −3 cm depth (25 to 26 June 2019). P1 is represented with a red solid line with star markers. P3 is represented with a green dotted line with triangle up markers. P4 is represented with a blue dotted line with triangle right markers. P5 is represented with an orange dotted line with diamond markers. CZ9 is represented with a pink dashed line with square markers.
Results illustrate that P3 had the highest RC (corresponded to the heating phase during daytime (up to 6.0 °C h−1 at noon, UTC + 2) and the lowest RC during nighttime (−5.0 °C h−1). P1 demonstrated less intense temperature rates than P3 (maximum RC 4.0 °C h−1, minimum RC −3.0 °C h−1). The P4 and P5 systems had very similar thermal behavior during both day and night. The RC of P4 was, on average, 0.2 °C h−1 higher than the temperature rate of P5. CZ9 showed the smallest amplitude of RC (+2.0 °C h−1 during daytime, −1.5 °C h−1 during nighttime).
References
- Danh, L.T.; Truong, P.; Mammucari, R.; Foster, N. A Critical Review of the Arsenic Uptake Mechanisms and Phytoremediation Potential of Pteris Vittata. Int. J. Phytoremed. 2014, 16, 429–453.
- Di Sabatino, S.; Barbano, F.; Brattich, E.; Pulvirenti, B. The Multiple-Scale Nature of Urban Heat Island and Its Footprint on Air Quality in Real Urban Environment. Atmosphere 2020, 11, 1186.
- Cai, D.; Fraedrich, K.; Guan, Y.; Guo, S.; Zhang, C.; Zhu, X. Urbanization and Climate Change: Insights from Eco-Hydrological Diagnostics. Sci. Total Environ. 2019, 647, 29–36.
- Cai, Y.; Zhang, H.; Zheng, P.; Pan, W. Quantifying the Impact of Land Use/Land Cover Changes on the Urban Heat Island: A Case Study of the Natural Wetlands Distribution Area of Fuzhou City, China. Wetlands 2016, 36, 285–298.
- Estoque, R.C.; Murayama, Y.; Myint, S.W. Effects of Landscape Composition and Pattern on Land Surface Temperature: An Urban Heat Island Study in the Megacities of Southeast Asia. Sci. Total Environ. 2017, 577, 349–359.
- Kikon, N.; Singh, P.; Singh, S.K.; Vyas, A. Assessment of Urban Heat Islands (UHI) of Noida City, India Using Multi-Temporal Satellite Data. Sustain. Cities Soc. 2016, 22, 19–28.
- Fan, C.; Myint, S.W.; Zheng, B. Measuring the Spatial Arrangement of Urban Vegetation and Its Impacts on Seasonal Surface Temperatures. Prog. Phys. Geogr. Earth Environ. 2015, 39, 199–219.
- Mathew, A.; Khandelwal, S.; Kaul, N. Investigating Spatial and Seasonal Variations of Urban Heat Island Effect over Jaipur City and Its Relationship with Vegetation, Urbanization and Elevation Parameters. Sustain. Cities Soc. 2017, 35, 157–177.
- Buyantuyev, A.; Wu, J. Urban Heat Islands and Landscape Heterogeneity: Linking Spatiotemporal Variations in Surface Temperatures to Land-Cover and Socioeconomic Patterns. Landsc. Ecol. 2010, 25, 17–33.
- Jalan, S.; Sharma, K. Spatio-Temporal Assessment of Land Use/Land Cover Dynamics and Urban Heat Island of Jaipur City Using Satellite Data. ISPRS Int. Arch. Photogramm. Remote Sens. Spat. Inf. Sci. 2014, 8, 767–772.
- Bouzouidja, R.; Cannavo, P.; Bodénan, P.; Gulyás, Á.; Kiss, M.; Kovács, A.; Béchet, B.; Chancibault, K.; Chantoiseau, E.; Bournet, P.-E.; et al. How to Evaluate Nature-Based Solutions Performance for Microclimate, Water and Soil Management Issues. Available Tools and Methods from Nature4Cities European Project Results. Ecol. Indic. 2021, 125, 107556.
- Zölch, T.; Henze, L.; Keilholz, P.; Pauleit, S. Regulating Urban Surface Runoff through Nature-Based Solutions—An Assessment at the Micro-Scale. Environ. Res. 2017, 157, 135–144.
- Gupta, R. Monitoring in Situ Performance of Pervious Concrete in British Columbia—A Pilot Study. Case Stud. Constr. Mater. 2014, 1, 1–9.
- Onishi, A.; Cao, X.; Ito, T.; Shi, F.; Imura, H. Evaluating the Potential for Urban Heat-Island Mitigation by Greening Parking Lots. Urban For. Urban Green. 2010, 9, 323–332.
- Park, J.-H.; Kim, J.; Yoon, D.K.; Cho, G.-H. The Influence of Korea’s Green Parking Project on the Thermal Environment of a Residential Street. Habitat Int. 2016, 56, 181–190.
- Dagois, R.; Faure, P.; Bataillard, P.; Bouzouidja, R.; Coussy, S.; Leguédois, S.; Enjelvin, N.; Schwartz, C. From Atmospheric- to Pedo-Climate Modeling in Technosols: A Global Scale Approach. Geoderma 2017, 301, 47–59.
- McPherson, E.G. Sacramento’s Parking Lot Shading Ordinance: Environmental and Economic Costs of Compliance. Landsc. Urban Plan. 2001, 57, 105–123.
- Chun, B.; Guldmann, J.-M. Impact of Greening on the Urban Heat Island: Seasonal Variations and Mitigation Strategies. Comput. Environ. Urban Syst. 2018, 71, 165–176.
- Takebayashi, H.; Moriyama, M. Study on the Urban Heat Island Mitigation Effect Achieved by Converting to Grass-Covered Parking. Sol. Energy 2009, 83, 1211–1223.
- Buchanan, J.R.; Yoder, D.C.; Denton, H.P.; Smoot, J.L. Wood Chips as a Soil Cover for Construction Sites with Steep Slopes. Appl. Eng. Agric. 2002, 18, 679–683.
- Wang, J.; Santamouris, M.; Meng, Q.; He, B.-J.; Zhang, L.; Zhang, Y. Predicting the Solar Evaporative Cooling Performance of Pervious Materials Based on Hygrothermal Properties. Sol. Energy 2019, 191, 311–322.
- Zhang, L.; Pan, Z.; Zhang, Y.; Meng, Q. Impact of Climatic Factors on Evaporative Cooling of Porous Building Materials. Energy Build. 2018, 173, 601–612.
- Li, Y.; Rodriguez, F.; Berthier, E. Development of the Integrated Urban Hydrological Model URBS: Introduction and Evaluation of a Transfer Module in the Saturated Zone; ICUD: Kuching, Malaysia, 2014.
- Faisal, G.H.; Jaeel, A.J.; Al-Gasham, T.S. BOD and COD Reduction Using Porous Concrete Pavements. Case Stud. Constr. Mater. 2020, 13, e00396.
- Nemirovsky, E.M.; Welker, A.L.; Lee, R. Quantifying Evaporation from Pervious Concrete Systems: Methodology and Hydrologic Perspective. J. Irrig. Drain. Eng. 2013, 139, 271–277.
- Wang, J.; Meng, Q.; Tan, K.; Zhang, L.; Zhang, Y. Experimental Investigation on the Influence of Evaporative Cooling of Permeable Pavements on Outdoor Thermal Environment. Build. Environ. 2018, 140, 184–193.
More
Information
Subjects:
Meteorology & Atmospheric Sciences
Contributor
MDPI registered users' name will be linked to their SciProfiles pages. To register with us, please refer to https://encyclopedia.pub/register
:
View Times:
1.2K
Entry Collection:
Environmental Sciences
Revisions:
2 times
(View History)
Update Date:
09 Aug 2021
Table of Contents


Notice
You are not a member of the advisory board for this topic. If you want to update advisory board member profile, please contact office@encyclopedia.pub.
OK
Confirm
Only members of the Encyclopedia advisory board for this topic are allowed to note entries. Would you like to become an advisory board member of the Encyclopedia?
Yes
No
${ textCharacter }/${ maxCharacter }
Submit
Cancel
Back
Comments
${ item }
|
${ item.createdUser.fullName }
${ item.createdAt }
${ item.vote }
${ item.reply }
Delete
${ reply.createdUser.fullName }
${ reply.createdAt }
${ reply.vote }
Delete
There is no reply to this comment~
${ item.replyTextCharacter }/${ item.replyMaxCharacter }
Submit
Cancel
More
No more~
There is no comment~
${ textCharacter }/${ maxCharacter }
Submit
Cancel
${ selectedItem.replyTextCharacter }/${ selectedItem.replyMaxCharacter }
Submit
Cancel
Confirm
Are you sure to Delete?
Yes
No