 +1 credit
| Version | Summary | Created by | Modification | Content Size | Created at | Operation |
|---|---|---|---|---|---|---|
| 1 | Gui-Quan Sun | + 1771 word(s) | 1771 | 2020-05-14 15:14:08 | | | |
| 2 | Catherine Yang | Meta information modification | 1771 | 2020-05-18 04:02:31 | | | | |
| 3 | Lily Guo | -2 word(s) | 1769 | 2020-10-28 09:11:33 | | | | |
| 4 | Lily Guo | -2 word(s) | 1769 | 2020-10-28 09:12:08 | | |
Video Upload Options
COVID-19 is pneumonia caused by a novel coronavirus which is an emerging infectious disease, and outbreaks in more than 200 countries around the world. Consequently, the spread principles and prevention and control measures of COVID-19 have become a global problem to be solved. Here, we pose a series of dynamical models to reveal the transmission mechanisms of COVID-19. Based on these mathematical models, data fitting and spread trend of COVID-19 are explored to show the propagation law between human populations. We hope that our work may provide some useful insights for effective control of the COVID-19.
1. Introduction
COVID-19 is an emerging infectious disease caused by a novel coronavirus (SARS-CoV-2). Because its strong infectivity and little attention by people, it spread over 200 countries and infected more than 300 million people [1]. A lot of great works have been done on COVID-19 including epidemiological review, pathological characteristics, diagnostic technology, treatment and so on [2][3][4][5]. Here, we want to show the transmission dynamics of COVID-19 from the aspect of mathematical modelling. A series of dynamical models of COVID-19 transmission are constructed based on reasonable assumptions. After that, parameters estimations are carried out by data fitting. Besides that, the trend of disease spread is predicted and the effectiveness of control measures are evaluated.
2. Dynamical modelling of COVID-19
2.1. Ordinary Differential Equations
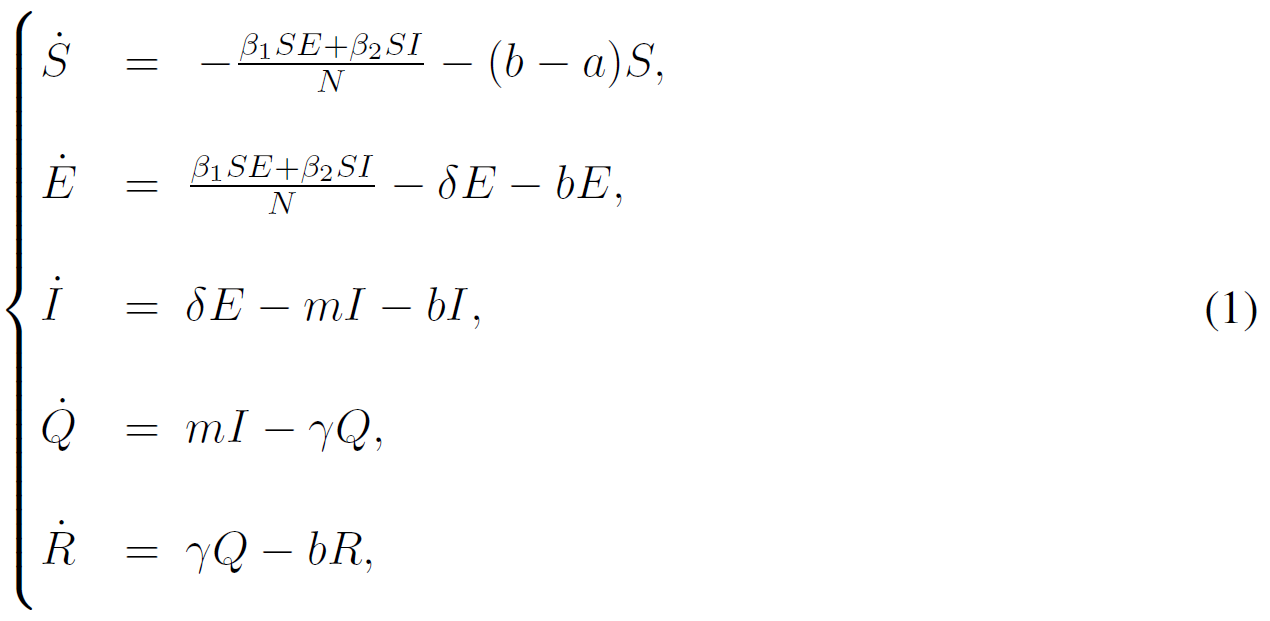
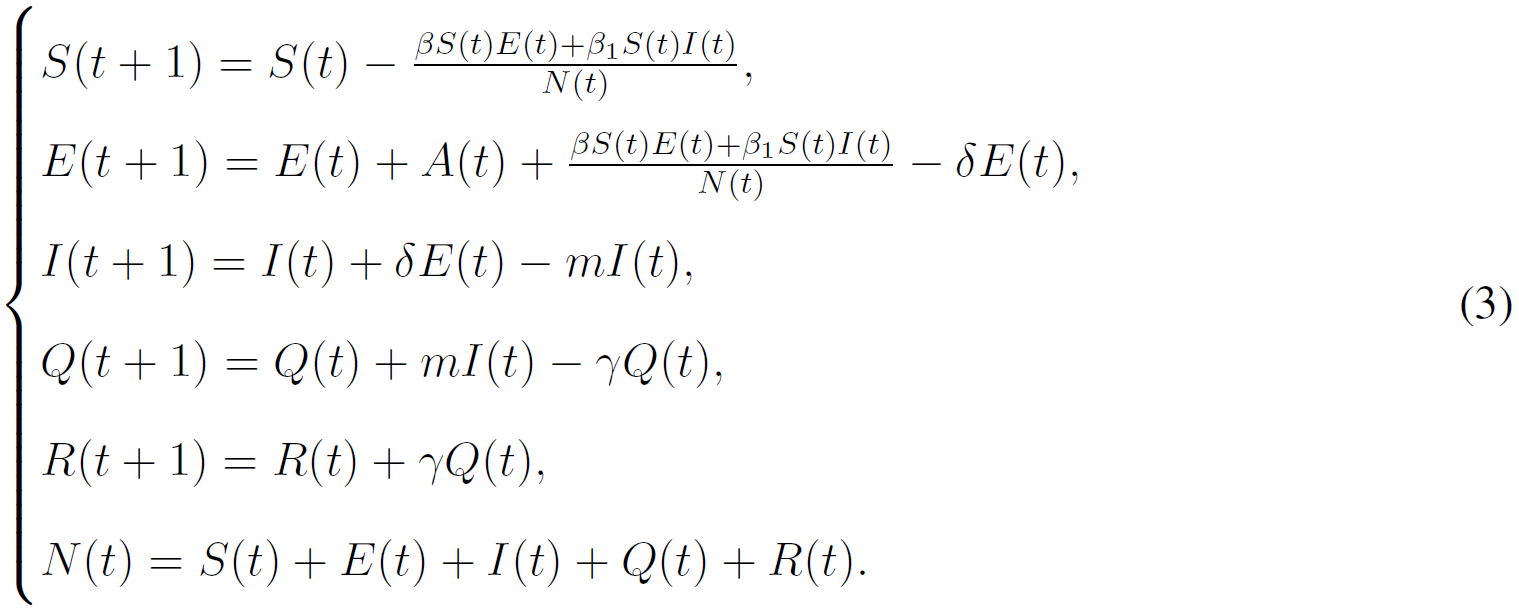
We firstly present dynamical models in the form of ordinary differential equations for the transmission of COVID-19 in Wuhan, China. We divide the total population as five groups: Susceptible (S), Exposed (E), Infected (I), Confirmed (Q) and Removed (R). Based on the real situation of Wuhan, two dynamical models are constructed to describe the transmission processes of the epidemic before and after the lockdown of the city. Dynamical model before January 23, 2020 has the following form (see Figure 1) [6]:
where 


Figure 1. Transmission diagram of COVID-19 in Wuhan before lockdown. S(t), E(t), I(t), Q(t) and R(t) represent the susceptible, exposed, infected, confirmed and removed populations.
When Wuhan government adopted the measure of lockdown, the people can hardly leave or return Wuhan. In this case, dynamical model with lockdown after January 23, 2020 is as follows:
where 


On 23 January 2020, the Chinese authorities introduced the implementation of the lock-down strategy in Wuhan to shut down the movement and to control the transmission of COVID-19. And since Feb 04, Huoshenshan Hospital, Leishenshan Hospital and many cabin hospitals have been used, the medical resources become more reliable. Hence, the COVID-19 epidemic in Wuhan can be divided into three stages. The first stage is from 15 January to 23 January, there does not exist the travel restriction and the medical diagnostic tools may be less accurate and reliable. The second stage is from 23 January to 04 February, when the medical resources are not reliable and travel restriction is used. The third stage is from 04 February to 30 March, there exists the strict community control strategy and the medical resources become more reliable. The strict community control strategy means that the community is closed, which is reflected in decreasing of transmission rate. And the reliable medical resources reflect the increasing of laboratory diagnosis rate m.
Figure 2 unveils the time evolution of both infection cases and comparison with empirical record of cumulative and daily number of confirmed COVID-19 cases in Wuhan city with three stages, and which also shows the 95\% percent interval for all 10000 passing simulation trajectories and the median of these 10000 simulation outputs. It is clear that the theoretical prediction is nearly full agreement with real data, which also well validates the accuracy of proposed model. Based on these parameters set, one can predict the peak time, final scale and other features of COVID-19 in Wuhan.
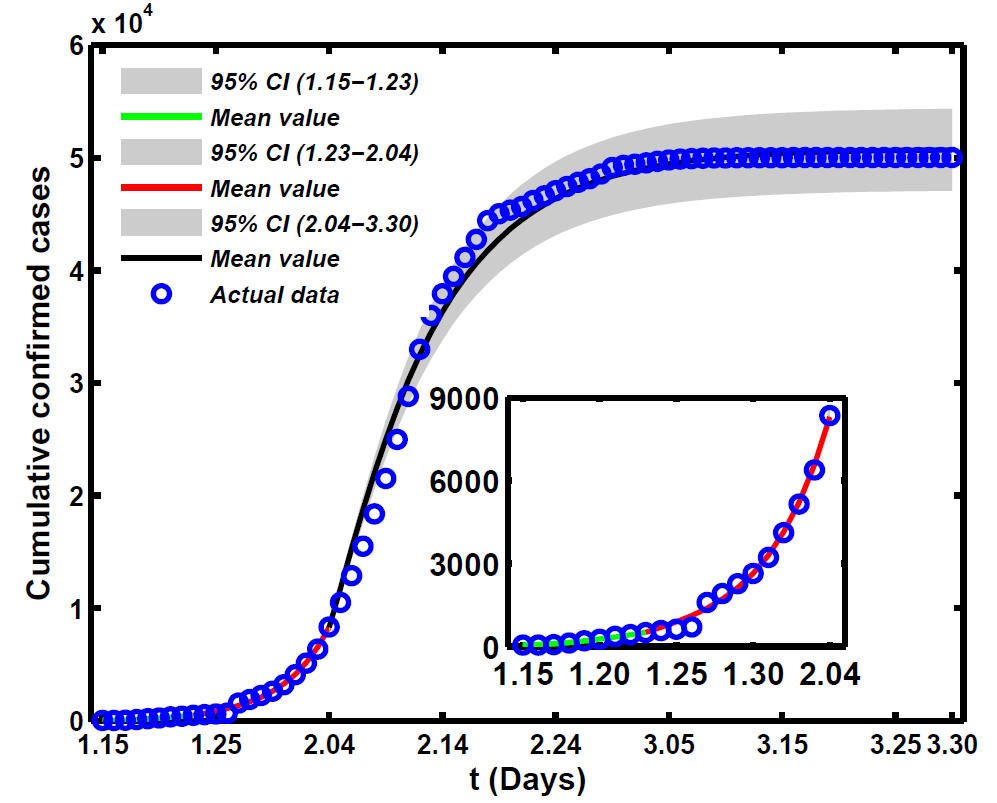
Figure 2. Fitting results of theoretical cumulative number of confirmed COVID-19 cases with its actual reported number. Dynamical model is used as system (1).
2.2. Difference Equation
We developed a SEIQR difference-equation model to describe the transmission of COVID-19 in Shanxi Province, China [7]. Human population birth and death rates were ignored, and the human host incubation period was 
Using extensive Markov-chain Monte-Carlo (MCMC) simulations based on the adaptive combination Delayed rejection and Adaptive Metropolis (DRAM) algorithm [8] for system (3) to estimate the values of parameter m and 
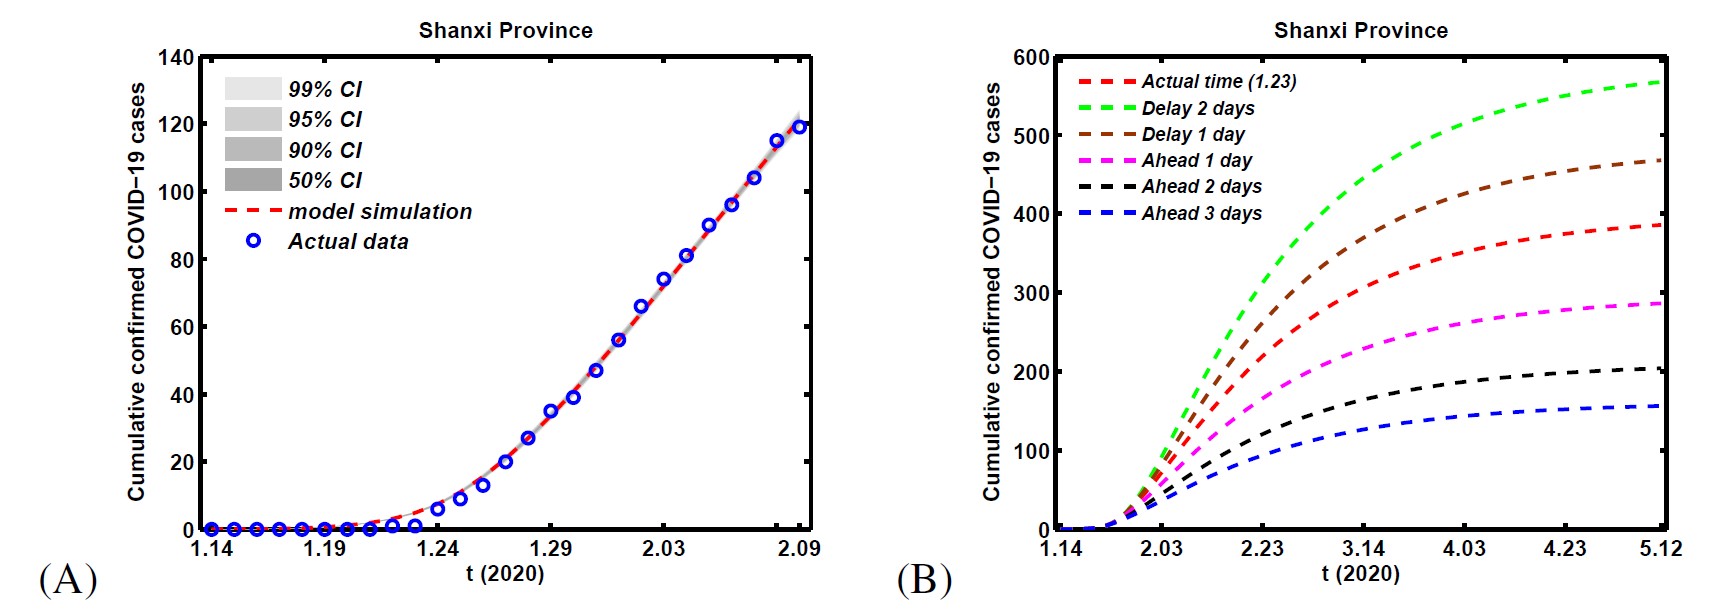
Figure 3. (A) Fitting results of theoretical cumulative number of confirmed COVID-19 cases with its actual reported number. (B) Simulation results for cumulative number of confirmed COVID-19 cases in Shanxi Province with different lock-down strategy dates in Wuhan city. Dynamical model is used as system (2).
2.3. Integral Equation
By observing actual COVID-19 case data, it is more appropriate that the random variable of the residence time of an individual in a compartment obeys the normal, or log-normal or gamma distributions. Therefore, an integration model is established to describe the spread of SARS-CoV-2 between infection generations.
In this model, infectious cases are taken as research objects. According to whether or not they are identified and confirmed, the infectious cases are divided into two classes: non-confirmed cases and confirmed cases. The non-confirmed cases refer to the population who has been infected and infectious, but has not been confirmed by medical institutions. After taking Nucleic acid test and being confirmed, the non-confirmed cases become confirmed cases. Once confirmed, the cases will be being treated in isolation in hospital and separate from the infection of the epidemic. The number of non-confirmed cases at time t is denoted by I(t). According to the propagation chain, they are divided into three subclasses: the first-generation, the second-generation and the third-generation, whose numbers at time t are denoted by 

. The first-generation non-confirmed cases refer to the imported non-confirmed cases from Wuhan city. The second-generation non-confirmed cases refer to local non-confirmed infected by the first-generation cases, and they can be divided into two parts: family non-confirmed cases and non-family non-confirmed cases. Family non-confirmed cases are the infected but no confirmed family members of the first-generation cases. Non-confirmed non-family cases refer to population that are generally infected in public places or public transport by the first-generation non-confirmed cases. The third-generation non-confirmed cases refer to local cases infected but not confirmed by the second-generation non-confirmed cases, which has not been reported in Shanxi province. For the first-generation non-confirmed cases, the import number at time


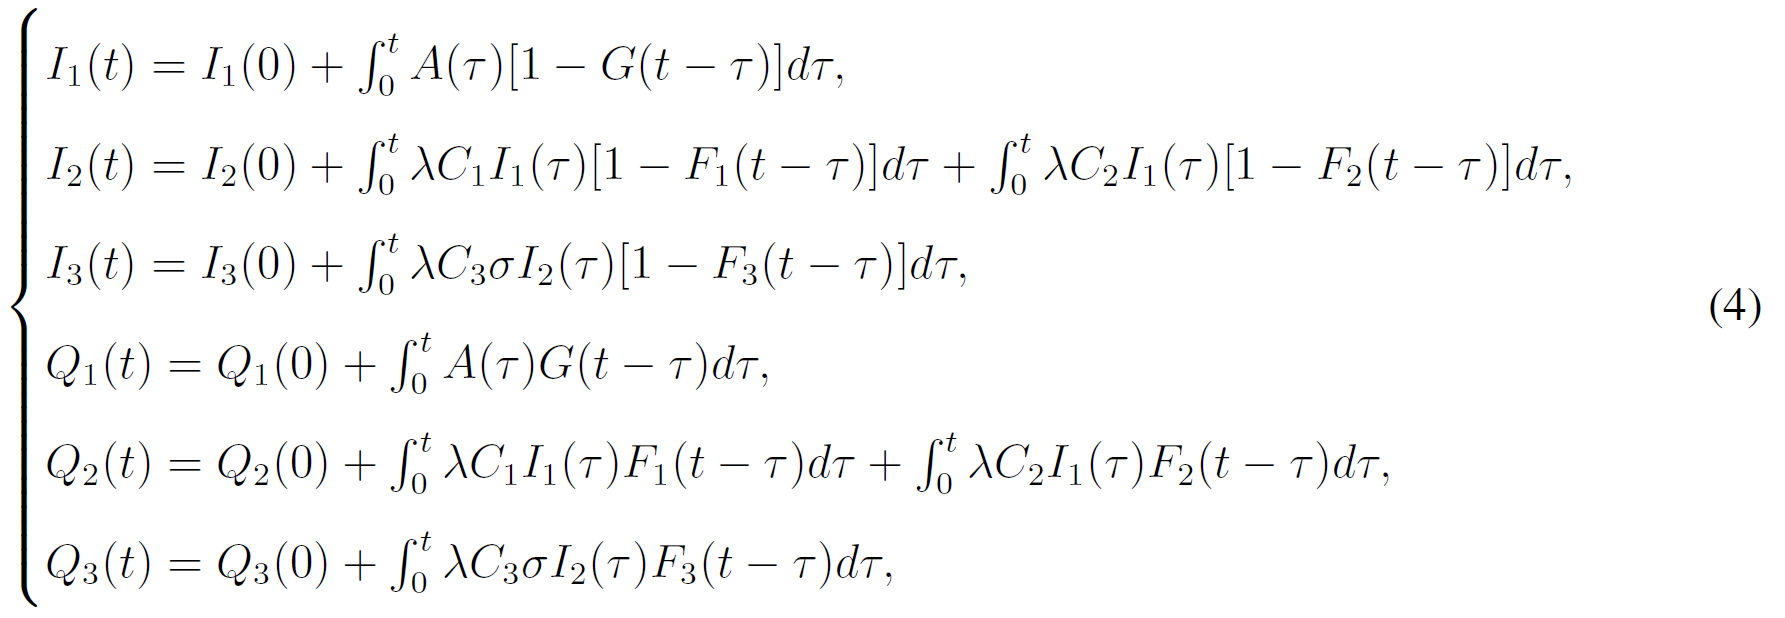
where 


For Shanxi province, there only appear two generations cases. By applying 
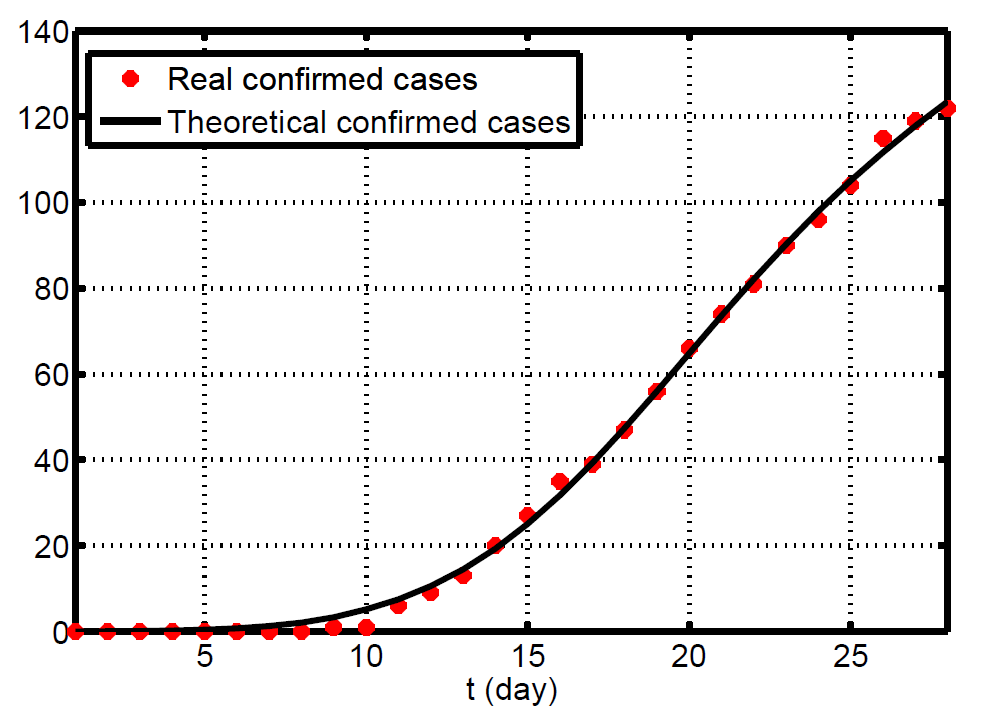
Figure 4. The fitting result of the total cumulative confirmed cases. Here, the red dots are actual reported cases from January 14 to February 10. Dynamical model is used as system (3).
The long-term prospect of the epidemic in Shanxi province can be seen in Figure 5. The inflection point (peak time) of COVID-19 has occurred in February 2. The disease will disappear in late February or the beginning of March and the mean final scale of cases will reach 175. It is inferred that there are about 20 non-confirmed family cases and about non-confirmed non-family cases that have not yet been found and confirmed, respectively. All these findings are consistent with the actual situation of Shanxi province.
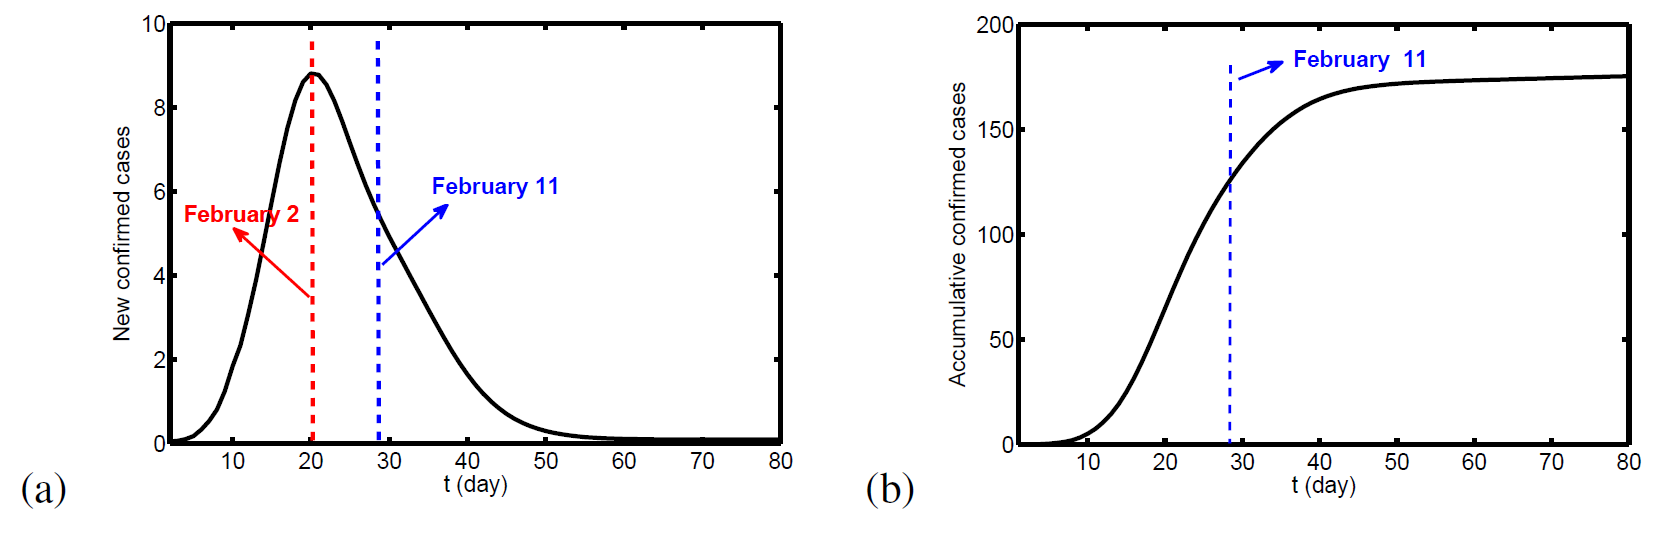
Figure 5. The prediction result of the total confirmed cases in current situation. (a) New cases. (b) Cumulative cases.
3. Discussion
In this work, dynamical models including ordinary differential equation, difference equation and integral equation for COVID-19 transmission in China are established and interesting results are obtained. Compared the similarities and differences with China, other countries may acquire useful information for COVID-19 from the perspective of transmission and macro control. We are deeply aware of that these works are not enough for showing the whole picture of modeling for COVID-19. This work hopes to serve as a trigger or offer a good starting point for revealing the internal mechanism of COVID-19 transmission between humans.
References
- Coronavirus disease (COVID-19) Pandemic . WHO. Retrieved 2020-5-15
- Li, Q., Guan, X., Wu, P., et al.; Early Transmission Dynamics in Wuhan, China, of Novel Coronavirus–Infected Pneumonia. New England Journal of Medicine 2020, 382, 1199-1207, 10.1056/NEJMoa2001316.
- Xu, X., Chen, P., Wang, J., et al.; Evolution of the novel coronavirus from the ongoing Wuhan outbreak and modeling of its spike protein for risk of human transmission. Science China Life Sciences 2020, 63, 457-460, 10.1007/s11427-020-1637-5.
- Wu, F., Zhao, S., Yu, B., et al.; A new coronavirus associated with human respiratory disease in China. Nature 2020, 579, 265-269, 10.1038/s41586-020-2008-3.
- Lu, R., Zhao, X., Li, J., et al.; Genomic characterisation and epidemiology of 2019 novel coronavirus: implications for virus origins and receptor binding.. The Lancet 2020, 395, 565-574, 10.1016/S0140-6736(20)30251-8.
- Sun, G.-Q., et al.; Transmission dynamics of COVID-19 in Wuhan, China: effects of lockdown and medical resources. Nonlinear Dyanmics 2020, Submitted, 1.
- Li, M., Sun, G.-Q., Zhang, J., et al.; Transmission analysis of COVID-19 in Shanxi Province for discrete time imported cases with difference equation model. Math. Biosci. Engieering 2020, Submitted, 1.
- Haario, H., Laine, M., Mira, A., Saksman, E.; DRAM: Efficient adaptive MCMC. Statistics and Computing 2006, 16, 339-354, 10.1007/s11222-006-9438-0.
- Zhang, J., Sun, G.-Q., Li, M., et al.; 2019 coronavirus disease (COVID-19) propagation prediction and assessment method with imported cases and generations: Shanxi province as a case. BMC Infectious Disease 2020, Submitted, 1.


