Submitted Successfully!
To reward your contribution, here is a gift for you: A free trial for our video production service.
Thank you for your contribution! You can also upload a video entry or images related to this topic.
Version Summary Created by Modification Content Size Created at Operation
1 + 1941 word(s) 1941 2021-06-25 07:52:43

Video Upload Options

Do you have a full video?

Confirm

Are you sure to Delete?
Cite
If you have any further questions, please contact Encyclopedia Editorial Office.
Jiang, Y. Near-Surface Wind. Encyclopedia. Available online: https://encyclopedia.pub/entry/11851 (accessed on 28 March 2024).
Jiang Y. Near-Surface Wind. Encyclopedia. Available at: https://encyclopedia.pub/entry/11851. Accessed March 28, 2024.
Jiang, Yi. "Near-Surface Wind" Encyclopedia, https://encyclopedia.pub/entry/11851 (accessed March 28, 2024).
Jiang, Y. (2021, July 09). Near-Surface Wind. In Encyclopedia. https://encyclopedia.pub/entry/11851
Jiang, Yi. "Near-Surface Wind." Encyclopedia. Web. 09 July, 2021.
Near-Surface Wind
Edit

Near-surface wind is one of the most important meteorological parameters. Near-surface wind grid products are an important part of live analysis products . Reliable near-surface wind products have an important role in the monitoring, prediction, and study of wind disasters. The evaluation of near-surface wind products can provide the direction for improving the data quality for Hainan, provide basic support for fine-grid forecasting and meteorological services, and help to reduce the losses that are caused by wind disasters.

near-surface wind HRCLDAS ERA5 evaluation

1. Introduction

Near-surface wind is one of the most important meteorological parameters. It is a major factor in various industries of economic importance, such as agriculture, fishery, transportation, construction, and water conservancy engineering. Hainan Province is located at the southernmost tip of China, and it includes Hainan Island and more than two million square kilometers of the South China Sea. Owing to these geographical features, wind disasters occur frequently in Hainan Province, so near-surface wind data are particularly important for Hainan. Although the site observations are accurate, simple site observations cannot meet data needs in areas with sparse sites, such as complex topographic areas and large sea areas [1][2][3][4]. With the improvement of numerical models and model interpretation techniques and the diversified requirements of meteorological service requirements, refined grid forecasts have gradually replaced traditional site forecasts. Grid live analysis products are the basis of refined grid forecasts [5][6], and they have been widely used in meteorological disaster monitoring, transportation, tourism, agriculture, and other refined meteorological services that are closely related to people’s livelihood [7][8][9][10]. Comprehensive evaluation needs to be used to judge whether the live analysis products can reflect the actual state of the atmosphere and if they can be used in weather forecasting and meteorological services [11]. Near-surface wind products are an important part of live analysis products [12][13][14]. Reliable near-surface wind products have an important role in the monitoring, prediction, and study of wind disasters. The evaluation of near-surface wind products can provide the direction for improving the data quality for Hainan, provide basic support for fine-grid forecasting and meteorological services, and help to reduce the losses that are caused by wind disasters.
Data fusion products have been developed in several countries, including the Fifth Generation Global Atmospheric reanalysis data (ERA5) developed by the European Center for medium range weather forecasting (ECMWF), the Interim ECMWF Re-Analysis product (ERA-Interim), the Japanese 55-year Reanalysis (JRA55), the Modern Era Retrospective Analysis for Research and Applications-2 (MERRA2), the National Centers for Environmental Prediction (NCEP)/National Center for Atmospheric Research (NCAR), and so on [15][16][17]. Many studies have evaluated these data products. Previous studies have shown that the ERA5 surface wind data show the best agreement with in situ observations when compared with ERA-Interim, JRA55, MERRA2, and NCEP/NCAR Reanalysis 1 (R1) [11]. ERA5 has the best performance in terms of the monthly average wind speed magnitude and the interannual variability of near-surface wind speed since 1979 in the Antarctic region [18]. When compared with ERA-Interim, ERA5 is more consistent with observations in terms of average wind speed and gust measurements in Sweden, but there are still significant differences in inland and mountainous areas [19]. ERA5 performs better than ERA-Interim in terms of instantaneous root-mean-square wind speed agreement, mean, and transient wind errors when compared with the ASCAT ocean vector wind observations [20]. There are also studies that have evaluated the applicability of data fusion products in China [21]. ERA-Interim, JRA55, MERRA, and NCEP-2 can reproduce the spatial distribution of the near-surface wind speed and the climatology, but they underestimate the intensity of the near-surface wind speed in most parts of China [22]. Among the surface elements of ERA5, the sea-level pressure and air temperature have the best reproducibility, followed by the relative humidity and wind speed, although the wind speed deviates greatly over coastal areas, and the wind direction has the worst reproducibility [23].
In China, the National Meteorological Information Center (NMIC) developed the High-Resolution China Meteorological Administration (CMA) Land Data Assimilation System (HRCLDAS) [24][25]. It can generate high-resolution grid data products of 0.01° × 0.01° in real time. HRCLDAS data products were released in 2020. Because of its short research and development time, there is still a lack of research evaluating its quality, and the understanding of its accuracy and authenticity in the special geographical environment of Hainan Island and the South China Sea is limited. Therefore, there is an urgent need for a comprehensive inspection and evaluation. To more accurately judge the quality of HRCLDAS products, they need to be compared with data fusion products that are widely recognized and used around the world.

2. Surface Meteorological Observation Data
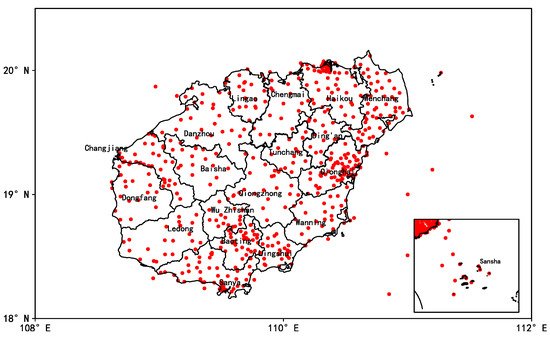
The surface meteorological observation data include the two-minute average wind speed and two-minute average wind direction data after quality control for Hainan Province from 3 April to 31 October 2020 (Table 1). The Hainan Meteorological Information Center provided the data, and they were obtained from the National Comprehensive Meteorological Information Sharing Platform through the MUSIC interface. The stations include two national climate observatories, three national reference climate stations, four national basic meteorological stations, 12 national meteorological observatories, 383 conventional meteorological observatories, and six offshore buoy stations. Figure 1 shows the station distribution.
Figure 1. Distribution of ground automatic meteorological observation stations in Hainan Province.
Table 1. Information on surface meteorological observation data.
Position Element Time Interval Number of Stations Time Range
Surface 10 m wind speed (2 min average),
10 m wind direction (2 min average)
Hourly 410 stations of Hainan Province 3 April–31 October 2020

3. ERA5 Near Surface Wind Data Product

The ERA5 reanalysis data are the latest generation of reanalysis data that were developed by the ECMWF. ERA5 is substantially upgraded and improved when compared with its predecessor ERA-Interim [20][26][27], and it is currently open access. The latitude and longitude grid resolution of the ERA5 reanalysis data is 0.25° × 0.25°, and the time resolution is 1 h. The data are downloaded from the C3S Climate Data Storage (CDS) through ECMWF Web API using Python scripts (Table 2).
Table 2. Information on ERA5 and HRCLDAS data.
Item Position Element Resolution/° Time interval Time Range
ERA5 Surface 10 m U wind, 10 mV wind 0.25 Hourly 3 April–31 October 2020
HRCLDAS Surface 10 m U wind, 10 mV wind 0.01 Hourly 3 April–31 October 2020

4. HRCLDAS Near Surface Wind Data Product

HRCLDAS is a high-resolution land surface data assimilation system that was developed by the National Meteorological Information Center of the CMA. The system uses multiple grid variational technology [28] and a terrain correction algorithm, combined with numerical prediction data, satellite data, and site observation data, to generate atmospheric-data-driven products [24]. The latitude and longitude grid resolution of the HRCLDAS data (Table 2) is 0.01° × 0.01°, and the time resolution is 1 h. The data were obtained from the CMA Data Service Centre.

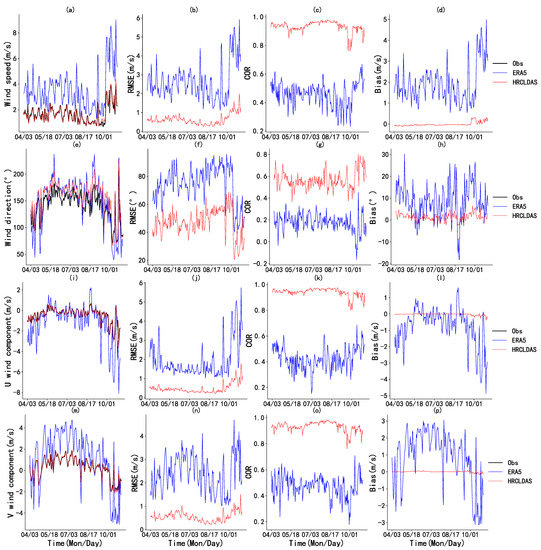
5. Analysis of Time Series Variation

The time series of the daily average wind speed (Figure 2a), wind orientation (Figure 2e), U wind component (Figure 2i), and V wind component (Figure 2m) for Hainan Island and the South China Sea from April to October 2020 were analyzed. The trend of the ERA5 and HRCLDAS wind products over time is basically the same as the observation data trend. For the HRCLDAS data, the time series of the four wind products closely follow the observations. However, the ERA5 data show a much larger variation for the four wind products when compared with the observations: the wind speed is significantly overestimated, but the wind direction is close to the observations; the U component is underestimated most of the time, and the V component is significantly overestimated.
Figure 2. Time series of daily average near-surface (a) wind speed, (e) wind direction, (i) U component, and (m) V component; RMSE time series of (b) wind speed, (f) wind direction, (j) U component, and (n) V component; COR time series of (c) wind speed, (g) wind direction, (k) U component, and (o) V component; bias time series of (d) wind speed, (h) wind direction, (l) U component, and (p) V component.
Figure 2b,f,j,n shows the time series charts of the daily average RMSE for wind speed, wind direction, U component, and V component, respectively. The RMSE of the four wind products for HRCLDAS is lower than that for ERA5. From April to September, the RMSE of the HRCLDAS wind speed was largely within the range from 0.2 to 1 m s−1, and the RMSE of the ERA5 wind speed was mostly within the range from 1 to 4 m s−1. The wind speed in October was significantly higher than that from April to September, and the RMSE of HRCLDAS also improved in October, with values between approximately 1 and 2 m s−1. The RMSE of ERA5 improved more significantly than HRCLDAS in October, with values that were between approximately 3 and 6 m s−1. From April to September, the RMSE of the HRCLDAS wind direction was mainly concentrated between 30° and 60°, and the RMSE of the ERA5 wind direction was mainly concentrated in the range from 60° to 90°. In October, the RMSE of both wind directions decreased significantly, and the decrease of ERA5 was greater than that of HRCLDAS. The RMSE of the HRCLDAS U and V components was similar to that of wind speed, and most were within 1 m s−1. For ERA5, the RMSE of the V component was obviously larger than that of the U component, and the variation was larger.
The daily average COR of HRCLDAS wind speed from April to October (Figure 2c) was mostly between 0.9 and 1.0, while that of ERA5 was mostly below 0.6. The COR of the wind direction of the two datasets (Figure 2g) was lower than that of the wind speed, the COR of HRCLDAS was between 0.4 and 0.8, and that of ERA5 was less than 0.4 with occasional negative correlations. The COR of the U component (Figure 2k) and V component (Figure 2o) for the HRCLDAS data were similar, whereas the COR of the V component for the ERA5 data was slightly better than that of the U component.
Figure 2d,h,l,p, show the time series diagrams of the daily average bias of wind speed, wind direction, U component, and V component, respectively. The bias of HRCLDAS from April to October was less than that of ERA5. For wind speed, the HRCLDAS data showed a negative bias from April to September, and the bias increased significantly in October, which showed a positive bias. For the wind direction, the bias of HRCLDAS and ERA5 was mostly positive, the bias of HRCLDAS was less than 6°, and the bias of ERA5 varied more dramatically over time, mostly between 0° and 30°. For the U and V components, the bias between HRCLDAS and the observation data were all approximately 0° without distinct variability. The U component of the ERA5 data showed mostly a negative bias, whereas the V component mostly showed a positive bias, and the bias of V component was larger than that of the U component.
In general, for daily average wind speed, wind direction, U component, and V component, HRCLDAS was closer to the observations than ERA5, with a lower RMSE, smaller bias, and higher COR.

6.  Comparative Analysis of Land and Sea

The performance of the two wind data products from April to October 2020 for Hainan Island land stations and island stations, respectively, were evaluated to analyze the performance of ERA5 and HRCLDAS wind products over land and sea. There are 70 island stations in Hainan Province, and Figure 3 shows the evaluation results.

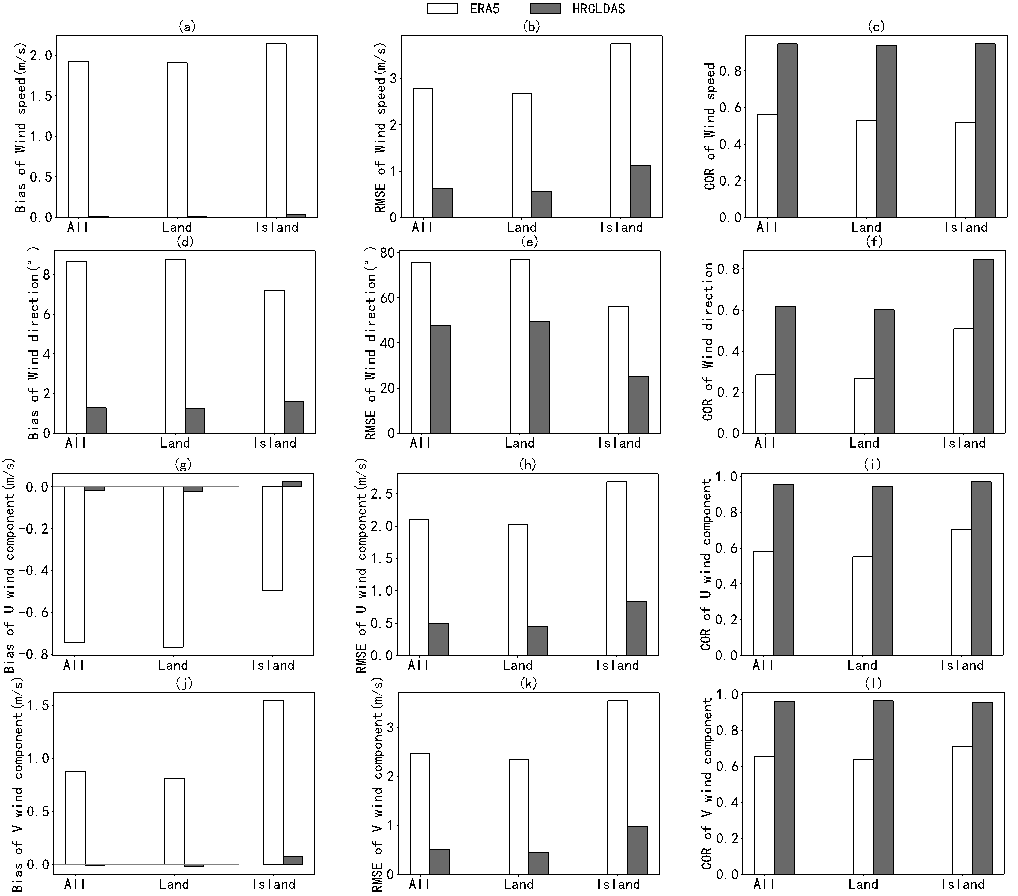
Figure 3. Evaluation indicators of ERA5 and HRCLDAS for land and sea. Bias of near-surface wind speed (a), wind direction (d), U component (g), and V component (j); RMSE of near-surface wind speed (b), wind direction (e), U component (h), and V component (k); COR of near-surface wind speed (c), wind direction (f), U component (i), and V component (l).

In general, HRCLDAS wind products had a smaller bias, smaller RMSE, and larger COR for both land and sea islands when compared with ERA5. The quality of the HRCLDAS and ERA5 wind products for islands was slightly better than that for land.

References

  1. Kunkel, K.E. Simple Procedures for Extrapolation of Humidity Variables in the Mountainous Western United States. J. Clim. 1989, 2, 656–669.
  2. Liu, Z. Comparison of versions 6 and 7 3-hourly TRMM multi-satellite precipitation analysis (TMPA) research products. Atmos. Res. 2015, 163, 91–101.
  3. Yang, F.; Lu, H.; Yang, K.; He, J.; Wang, W.; Wright, J.S.; Li, C.W.; Han, M.L.; Li, Y.S. Evaluation of multiple forcing data sets for precipitation and shortwave radiation over major land areas of China. Hydrol. Earth Syst. Sci. 2017, 21, 5805–5821.
  4. Rolland, C. Spatial and seasonal variations of air temperature lapse rates in Alpine regions. J. Clim. 2003, 16, 1032–1046.
  5. Calisir, E.; Soran, M.B.; Akpinar, A. Quality of the ERA5 and CFSR winds and their contribution to wave modelling performance in a semi-closed sea. J. Oper. Oceanogr. 2021.
  6. Osinski, R.D.; Radtke, H. Ensemble hindcasting of wind and wave conditions with WRF and WAVEWATCH III (R) driven by ERA5. Ocean. Sci. 2020, 16, 355–371.
  7. Ibarra-Berastegi, G.; Gonzalez-Roji, S.J.; Ulazia, A.; Carreno-Medinabeitia, S.; Saenz, J. Calculation of Lebanon offshore wind energy potential using ERA5 reanalysis: Impact of seasonal air density changes. In Proceedings of the 2019 Fourth International Conference on Advances in Computational Tools for Engineering Applications (Actea), Beirut, Lebanon, 3–5 July 2019.
  8. Jourdier, B. Evaluation of ERA5, MERRA-2, COSMO-REA6, NEWA and AROME to simulate wind power production over France. Adv. Sci. Res. 2020, 17, 63–77.
  9. Olauson, J. ERA5: The new champion of wind power modelling? Renew. Energy 2018, 126, 322–331.
  10. Taszarek, M.; Kendzierski, S.; Pilguj, N. Hazardous weather affecting European airports: Climatological estimates of situations with limited visibility, thunderstorm, low-level wind shear and snowfall from ERA5. Weather Clim. Extrem. 2020, 28.
  11. Ramon, J.; Lledo, L.; Torralba, V.; Soret, A.; Doblas-Reyes, F.J. What global reanalysis best represents near-surface winds? Q J. Roy. Meteor. Soc. 2019, 145, 3236–3251.
  12. Laurila, T.K.; Sinclair, V.A.; Gregow, H. Climatology, variability, and trends in near-surface wind speeds over the North Atlantic and Europe during 1979–2018 based on ERA5. Int. J. Climatol. 2021, 41, 2253–2278.
  13. Butler, B.W.; Wagenbrenner, N.S.; Forthofer, J.M.; Lamb, B.K.; Shannon, K.S.; Finn, D.; Eckman, R.M.; Clawson, K.; Bradshaw, L.; Sopko, P.; et al. High-resolution observations of the near-surface wind field over an isolated mountain and in a steep river canyon. Atmos. Chem. Phys. 2015, 15, 3785–3801.
  14. Graf, M.; Scherrer, S.C.; Schwierz, C.; Begert, M.; Martius, O.; Raible, C.C.; Bronnimann, S. Near-surface mean wind in Switzerland: Climatology, climate model evaluation and future scenarios. Int. J. Climatol. 2019, 39, 4798–4810.
  15. Oses, N.; Azpiroz, I.; Marchi, S.; Guidotti, D.; Quartulli, M.; Olaizola, I.G. Analysis of Copernicus’ ERA5 Climate Reanalysis Data as a Replacement for Weather Station Temperature Measurements in Machine Learning Models for Olive Phenology Phase Prediction. Sensors 2020, 20, 6381.
  16. Kanamitsu, M.; Kistler, R.E.; Reynolds, R.W. NCEP/NCAR reanalysis and the use of satellite data. Adv. Space Res. Ser. 1997, 19, 481–489.
  17. Kobayashi, C.; Endo, H.; Ota, Y.; Kobayashi, S.; Onoda, H.; Harada, Y.; Onogi, K.; Kamahori, H. Preliminary Results of the JRA-55C, an Atmospheric Reanalysis Assimilating Conventional Observations Only. Sola 2014, 10, 78–82.
  18. Dong, X.; Wang, Y.T.; Hou, S.G.; Ding, M.H.; Yin, B.L.; Zhang, Y.L. Robustness of the Recent Global Atmospheric Reanalyses for Antarctic Near-Surface Wind Speed Climatology. J. Clim. 2020, 33, 4027–4043.
  19. Minola, L.; Zhang, F.; Azorin-Molina, C.; Pirooz, A.A.S.; Flay, R.G.J.; Hersbach, H.; Chen, D. Near-surface mean and gust wind speeds in ERA5 across Sweden: Towards an improved gust parametrization. Clim. Dynam. 2020, 55, 887–907.
  20. Rivas, M.B.; Stoffelen, A. Characterizing ERA-Interim and ERA5 surface wind biases using ASCAT. Ocean. Sci. 2019, 15, 831–852.
  21. Zhang, W.; Zhang, H.; Liang, H.; Lou, Y.; Cai, Y.; Cao, Y.; Zhou, Y.; Liu, W. On the suitability of ERA5 in hourly GPS precipitable water vapor retrieval over China. J. Geod. 2019, 93, 1897–1909.
  22. Yu, J.; Zhou, T.J.; Jiang, Z.H.; Zou, L.W. Evaluation of Near-Surface Wind Speed Changes during 1979 to 2011 over China Based on Five Reanalysis Datasets. Atmosphere 2019, 10, 804.
  23. Zheng, Y. A Preliminary Analysis on the Applicability of ERA5 Reanalysis Data in Guangdong Province. Meteorol. Environ. Res. 2020, 11, 41–46.
  24. Han, S.; Shi, C.X.; Xu, B.; Sun, S.; Zhang, T.; Jiang, L.P.; Liang, X. Development and Evaluation of Hourly and Kilometer Resolution Retrospective and Real-Time Surface Meteorological Blended Forcing Dataset (SMBFD) in China. J. Meteorol. Res. 2019, 33, 1168–1181.
  25. Shuai, H.; Shi, C.; Jiang, Z.; Xu, B.; Li, X.; Tao, Z.; Jiang, L.; Xiao, L.; Zhi, Z.; Liu, J. Development and Progress of High Resolution CMA Land Surface Data Assimilation System. Adv. Met. S&T 2018, 8, 102–108.
  26. Wang, C.X.; Graham, R.M.; Wang, K.G.; Gerland, S.; Granskog, M.A. Comparison of ERA5 and ERA-Interim near-surface air temperature, snowfall and precipitation over Arctic sea ice: Effects on sea ice thermodynamics and evolution. Cryosphere 2019, 13, 1661–1679.
  27. Hoffmann, L.; Gunther, G.; Li, D.; Stein, O.; Wu, X.; Griessbach, S.; Heng, Y.; Konopka, P.; Muller, R.; Vogel, B.; et al. From ERA-Interim to ERA5: The considerable impact of ECMWF’s next-generation reanalysis on Lagrangian transport simulations. Atmos. Chem. Phys. 2019, 19, 3097–3124.
  28. Xie, Y.; Koch, S.; McGinley, J.; Albers, S.; Bieringer, P.E.; Wolfson, M.; Chan, M. A Space-Time Multiscale Analysis System: A Sequential Variational Analysis Approach. Mon. Weather Rev. 2011, 139, 1224–1240.
More
Information
Contributor MDPI registered users' name will be linked to their SciProfiles pages. To register with us, please refer to https://encyclopedia.pub/register :
View Times: 738
Revision: 1 time (View History)
Update Date: 09 Jul 2021
1000/1000