Near-surface wind is one of the most important meteorological parameters. Near-surface wind grid products are an important part of live analysis products . Reliable near-surface wind products have an important role in the monitoring, prediction, and study of wind disasters. The evaluation of near-surface wind products can provide the direction for improving the data quality for Hainan, provide basic support for fine-grid forecasting and meteorological services, and help to reduce the losses that are caused by wind disasters.
- near-surface wind
- HRCLDAS
- ERA5
- evaluation
1. Introduction
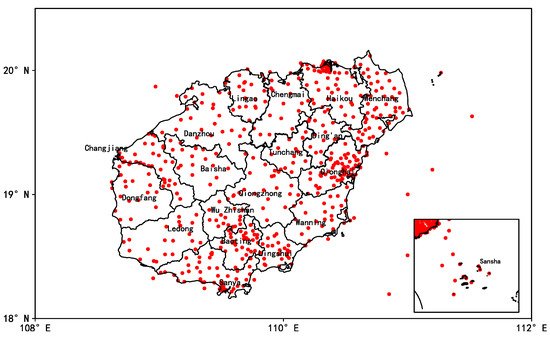
2. Surface Meteorological Observation Data

| Position | Element | Time Interval | Number of Stations | Time Range |
|---|---|---|---|---|
| Surface | 10 m wind speed (2 min average), 10 m wind direction (2 min average) |
Hourly | 410 stations of Hainan Province | 3 April–31 October 2020 |
3. ERA5 Near Surface Wind Data Product
| Item | Position | Element | Resolution/° | Time interval | Time Range |
|---|---|---|---|---|---|
| ERA5 | Surface | 10 m U wind, 10 mV wind | 0.25 | Hourly | 3 April–31 October 2020 |
| HRCLDAS | Surface | 10 m U wind, 10 mV wind | 0.01 | Hourly | 3 April–31 October 2020 |
4. HRCLDAS Near Surface Wind Data Product
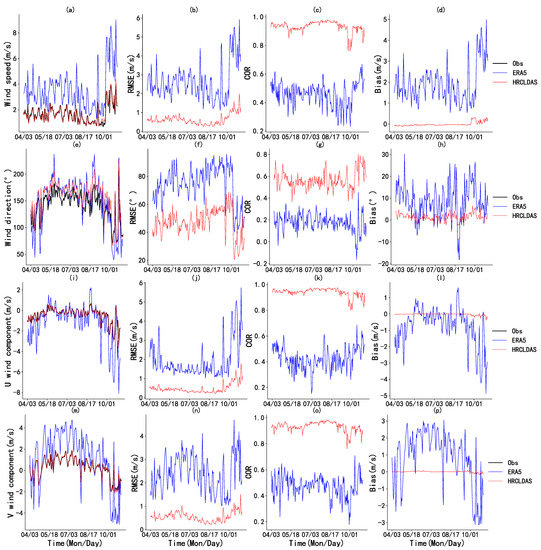
5. Analysis of Time Series Variation

6. Comparative Analysis of Land and Sea
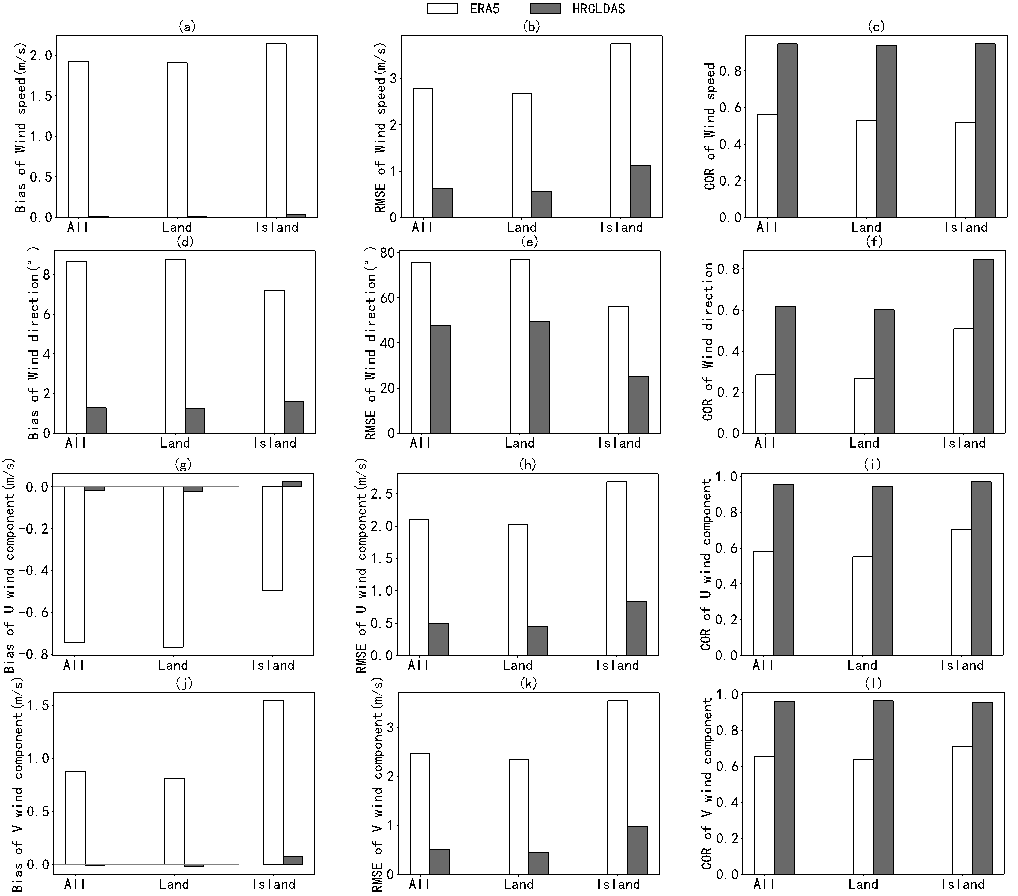
The performance of the two wind data products from April to October 2020 for Hainan Island land stations and island stations, respectively, were evaluated to analyze the performance of ERA5 and HRCLDAS wind products over land and sea. There are 70 island stations in Hainan Province, and Figure 3 shows the evaluation results.

Figure 3. Evaluation indicators of ERA5 and HRCLDAS for land and sea. Bias of near-surface wind speed (a), wind direction (d), U component (g), and V component (j); RMSE of near-surface wind speed (b), wind direction (e), U component (h), and V component (k); COR of near-surface wind speed (c), wind direction (f), U component (i), and V component (l).
In general, HRCLDAS wind products had a smaller bias, smaller RMSE, and larger COR for both land and sea islands when compared with ERA5. The quality of the HRCLDAS and ERA5 wind products for islands was slightly better than that for land.
This entry is adapted from the peer-reviewed paper 10.3390/atmos12060766
References
- Kunkel, K.E. Simple Procedures for Extrapolation of Humidity Variables in the Mountainous Western United States. J. Clim. 1989, 2, 656–669.
- Liu, Z. Comparison of versions 6 and 7 3-hourly TRMM multi-satellite precipitation analysis (TMPA) research products. Atmos. Res. 2015, 163, 91–101.
- Yang, F.; Lu, H.; Yang, K.; He, J.; Wang, W.; Wright, J.S.; Li, C.W.; Han, M.L.; Li, Y.S. Evaluation of multiple forcing data sets for precipitation and shortwave radiation over major land areas of China. Hydrol. Earth Syst. Sci. 2017, 21, 5805–5821.
- Rolland, C. Spatial and seasonal variations of air temperature lapse rates in Alpine regions. J. Clim. 2003, 16, 1032–1046.
- Calisir, E.; Soran, M.B.; Akpinar, A. Quality of the ERA5 and CFSR winds and their contribution to wave modelling performance in a semi-closed sea. J. Oper. Oceanogr. 2021.
- Osinski, R.D.; Radtke, H. Ensemble hindcasting of wind and wave conditions with WRF and WAVEWATCH III (R) driven by ERA5. Ocean. Sci. 2020, 16, 355–371.
- Ibarra-Berastegi, G.; Gonzalez-Roji, S.J.; Ulazia, A.; Carreno-Medinabeitia, S.; Saenz, J. Calculation of Lebanon offshore wind energy potential using ERA5 reanalysis: Impact of seasonal air density changes. In Proceedings of the 2019 Fourth International Conference on Advances in Computational Tools for Engineering Applications (Actea), Beirut, Lebanon, 3–5 July 2019.
- Jourdier, B. Evaluation of ERA5, MERRA-2, COSMO-REA6, NEWA and AROME to simulate wind power production over France. Adv. Sci. Res. 2020, 17, 63–77.
- Olauson, J. ERA5: The new champion of wind power modelling? Renew. Energy 2018, 126, 322–331.
- Taszarek, M.; Kendzierski, S.; Pilguj, N. Hazardous weather affecting European airports: Climatological estimates of situations with limited visibility, thunderstorm, low-level wind shear and snowfall from ERA5. Weather Clim. Extrem. 2020, 28.
- Ramon, J.; Lledo, L.; Torralba, V.; Soret, A.; Doblas-Reyes, F.J. What global reanalysis best represents near-surface winds? Q J. Roy. Meteor. Soc. 2019, 145, 3236–3251.
- Laurila, T.K.; Sinclair, V.A.; Gregow, H. Climatology, variability, and trends in near-surface wind speeds over the North Atlantic and Europe during 1979–2018 based on ERA5. Int. J. Climatol. 2021, 41, 2253–2278.
- Butler, B.W.; Wagenbrenner, N.S.; Forthofer, J.M.; Lamb, B.K.; Shannon, K.S.; Finn, D.; Eckman, R.M.; Clawson, K.; Bradshaw, L.; Sopko, P.; et al. High-resolution observations of the near-surface wind field over an isolated mountain and in a steep river canyon. Atmos. Chem. Phys. 2015, 15, 3785–3801.
- Graf, M.; Scherrer, S.C.; Schwierz, C.; Begert, M.; Martius, O.; Raible, C.C.; Bronnimann, S. Near-surface mean wind in Switzerland: Climatology, climate model evaluation and future scenarios. Int. J. Climatol. 2019, 39, 4798–4810.
- Oses, N.; Azpiroz, I.; Marchi, S.; Guidotti, D.; Quartulli, M.; Olaizola, I.G. Analysis of Copernicus’ ERA5 Climate Reanalysis Data as a Replacement for Weather Station Temperature Measurements in Machine Learning Models for Olive Phenology Phase Prediction. Sensors 2020, 20, 6381.
- Kanamitsu, M.; Kistler, R.E.; Reynolds, R.W. NCEP/NCAR reanalysis and the use of satellite data. Adv. Space Res. Ser. 1997, 19, 481–489.
- Kobayashi, C.; Endo, H.; Ota, Y.; Kobayashi, S.; Onoda, H.; Harada, Y.; Onogi, K.; Kamahori, H. Preliminary Results of the JRA-55C, an Atmospheric Reanalysis Assimilating Conventional Observations Only. Sola 2014, 10, 78–82.
- Dong, X.; Wang, Y.T.; Hou, S.G.; Ding, M.H.; Yin, B.L.; Zhang, Y.L. Robustness of the Recent Global Atmospheric Reanalyses for Antarctic Near-Surface Wind Speed Climatology. J. Clim. 2020, 33, 4027–4043.
- Minola, L.; Zhang, F.; Azorin-Molina, C.; Pirooz, A.A.S.; Flay, R.G.J.; Hersbach, H.; Chen, D. Near-surface mean and gust wind speeds in ERA5 across Sweden: Towards an improved gust parametrization. Clim. Dynam. 2020, 55, 887–907.
- Rivas, M.B.; Stoffelen, A. Characterizing ERA-Interim and ERA5 surface wind biases using ASCAT. Ocean. Sci. 2019, 15, 831–852.
- Zhang, W.; Zhang, H.; Liang, H.; Lou, Y.; Cai, Y.; Cao, Y.; Zhou, Y.; Liu, W. On the suitability of ERA5 in hourly GPS precipitable water vapor retrieval over China. J. Geod. 2019, 93, 1897–1909.
- Yu, J.; Zhou, T.J.; Jiang, Z.H.; Zou, L.W. Evaluation of Near-Surface Wind Speed Changes during 1979 to 2011 over China Based on Five Reanalysis Datasets. Atmosphere 2019, 10, 804.
- Zheng, Y. A Preliminary Analysis on the Applicability of ERA5 Reanalysis Data in Guangdong Province. Meteorol. Environ. Res. 2020, 11, 41–46.
- Han, S.; Shi, C.X.; Xu, B.; Sun, S.; Zhang, T.; Jiang, L.P.; Liang, X. Development and Evaluation of Hourly and Kilometer Resolution Retrospective and Real-Time Surface Meteorological Blended Forcing Dataset (SMBFD) in China. J. Meteorol. Res. 2019, 33, 1168–1181.
- Shuai, H.; Shi, C.; Jiang, Z.; Xu, B.; Li, X.; Tao, Z.; Jiang, L.; Xiao, L.; Zhi, Z.; Liu, J. Development and Progress of High Resolution CMA Land Surface Data Assimilation System. Adv. Met. S&T 2018, 8, 102–108.
- Wang, C.X.; Graham, R.M.; Wang, K.G.; Gerland, S.; Granskog, M.A. Comparison of ERA5 and ERA-Interim near-surface air temperature, snowfall and precipitation over Arctic sea ice: Effects on sea ice thermodynamics and evolution. Cryosphere 2019, 13, 1661–1679.
- Hoffmann, L.; Gunther, G.; Li, D.; Stein, O.; Wu, X.; Griessbach, S.; Heng, Y.; Konopka, P.; Muller, R.; Vogel, B.; et al. From ERA-Interim to ERA5: The considerable impact of ECMWF’s next-generation reanalysis on Lagrangian transport simulations. Atmos. Chem. Phys. 2019, 19, 3097–3124.
- Xie, Y.; Koch, S.; McGinley, J.; Albers, S.; Bieringer, P.E.; Wolfson, M.; Chan, M. A Space-Time Multiscale Analysis System: A Sequential Variational Analysis Approach. Mon. Weather Rev. 2011, 139, 1224–1240.
