- Subjects: Computer Science, Artificial Intelligence
- |
- Contributor:
- Dalibor Martišek
- monomial base
- standard Fourier base
- cosine Fourier base
- Dirichlet theorem
- Gibbs effect
This video is adapted from 10.3390/math9182253
1. Introduction
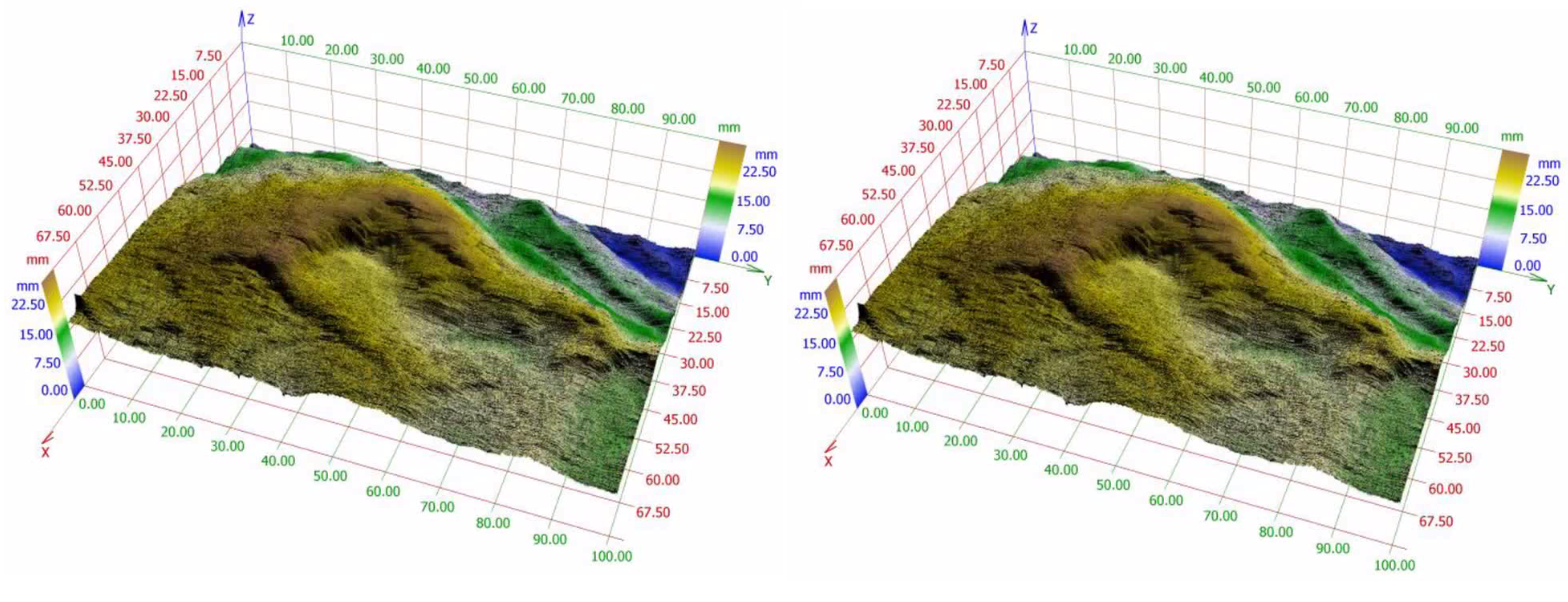
A shape of geological discontinuities plays an important role in influencing the stability of rock masses. Many approaches have been used for its determination. The method of Barton and Choubey 1977 [1] is well known in geotechnical practice. A visual comparison is preferred way for determining values in geotechnical practice. A quick and easy estimate is probably one of the main reasons for this preference. However, this method is very subjective. Therefore, objective methods for estimation are searched. Most of them are based on measurement of diference between fracture surface and an appropriate reference surface. This contribution shows which reference surface is the right one.
2. Characteristics of Fracture Surfaces
Two height characteristics of the 3D profiles are obviously introduced as numerical indicators of a "distance" between surface  f to be study and the reference surface
  :
:


where  is the surface width (height) in pixels. From a statistical point of view, is the average distance of and , is the standard deviation. From a functional analysis point of view, these expressions are the distances of these surfaces in Manhattan (
 ) or Euclidean (
 ) metrics. The question is how to construct a reference surface.
3. Monomial Base in Two Variables
Reference surface can be construct as a linear combination of monomials in two variables  , i.e. as a standard polynomial in two variables
  , i. e.
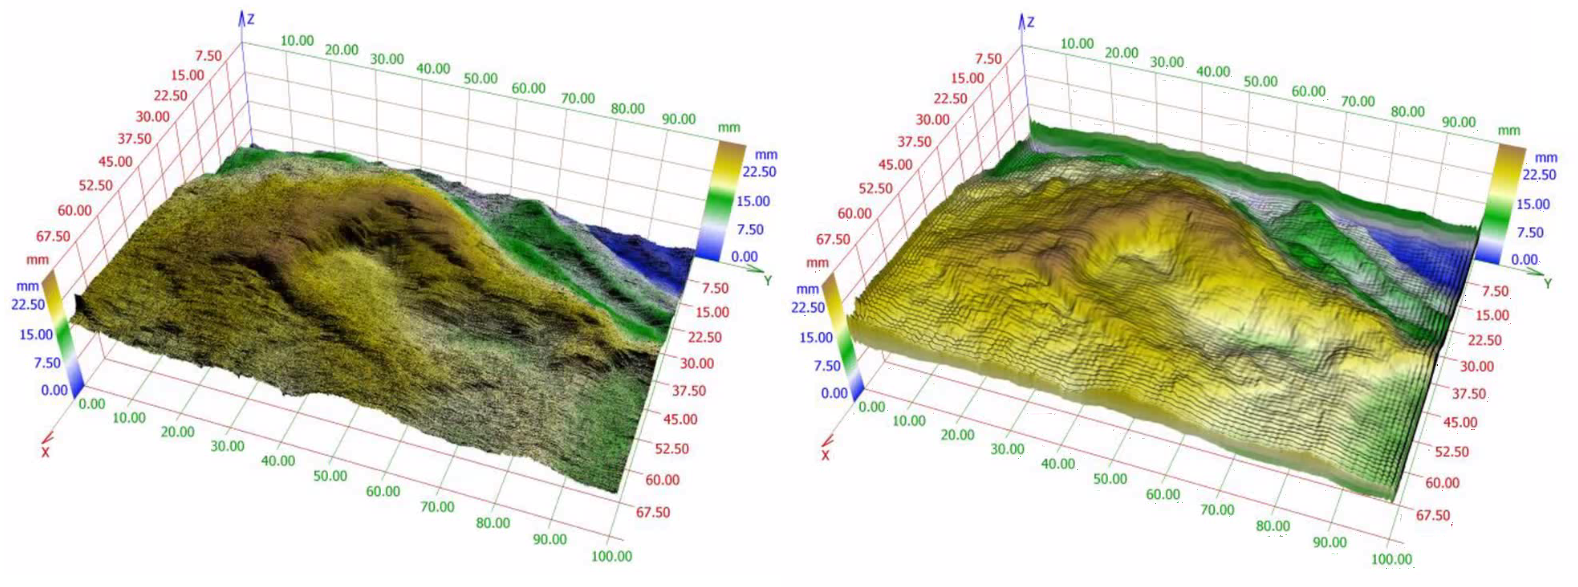
using by least squares method. However, polynomial relatively high degree of polynomial is necessary for useable reference surface. This problem leads to a large system of linear equation. It is badly conditioned because monomial base is “very non-orthogonal” and solution is unuseable – see Figure 1.

Figure 1. Fracture surface (on the left) and its “reference approximation” constructed as standard polynomial of 19th degree.
4. Standard Fourier base in two variables
The scanned relief  ; for
; for  and
and  is possible to expand into Fourier partial sums
  (Standard Fourier sum) combining both the sine and cosine harmonics
where
and


 where
where 
is a ground plan of the scanned relief [2].
This base is orthogonal and it is not necessary to solve any equation system. It means it is relatively easy to find very long expansion. However, there is an other problem.
Theorem (Dirichlet): The Fourier series  of a piecewise continuous function
  on interval
  converges to the arithmetic mean of left-hand and right-hand limits of
  for
for  ; i. e.
If is discontinuous in
  then
then  and
and converges to the arithmetic mean of these limits (convergence in the mean). If is continuous in
  then
then and
and  converges to the
  in
in  In the case of 2D by analogy.
The Fourier series converges in the same way to periodic extension of  on
on  . The periodic extension of continuous fracture surface which is expanded to
  (odd extension) is generally not continuous. In Figure 2 on the left, we can see the periodic extension of function
  defined on
  . Due discontinuities on the surface boundary,
  does not converge to surface points here, but to the arithmetic mean of opposite boundary points (so-called convergence in the mean).

Figure 2. Different periodic extensions of the profile to be expanded (red perimeter). Left – discontinuous odd extension by  ; Right – continuous even extension by
  .
.
5. Cosine Fourier Base in Two Variables
The scanned relief  ; for
; for  and
and  is possible to expand into cosine Fourier partial sums
  defined as follows:


where 
is a ground plan of the scanned relief [3].
Periodic extension of continuous fracture surface which is expanded to  is discontinuous (see Figure 2 on the left). It means it suffers from convergence in the mean (se above) and also by so called Gibbs effect, i. e. by ”fake waves” nearby discontinuities. Periodic extension of continuous fracture surface which is expanded to
 is always continuous (see Figure 2 on the right). Therefore, it does not suffer from these defects. In Figure 3, comparing the
  and
and  of the same “profile” - function
  .
.

Figure 3. “Original profile” modelled by the function  (in the middle) was expanded by
  (on the left) and by
  (on the right) in both cases.
6. Results
In Figure 4, expansion by  for real surface. Convergence in the mean and also Gibbs effect are evident in this case.

Figure 4. Aproximation of a real profile (on the left) by  (on the right).
Figure 5 illustrate expansion by  . It has no defects. For
  , the
, the  goes precisely through the surface points.

Figure 5. Aproximation of a real profile with resolution  (on the left) by
 (on the right).
- Barton N, Choubey V.; The strength of rock joints in theory and practice. Rock Mech 1977, 10, 1 - 54, .
- Database 3D Surfaces for Evaluation of Joint Rock Coefficients . Elsevier. Retrieved 2022-2-22
- Elimination of Gibbs and Nyquist–Shannon Phenomena in 3D Image Reconstruction . Springer. Retrieved 2022-2-22
