 +1 credit
| Version | Summary | Created by | Modification | Content Size | Created at | Operation |
|---|---|---|---|---|---|---|
| 1 | Marcello Demi | + 4275 word(s) | 4275 | 2021-09-24 05:21:59 | | | |
| 2 | Jason Zhu | -554 word(s) | 3721 | 2021-09-29 05:15:10 | | | | |
| 3 | Jason Zhu | -554 word(s) | 3721 | 2021-09-29 05:15:36 | | | | |
| 4 | Jason Zhu | -1 word(s) | 3720 | 2021-10-27 12:04:08 | | |
Video Upload Options
Nowadays, the diagnostic value of the artefactual information provided by lung ultrasound images is widely recognized by physicians. In particular, the existence of a correlation between the visual characteristics of the vertical artifacts, which arise from the pleura line, and the genesis (pneumogenic or cardiogenic) of a pulmonary disorder is commonly accepted. However, the link between these visual characteristics and the causes which determine them is still unclear. In order to derive further information from the visual inspection of the vertical artifacts the mechanisms which control the artifact formation must be identified. The link between the visual characteristics of the vertical artifacts (the observed effect) and the distribution of the aerated spaces at the pleural level (the cause) must be addressed. Plausible mechanisms should be illustrated through experimental results and through the theoretical analysis of simple models.
1. Introduction
The hypothesis that ultrasound (US) vertical artifacts, which are observed on lung ultrasound images, are generated through multiple reflections between the surfaces of the aerated spaces seems logical and consolidated thanks to both theoretical knowledge and experimental results [1][2][3][4]. A distribution of aerated spaces separated by a biological medium (channels) acoustically similar to the chest wall acts as an acoustic trap. Once a US pulse reaches the pleura plane through the chest wall, it is partially reflected towards the probe and partially transmitted to the channels provided by a specific distribution of the aerated spaces which characterizes the outer lung surface. The aerated space distribution can be organized as a compact air wall, and in this case, the acoustic energy is essentially reflected back to the probe. The size of the interalveolar septa is reasonably supposed to be comparable with a capillary lumen (less than 10 microns [5]). However, in the presence of a pathology, the aerated spaces can be separated by wider interstitial channels which are made of media that are acoustically similar to the chest wall [4][5][6][7]. In this case, the pulse energy can be partially trapped and subsequently re-radiated towards the probe after multiple reflections between the separated aerated spaces, giving rise to vertical artifacts which arise from the pleura line. A similar effect has been observed with other pairs of materials such as metal immersed in water[8][9]. The imaging parameters play a fundamental role in the formation of the artifacts, and the visibility of a vertical artifact (that is, its brightness, lateral dimension, and length) depends on multiple non-orthogonal factors including the gain, the time gain compensation (TGC), and all the parameters that can be easily set by the operator from the scanner keyboard. Therefore, given the intrinsic variability of the artifacts as a function of multiple non-independent factors, including the human factor, making an objective diagnosis on the basis of the artefactual information is a difficult task.
Despite this, the diagnostic value of the artefactual information provided by lung ultrasound images is currently widely recognized by physicians [13][14][15][16], and yet it is the information regarding the vertical artifacts that attracts their attention most. The existence of a correlation between the visual characteristics of the vertical artifacts, which arise from the pleura line, and the genesis (pneumogenic or cardiogenic) of a pulmonary disorder is commonly accepted[16][17][18]. Moreover, it has been observed that the structure and visibility of the vertical artifacts change when varying the pulse central frequency and that this variation can be used to formulate hypotheses on the nature of the pulmonary disease[4][19][20]. Physicians distinguish vertical artifacts from vertical artifacts which extend to the bottom of the screen (B-lines)[15][20][21] and B-lines from well-structured artifacts (modulated B-lines) [7][22]. However, the link between these visual characteristics and the causes which determine them is still unclear. Moreover, the distinction between short and long artifacts and the distinction between common and structured artifacts are not on/off, and their classification can be critical. An effective preliminary diagnosis, based only on the visual inspection of the vertical artifact, is probably possible. However, the mechanisms which control the artifact formation must be identified and rationally used to convert the artefactual information into anatomic information. The link between the visual characteristics of the vertical artifacts (the observed effect) and the distribution of the aerated spaces at the pleural level (the cause) must be focused in order to provide a physical explanation for the different forms of vertical artifacts that are usually observed on US lung images.
2. Two Simple Models
A distribution of air cylinders in agar gel is initially analyzed. The idea is to drill corresponding holes on two opposite walls of a box, to insert metallic cylinders in the holes so that they can lie between the two opposite walls of the box, to fill the box with a 3% hot solution of agar in water, to wait until the solution acquires its natural consistency (very similar to that of soft tissues) by means of the cooling process, and then to remove the metallic cylinders. The result is that of placing cylindrical air spaces (mimicking the alveoli) in a material that simulates the connective tissue of the lung. Boxes of this type can be easily made by distributing metallic cylinders appropriately in order to simulate various acoustic traps.
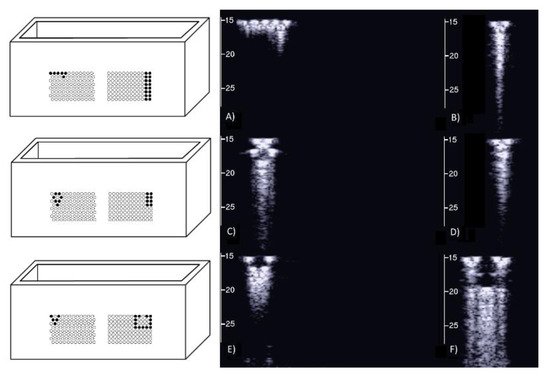
On the left of Figure1 the draft of an empty box with a set of eight metallic cylinders lying between the two opposite sides of the box is shown. Seven 5.1 mm holes and an isolated 5.1 mm hole have been drilled on the two opposite sides of a simple wooden box. While the diameter of the holes was 5.1 mm, seven brass rods and one copper tube with a diameter equal to 5 mm were used to make their positioning easier. The seven holes are practically next to each other except for the two holes at the top which are separated by about 1 mm. The seven holes, which give rise to seven air cylinders in agar gel by means of the procedure described above, form a classic acoustic trap which is accessible from the aperture between the two air cylinders at the top. A strip of material was removed with a 2 mm diameter mill from the upper part of the copper tube and was subsequently inserted in the isolated 5.1 mm hole. In this case, once the agar solution cooled and the seven brass rods and the copper tube were pushed out, an agar volume (similar to a cylinder) surrounded by seven air cylinders was obtained on the left side of the box while on the right side an agar cylinder with a diameter of about 4.5 mm was obtained (the internal diameter of the copper tube). The latter was attached to the rest of the surrounding agar gel by a 2 mm wide and 0.25 mm thick peduncle surrounded by a 0.25 mm thin layer (the wall thickness of the copper tube was equal to 0.25 mm) of air for the remaining part of its surface.
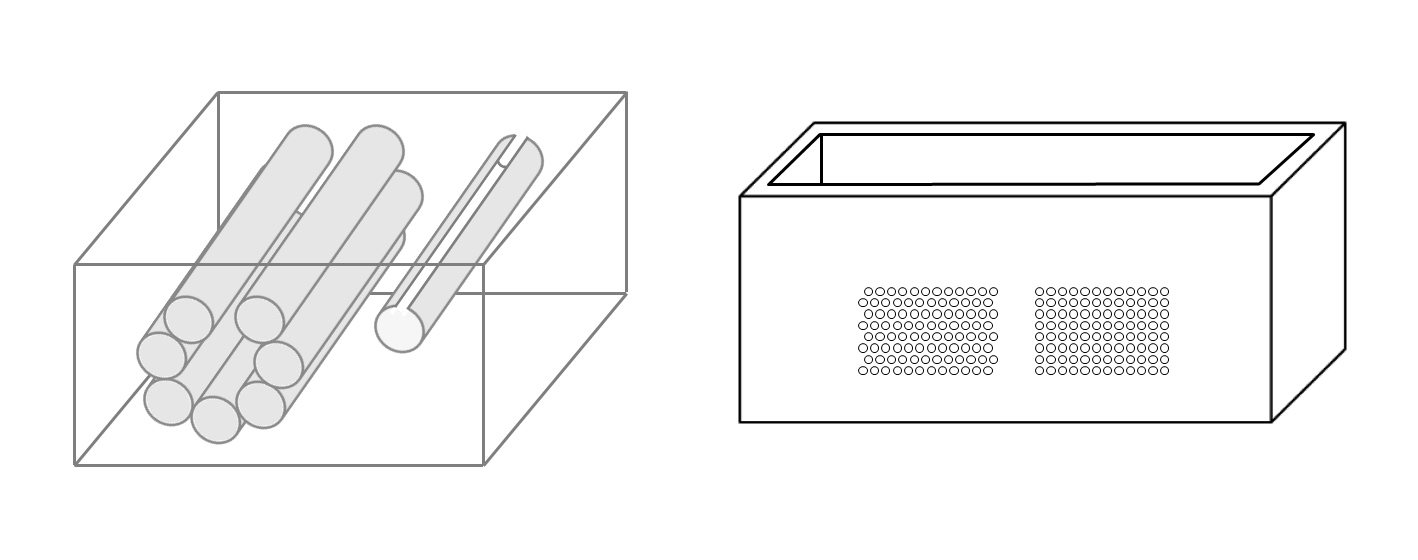
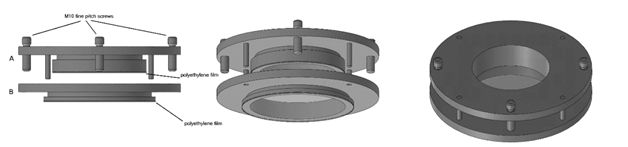
Figure 1. The image on the left shows a draft of an empty box with eight metallic cylinders lying between two opposite sides of the box. The image on the right shows a PVC box where two sets of 1.1 mm holes with a distance of 1.5 mm between their axes have been made using a CNC milling machine.
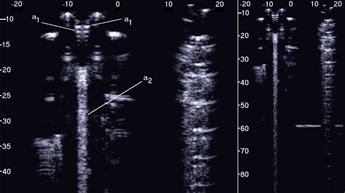
Figure 2 shows the two ultrasound vertical artifacts with different zoom degrees, which were obtained on the models that are illustrated in the left image of Figure 1. The seven air cylinders provide two different types of artifacts (a1 and a2) which are indicated in Figure 2. The pair of short artifacts a1 is provided by multiple reflections between the two air cylinders which limit the aperture of the trap. The longer artifact a2 is generated by the re-radiation of the acoustic energy which has been transmitted to the trap and starts when the beam is reflected from the bottom of the trap. The artifact generated by the agar cylinder has a repetitive pattern that is not seen in the artifact generated by the seven air cylinders and seems to be related to the diameter of the trap. This simple example shows how different artifacts can be obtained from acoustic traps with similar volumes and similar shapes. This example also shows how long artifacts can be obtained when an interstitial volume, surrounded by aerated spaces, is linked to the pleura plane by means of a small (as compared to the interstitial volume) channel.
2.2. A Distribution of Air Cylinders in Agar Gel
Due to the significant results obtained with the above phantom, different distributions of air cylinders in agar gel were also simulated by means of a PVC box where two sets of holes had been made using a CNC milling machine. The image on the right in Figure 1 shows the PVC box with two sets of 1.1 mm holes with a distance of 1.5 mm between their axes. In this case numerous acoustic traps can be simulated by using the same procedure: appropriate distributions of brass rods with a diameter equal to 1 mm are introduced in the holes, the box is subsequently filled with a hot solution of agar in water and at the end of the cooling process the brass rods are removed.
The first test shows what happens when a single row of air cylinders is introduced in the agar gel. The image on the left of Figure 3 shows that in this case, there are no artifacts except the short ones which are generated by multiple reflections between two contiguous air cylinders. In particular, no artifact is generated by a single air cylinder. The situation changes, however, as a row of air cylinders is added, and increasingly longer artifacts are observed as the number of rows of cylinders increases. The two images in the centre and on the right of Figure 3 show the artifacts which were obtained with two and with four rows of air cylinders, respectively. A repetitive pattern is still perceivable, but it is not clearly quantifiable. The thick white lines at the bottom of the three images are given by the reverberations within the bottom wall of the box.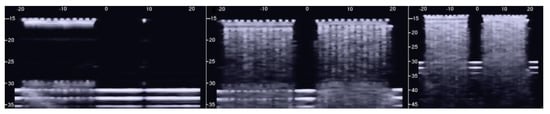
The above tests on the PVC box provided important indications. First of all, the confirmation that the artifacts observed on the ultrasound pulmonary images are probably generated by multiple reflections between the aerated spaces, since the images acquired on the box in the presence of a single air cylinder did not show any artifacts. Moreover, tests on simulated single traps did not give rise to artifacts of significant length. Only in the case of the artifact in Figure 2, which was generated by the seven air cylinders, was an artifact of 12 cm observed. Besides the length of the artifacts, however, another problem arose from the previous tests: none of the artifacts obtained with the air cylinders in agar gel showed those clearly modulated artifacts which are often observed in cardiogenic patients.
3. Agar Gel Samples Completely Surrounded by Air
A phantom in the shape of a cusp was chosen to simulate a volume of fluid linked to the chest wall by means of a thickened interstitial space. A 3% hot solution of agar was poured into some moulds which were obtained with a 3D printer and, once cooled, the agar models were removed from the moulds and checked under a magnifying glass with a digital calliper. Agar cusps such as the one illustrated in Figure 6 with a thickness t varying between 0.1 and 2 mm were obtained. The agar cusps thus obtained are a 3x(4+t)x10 mm parallelepipeds with the upper surface which is modeled as a 2 mm high cusp. The agar samples were then placed between the two polyethylene films taking care to limit the contact of the upper film to the ridge of the agar cusps.
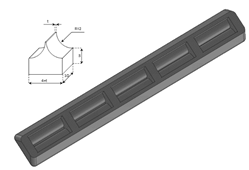
Figure 6. A graphic representation of the agar models with a cusp shape and a drawing of the moulds obtained with the 3D printer are shown.
Figure 7, from left to right, shows the details of the artifacts which were obtained on agar cusps with a thickness t equal to 2, 1, 0.5, 0.3, and 0.1 mm, respectively. A distance of about 4 mm, between the upper polyethylene film and the first reflection generated by the agar cusps, is derived from the figure. This means that the US pulse, once it has been transmitted to the ridge of the agar cusps, propagates through the agar sample and reaches the lower polyethylene film before being reflected towards the probe. Figure 7 shows how modulated B-lines are obtained when the thickness t of the coupling section is equal to 0.5, 0.3, and 0.1 mm, and how confused artifacts are obtained when the latter increases. A slightly confused modulation was obtained when the thickness of the cusp ridge was equal to 1 mm. Modulated artifacts, such as those observed in cardiogenic pathologies, are finally obtained for the first time on deterministic phantoms, and they seem to be correlated to the size of the acoustic channel which links the acoustic trap to the chest wall.
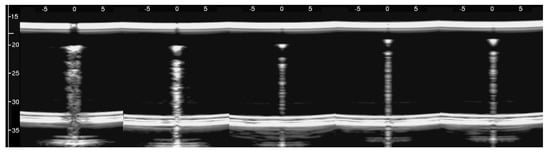
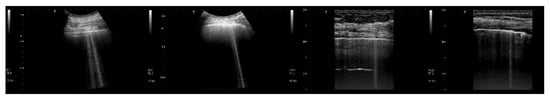
Figure 8 shows four lung US images which have been selected from a data set previously acquired by means of a Toshiba Aplio XV scanner. The two images on the left were acquired with a PVT-375BT convex probe and a central frequency equal to 6 MHz. The two images on the right were acquired with a PLT-704AT linear probe and a central frequency of 7.2 MHz. From left to right, the first image shows two B-lines; the first B-line does not show any modulation, while the second shows a slightly confused modulation. The second image shows a modulated B-line and the third shows a non-modulated B-line. The last image on the right shows a modulated B-line. An analogy with the experimental results illustrated in Figure 7 emerges, and the physicians’ hypothesis regarding the progression of a lung disorder supports this thesis. According to their hypothesis, the interstitial spaces between the alveoli gradually increase with the progression of a pathology, and the modulated B-lines are related only to the early stages of the pathology.
4. Conclusions
The device illustrated in Figure 5 combined with the moulds provided by a 3D printer and the PVC box are versatile tools and can be used to check models of the outer lung surface that physicians may suggest on the basis of their anatomopathological knowledge. The geometry of the models can also be progressively modified to mimic various degrees of severity of a pathology, as in the case of the cusps which have been analysed here when varying the size of their link with the water container. The visual inspection of the artifacts obtained on these models can be a helpful guide for physicians in their interpretation of the clinical data. What is probably most important, however, is the indication provided by the models on the informative content of the visual characteristics of the artefactual information, i.e., an indication of their capability to distinguish two pathologies and estimate their severity. This is another important aspect of the introduced tools; they can be used to investigate the sensitivity of the artifact visual inspection when varying the severity level of a simulated pathology. For example, looking at images in Figure 7, a clear difference among the modulated artifacts obtained when the thickness of the agar cusps varies from 0.5 mm to 0.1 mm does not emerge. According to the experimental results, the visual inspection of these artifacts alone does not allow a physician to distinguish an inter-alveolar space of 0.5 mm (the size of the trap input channel) from an inter-alveolar space of 0.1 mm.
The experimental results obtained on the agar cusps and on simulated interlobular septa support the physicians’ hypothesis, according to which the modulated artifacts are related to the first stages of a pathology, while the presence of simple B-lines is related to advanced stages of the pathology when the interlobular septa and the interstitial spaces between contiguous alveoli are further enlarged.
The experimental results also justify the particular interest of physicians concerning the artifacts which extend to the bottom of the screen, since in our experience, these artifacts can only be provided by particular traps. Very long artifacts are obtained if the trap volume is completely surrounded by air except for a small input/output channel, so that the trapped energy cannot easily leave the trap.
However, the length of a vertical artifact also depends on many imaging parameters (pulse central frequency and bandwidth, pulse amplitude, attenuation, and time gain compensation, just to mention a few), and, consequently, even the same acoustic trap can generate artifacts with different lengths. The artifact length alone does not characterize the trap, and splitting the vertical artifacts into short and long artifacts can be misleading.
Physicians should also carefully consider another experimental result illustrated in this paper. Modulated B-lines have been obtained even with acoustic traps (Figure 6 introduces cusps with a body of 3 mm × 4 mm × 10 mm), which are probably much larger than those they expect to find in patients with cardiogenic edema.References
- Avruch, and P. L. Cooperberg, “The ring down artifact,” J. Ultrasound Med. 41, 21-28 (1985).
- Soldati, R. Copetti, and S. Sher, “Sonographic interstitial syndrome: the sound of lung water,” J. Ultrasound Med. 28(2), 163–174 (2009).
- Kameda, N. Kamiyama, H. Kobayashi, Y. Kanayama, and N. Taniguchi, “Ultrasonic B-line-like artifact generated with simple experimental models provide clues to solve key issues in B-lines,” Ultrasound Med. Biol. 45(7), 1617–1626 (2019).
- Demi, R. Prediletto, G. Soldati, and L. Demi, “Physical mechanisms providing clinical information from ultrasound lung images: hypotheses and early confirmations,” IEEE Transaction on Ultrasound, Ferroelectric, and Frequency Control 67(3), 612-622 (2020).
- R. Weibel, “Exploring the Structural Basis for Pulmonary Gas Exchange,” from The Pulmonary Circulation and Gas Exchange, Wagner WW, Jr, Weir EK (eds), Futura Publishing Co Inc, Armonk, NY, 1994.
- J. Dickinson, and D. K. Nassiri, “Reflection and scattering,” C.R. Hill, J.C. Bamber, G.R. Haar (eds), Physical principles of medical ultrasonics, Wiley, Chichester, 191–220 (2004).
- Soldati, M. Demi, A. Smargiassi, R. Inchingolo, and L. Demi, “The role of ultrasound lung artifacts in the diagnosis of respiratory diseases,” Expert Rev. Respirat. Med. 13(2), 163–172 (2019).
- J. Faran, “Sound scattering by solid cylinders and spheres,” J. Acoust. Soc. Amer. 23(4), 405-418 (1951).
- E. Wille, Analysis of a cylindrical acoustic resonator sound-velocity meter, United States Naval Postgraduate Study, Monterey, California (1957).
- T. Bushberg, J. A. Seibert, E. M. Leidholdt Jr., and J. M. Boone, The essential physics of medical imaging, Philadelphia, PA, USA: Williams & Wilkins (2002).
- C. S. Cobbold, Foundations of biomedical ultrasound, New York: Oxford University Press (2007).
- Demi, “The basics of ultrasound,” in Comprehensive Biomedical Physics, vol. 2, A. Brahme, Ed. Amsterdam, The Netherlands: Elsevier, 297-322 (2014).
- Bouhemad, M. Zhang, Q. Lu, and J. J. Rouby, “Clinical review: bedside lung ultrasound in critical care practice,” Crit. Care 11(1), 205 (2007).
- J. Koenig, M. Narasimhan, and P. H. Mayo, “Thoracic ultrasonography for the pulmonary specialist,” Chest 40, 1332-1341 (2011).
- Volpicelli, M. Elbarbary, M. Blaivas, D. A. Lichtenstein, G. Mathis, A. W. Kirkpatrick, L. Melniker, L. Gargani, V. E. Noble, G. Via, A. Dean, J. W. Tsung, G. Soldati, R. Copetti, B. Bouhemad, A. Reissig, E. Agricola, J. J. Rouby, C. Arbelot, A. Liteplo, A. Sargsyan, F. Silva, R. Hoppmann, R. Breitkreutz, A. Seibel, L. Neri, E. Storti, and T. Petrovic, “International evidence-based recommendations for point-of-care lung ultrasound,” Intensive Care Med. 38(4), 577-591 (2012).
- Lichtenstein, and G. Meziere, “A lung ultrasound sign allowing bedside distinction between pulmonary edema and COPD: the comet-tail artifact,” Intensive Care Med, 24(12), 1331–1334, (1998).
- Copetti, G. Soldati, and P, Copetti, “Chest sonography: a useful tool to differentiate acute cardiogenic pulmonary edema from Acute respiratory distress syndrome,” Cardiovasc Ultrasound 6(16), 1-10 (2008).
- Soldati, and M. Demi, “The use of lung ultrasound images for the differential diagnosis of pulmonary and cardiac interstitial pathology, ” Journal of Ultrasound, 20, 91–96 (2017).
- Soldati, A. Smargiassi, R. Inchingolo, S. Sher, R. Nenna, S. Valente, C. D. Inchingolo, and G. M. Corbo, “Lung ultrasonography may provide an indirect estimation of lung porosity and air space geometry,” Respiration 88, 458–468 (2014).
- Buda, A. Skoczylas, M. Demi, A. Wojteczek, J. Cylwik, and G. Soldati, “Clinical Impact of Vertical Artifacts Changing with Frequency in Lung Ultrasound,” Diagnostics, 11(3), 401 (2021).
- F. Dietrich, G. Mathis, M. Blaivas, G. Volpicelli, A. Seibel, D. Wastl, N.S. Atkinson NS, X.W. Cui, M. Fan, and D. Yi, “Lung B-line artefacts and their use,” J Thorac Dis, 8(6), 1356-1365 (2016).
- Lichtenstein, G. Mezière, P. Biderman, A. Gepner, and O. Barré, “The comet-tail artifact: an ultrasound sign of alveolar interstitial syndrome,” Am. J. Respir. Crit. Care Med. 156(5), 1640-1646 (1997).


