 +1 credit
| Version | Summary | Created by | Modification | Content Size | Created at | Operation |
|---|---|---|---|---|---|---|
| 1 | Jihye Seong | + 4994 word(s) | 4994 | 2021-06-09 09:59:28 | | | |
| 2 | Conner Chen | Meta information modification | 4994 | 2021-06-22 15:19:25 | | |
Video Upload Options
Autophagy is an important cellular process of self-degradation for dysfunctional or unnecessary molecules and organelles, thus dysregulation of autophagy can be involved in various diseases such as neurodegenerative diseases. To understand complex process of autophagy and the related diseases, various methods have been developed, for example biochemical, chemical, and imaging assays. In particular, fluorescent protein (FP)-based autophagy biosensors allow sensitive and selective monitoring of autophagy progression in live cells. After the discovery of green fluorescent protein (GFP), a variety of FPs has been discovered and engineered which have different physicochemical properties, such as excitation/emission spectra, Stokes shift, maturation rate, stability, photo-reactivity and pH-sensitivity. Advances in fluorescent protein technology and FP-based biosensors enabled the real-time monitoring of cellular and molecular events in live cells with high spatiotemporal resolutions.
1. Autophagy and Neurodegenerative Diseases
In this section, we explain three types of autophagy and related molecular mechanisms: macroautophagy, microautophagy and chaperone-mediated autophagy (CMA). Recent progress in autophagy-related diseases has been elaborated well in other fine reviews [1][2][3], thus here we focus on how autophagy is related in particular to neurodegenerative diseases such as Parkinson’s disease, Alzheimer’s disease and Huntington’s disease.
1.1. Autophagy Types
Autophagy is a self-degradation process for dysfunctional or unnecessary cellular components through lysosomal machinery. Depending on the delivery mechanisms to lysosomes and types of cargo, autophagy can be categorized into macroautophagy, microautophagy and chaperone-mediated autophagy (CMA) [4] (Figure 1).
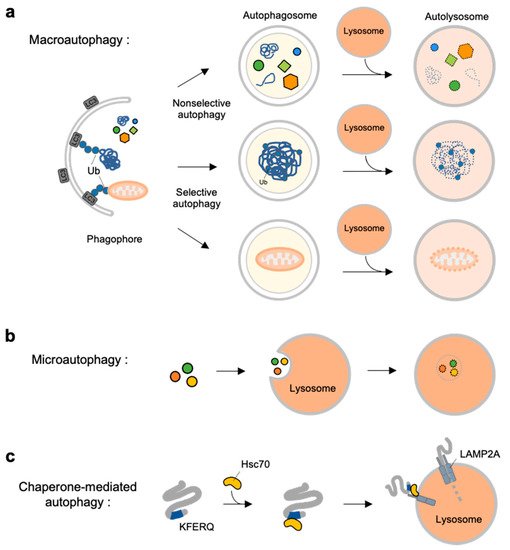
Figure 1. Overview of three types autophagy. (a) Macroautophagy is initiated by assembly of double-membrane called phagophore. Non-selective or selective cargoes are enclosed in autophagosomes. Autophagosomes fuse with lysosomes to become autolysosomes. The cargoes within autolysosome are digested by lysosomal enzymes. (b) In microautophagy, the cargoes directly engulfed by lysosomal membrane and degraded in the lysosome. (c) In chaperone-mediated autophagy (CMA), a selective subset of cytosolic proteins containing a KFERQ-motif is recognized by heat shock cognate protein of 70 kDa (Hsc70). They are delivered to lysosomal membrane by binding to lysosomal-associated membrane protein 2A (LAMP2A). The cargoes are unfolded and translocated inside the lysosome where they are degraded by lysosomal enzymes.
Macroautophagy is initiated by assembly of double-membrane phagophore, and the cargoes are sequestrated within double-membrane vesicles known as autophagosomes [5] (Figure 1a). Autophagosomes then fuse to the lysosome, and the enclosed cargoes are digested by lysosomal enzymes. Macroautophagy can be non-selective or selective: non-selective macroautophagy is a bulk type of autophagy process under starvation for cell survival, and selective macroautophagy is for the degradation of specific substrates, e.g., organelles, aggregated proteins and dysfunctional intracellular components [6]. Selective macroautophagy is named for its special cargoes. For example, mitophagy is selective degradation process of dysfunctional mitochondria, which is often impaired in many diseases such as neurodegenerative diseases, cancer, and metabolic disorder [7]. Other examples for specific macroautophagy include ERphagy, aggrephagy, lipophagy, ribophagy [8].
In contrast to macroautophagy, microautophagy and CMA are the types of autophagy directly occur at lysosomes. In microautophagy, the cargoes are not recruited to the double-membrane autophagosomes but, instead, are directly engulfed by lysosomal membrane [9] (Figure 1b). Finally, chaperone-mediated autophagy is a special autophagy mechanism for a selective subset of cytosolic proteins containing a KFERQ-motif [10] (Figure 1c). The exposed motif on the cargoes can be specifically recognized by heat shock cognate protein of 70 kDa (Hsc70), and delivered to lysosomal membrane via the interaction of the Hsc70 with lysosomal-associated membrane protein 2A (LAMP2A) [11]. The cargoes are then unfolded and translocated inside lysosome where they can finally be degraded by lysosomal enzymes [10][12].
1.2. Molecular Mechanisms at Different Stages of Macroautophagy
Among three types of autophagy, the molecular mechanisms of macroautophagy have been most extensively studied [13][14]. Macroautophagy is initiated by AMP-activated protein kinase (AMPK) activation [15] or mechanistic target of rapamycin (mTOR) inhibition [16], which lead to the subsequent activation of the Unc-51 like kinase 1 (ULK1) complex, comprised of ULK1, autophagy-related protein 13 (Atg13), focal adhesion kinase family interacting protein of 200-kDa (FIP200) and Atg101 [17]. The activated ULK1 mediates Atg9 trafficking for the formation of isolation membranes called phagophore [18][19]. In addition, ULK1 activates the Vps34 complex, composed of Vps34, Vps15, Atg14, and Beclin-1, inducing the generation of phosphatidylinositol 3-phosphate (PI3P) [20]. ULK1 also phosphorylates activating molecule in Beclin 1-regulated autophagy protein 1 (AMBRA1), promoting the translocation of the Vps34 complex to the phagophore [17]. The PI3P-binding proteins, WD-repeat protein interacting with phosphoinositide 1 (WIPI1) and WIPI2, are then recruited at the phagophore and catalyze the ubiquitination-like reactions for the elongation of phagophore [21].
The closure of phagophore is facilitated by the Atg12- Atg5-Atg16L complex, which is conjugated by the Atg7 and Atg10 [22]. This complex promotes the lipidation to Atg8, also called microtubule-associated protein light chain 3 (LC3). Before this step, pro-LC3 is processed by Atg4 to LC3-I which exposes a C-terminal glycine residue. Phosphatidylethanolamine (PE) is then attached to the glycine residue of LC3-I converting it to LC3-II [23]. LC3-II is incorporated at the membrane of autophagosomes and recruits the cargoes bound to autophagy receptors such as SQSTM1/p62, optineurin, NBR1 and NDP52 [24][25][26][27]. LC3-II can be present at both inner and outer surface of the newly formed autophagosomes, then the one at the outer surface is eliminated by Atg4 activity [28]. Autophagosomes fuse to lysosomes generating autolysosomes, and this process is mediated by Rab GTPases, soluble N-Ethylmaleimide-Sensitive Factor Attachment Protein Receptor (SNARE) and tethering factors [29][30]. Autolysosomes are further matured, and finally the recruited cargoes inside autolysosomes are degraded by the lysosomal enzymes [31][32]. Therefore, the stages of macroautophagy can be divided by (1) phagophore formation and elongation, (2) autophagosome formation and cargo enclosure, (3) autophagosome-lysosome fusion and autolysosome formation, and (4) lysosomal degradation. As described above, these stages of macroautophagy are tightly regulated by complex molecular mechanisms with spatial and temporal manners.
1.3. Autophagy Dysfunctions in Neurodegenerative Diseases
Autophagy is crucial for the removal of damaged organelles or aggregation-prone misfolded proteins. Thus, autophagic dysfunction is often found in neurodegenerative diseases, which are featured by the accumulation of toxic aggregates or damaged organelles [33]. For example, Huntington’s disease (HD) is caused by an expansion of the CAG trinucleotide repeat encoding a polyglutamine (polyQ) tract in the N-terminal of Huntingtin (Htt) protein [34]. More than 36 polyQ repeats in HTT cause the formation of toxic Htt aggregates, which are suggested to be cleared by autophagy. However, decreased ability of autophagic vesicles to recognize cytosolic cargos and reduced autophagosomes have been reported in HD [35]. The normal transport of autophagosomes for the fusion with lysosomes is also defective in HD neurons [36]. As a compensatory mechanism, CMA activity is shown to be upregulated in HD [37].
Alzheimer’s disease (AD) is featured by senile plaques composed of amyloid-beta (Aβ) aggregates [38]. Accumulation of autophagosomes and autolysosomes are often observed in AD, suggesting that autophagic flux is impaired [39]. Presenilin 1 (PS-1) mutations, which are known to produce Aβ, are also suggested to impair the acidification of lysosomes thus contributing to dysfunctions in autophagic flux [40]. The released Aβ can exist as monomeric or oligomeric forms and, interestingly, it has been suggested that different Aβ forms have differential effects on autophagy: monomeric Aβ hampers the formation of Bcl-2-Beclin-1 complex and inhibits lysosomal degradation for normal autophagic flux, leading to intracellular accumulation of autophagosomes, while Aβ oligomers facilitate the production of the Bcl-2-Beclin-1 complex thus favoring apoptosis [41]. In addition to Aβ, neurofibrillary tangles from Tau aggregation is another hallmark of AD [42]. Wild-type Tau is degraded by endosomal microautophagy or CMA, but the hyperphosphorylated Tau is subjected to macroautophagy, which is often failed for Tau aggregates [43][44].
Parkinson’s disease (PD) is characterized by neuronal inclusions composed of α-synuclein aggregates, which cause the death of dopaminergic neurons in brain [45]. Normal α-synuclein is primarily degraded by CMA which is impaired in PD [46][47]. Accumulated α-synucleins also dysregulate macroautophagy by inhibition of Rab1 GTPase, which results in the mislocalization of Atg9 [48] thus the failure of phagophore formation [49]. In addition to the dysregulation at this initiation step of macroautophagy, α-synuclein aggregates can also impair the maturation of autophagosome and its fusion with lysosome [50]. For example, neurons with α-synuclein aggregates showed a significantly decreased mobility of autophagosomes toward both retrograde and anterograde directions [51]. This impaired mobility inhibits the fusion process with lysosomes thus resulting in the inhibition of autophagic degradation. Finally, defects in the selective degradation of damaged mitochondria are observed in PD [52]. This failure in mitophagy is related to the mutations in PINK1 and Parkin [53], which are major elements for ubiquitin assembly of damaged mitochondria [54].
As described above, dysfunctions at different stages of all types of autophagy, i.e., CMA, macroautophagy and mitophagy, are reported in various neurodegenerative diseases. Thus, it is crucial to correctly understand the molecular mechanisms of autophagy progression, in particular for the investigation of the strategies to overcome these autophagy-related diseases.
2. Methods for the Detection of Autophagy
To investigate the molecular mechanisms of autophagy and pathology of the related diseases, it is important to sensitively and accurately monitor the progression of autophagy. Various methods have been applied for the detection of autophagy, for example electron microscopy, radioactive isotope-based assay, biochemical assay, and fluorescence imaging [55][56][57]. In this section, we discuss the principles and limitations of these methods.
2.1. Electron Microscopy
Autophagy was first discovered in 1950s from direct observation of autophagic vacuoles containing mitochondria by transmission electron microscopy (TEM) [58]. TEM is an imaging technique to observe the morphology and structure of the specimen by transmission of a beam of electrons [59]. Currently, biochemical assays and fluorescence imaging methods are most widely used to study autophagy, but TEM was the only method to detect autophagy before biochemical assays are developed and specific protein markers for autophagy were discovered in 1990s [59]. TEM still provides indispensable information of ultrastructural details for autophagy, however it is not an optimal method to identify the stages of autophagy or quantify autophagic flux [60], and sample preparation for TEM is more complex than other available methods.
2.2. Autophagic Protein Degradation Assay
For the quantification of autophagic flux, the stable isotope labeling by amino acid in cell culture (SILAC) technique have been applied to measure the degradation rate of long-lived proteins by mass spectrometry [61]. In contrast to short-lived proteins, which are cleared by proteasomes, long-lived proteins are thought to be degraded by autophagic pathways. Thus, after incorporation of 15N/13C-labeled amino acids in the proteins, the radioactive isotope from the long-lived proteins can be measured over time [62][63]. The SILAC assay is suitable for evaluating general degradation rates of the autophagic proteins which represent autophagic flux.
To avoid the use of radioactive materials, autophagic sequestration of an endogenous protein lactate dehydrogenase (LDH) was also measured for the quantification of autophagic flux [64]. LDH is an abundant cytosolic enzyme that is non-selectively wrapped into autophagosomes, thus the sequestration of LDH in autophagic vacuoles and the reduced LDH activity in the cytosol can report the degree of autophagy. These protein degradation assays are useful to inform the general degree of autophagic flux, however, it is limited to identifying different stages of autophagy or monitoring specific molecular events of autophagy mechanisms.
2.3. Biochemical Assay
After the discovery of key biomarkers for autophagy [65][66][67], Western blotting of LC3-II and p62 became a traditional method to study autophagy. As described in the Section 1.2, the lipidation on LC3-I and the formation of LC3-II are critical molecular events for autophagy initiation [32]. The LC3-II is present at the membrane of autolysosomes from the early stage of autophagy until degraded in autolysosomes. Thus, the stages of autophagy can be tracked by Western blotting of LC3-I and LC3-II, which are distinguished by the bands at approximately 16–18 kDa and 14–16 kDa on sodium dodecyl sulfate polyacrylamide gel electrophoresis (SDS-PAGE) gels [68][69]. During the autophagy progression, the conversion from LC3-I to LC3-II band and the subsequent disappearance of LC3-II band can be observed by Western blotting [70].
Blockage of autophagic flux and lysosomal degradation can be suspected by the continuous accumulation of LC3-II band of the Western samples. However, that can be also due to excessive induction of autophagy. To distinguish between excessive induction of autophagy and blockage of autophagic flux, the LC3-II bands can be further compared without and with lysosomal inhibitors such as chloroquine and bafilomycin A1 [71][72]. If the LC3-II accumulation of the samples is further increased by lysosomal inhibitors, it can be due to the excessive induction of autophagy, while the case of blockage of autophagic flux may not be affected by the treatment of inhibitors.
Other autophagy biomarkers are also accessed by Western blotting to demonstrate the progression of autophagy. The most common example is SQSTM1/p62, a major receptor for various ubiquitinated cargoes that brings them to LC3-II-positive autophagosomes [27]. As p62 is degraded together with the cargoes in autolysosomes, the decreased band of p62 can represent the autophagy flux. Therefore, the Western blotting of the time-lapse changes of LC3-II and/or p62 allow for the detection of autophagy progression. However, the preparation of cell lysates is required for Western blotting assay, thus it cannot provide real-time spatiotemporal information of autophagy progression in live cells.
2.4. Chemical Probes
A fluorescent chemical probe named Seoul-Fluor 44 (SF44) was developed [73] and applied for the monitoring of autophagy flux in live cells [74]. Because this indolizine-based chemical moiety becomes bright in the hydrophobic lipid droplets (LDs), which is primarily degraded by autophagy, the number and intensity of SF44-containing LDs are inversely correlated with autophagy flux. Thus, the degree of autophagy in live cells can be quantified by monitoring SF44-positive LDs with a fluorescence microscope. In particular, this method does not require genetic perturbation, washing or fixation steps, and thus can be applied to a high throughput screening system for autophagy modulators.
In addition to autophagosomes, the autolysosomes were monitored by a pH-detecting plasmon Raman probe using surface-enhanced Raman scattering imaging [75]. This sensitive pH-detecting probe consists of gold nanostars as Raman enhanced substrate, 4-mercaptopyridine as Raman reporter molecules, and bovine serum albumin as protective molecules. The probe allows for the sensitive monitoring of pH changes in lysosomes during autophagy. However, these chemical probes are not optimal for the investigation of molecular mechanisms during autophagy progression, which requires the specific targeting of the probes to autophagy biomarkers.
2.5. Fluorescent Protein (FP)-Based Biosensors
Fluorescent proteins are genetically encodable thus can be specifically fused to proteins of interests, allowing for the visualization of their distribution and motions in live cells [76][77]. FP-based biosensors have been developed based on different physicochemical properties of FPs and applied to investigate various molecular and cellular events in live cells [78]. For the monitoring of autophagy progression, FP-based autophagy flux biosensors are designed utilizing different pH-sensitivities of tandem or triple FPs which allow for the detection of pH changes in autophagic vesicles during autophagy progression [79][80][81][82][83][84]. The FP-based autophagy biosensors are specifically tagged with autophagy biomarkers such as LC3 or KFERQ-motif [80][82][83][85], and they can be further targeted to particular subcellular regions, for example mitochondria [86]. These unique features of FP-based autophagy biosensors enabled the sensitive and selective monitoring of the real-time progression of autophagic stages in live cells.
3. FP-Based Biosensors for the Monitoring of Autophagy Progression
In the previous section, we have overviewed various methods to detect or monitor autophagy. In this section, we further focus on the FP-based autophagy biosensors which can monitor the progression of autophagy in live cells. These biosensors are dependent on different pH-sensitivities of tandem or triple FPs. When we choose pH-sensitive FPs for the detection of pH changes in autophagic vesicles, two important factors need to be considered. First, pKa values of the FPs need to be in the physiological pH ranges (between pH 5.5 and 7.5) to detect the changes in fluorescent intensity of autophagic vesicles. Second, the fold changes of fluorescent intensity in this pH range need to be large to be appropriate for the detection of pH changes in autophagic vesicles.
The first engineered pH-sensitive FP is pHluourin (pKa = 7.1), which markedly decreases its green fluorescence below pH 7 [87]. Its improved version, superecliptic pHluourin (SEP, pKa = 7.2), is most widely used as it shows dramatic change of fluorescent intensity (about 50-fold) in the pH ranges between pH 5.5 and pH 7.5 [88]. For the red pH-sensitive FP, which can be used in parallel with green probes, pHTomato (pKa = 7.8) was first developed from monomeric red fluorescent protein (mRFP) and mStrawberry [89]. The improved red pH-sensitive FP, pHuji (pKa = 7.7), was developed from mApple, and it shows 22-fold change of fluorescent intensity between pH 5.5 and pH 7.5 [90]. pHmScarlet (pKa = 7.4), which is recently engineered from mScarlet-I, shows a similar pH-dependent response (26-fold change) but improved brightness and photostability [91]. As the other color FP, pHoran4 (pKa = 7.5) is an orange pH-sensitive FP (17-fold change), engineered from mOrange [90]. In contrast to the FPs which lose the fluorescence signals at acidic pH conditions, pHRed (pKa = 6.6) derived from mKeima increases its fluorescence about 10-fold (ex: 585 nm, em: 610 nm) with decreased emission intensity by 440 nm excitation (ex: 440 nm, em: 610 nm) [92]. Thus, the ratiometric imaging of pHRed by dual excitation can be applied for the visualization of acidic cellular environments [92].
The physicochemical properties of different FPs are summarized in Table 1. We now review the designs, principles and limitations of currently available FP-based autophagy biosensors.
Table 1. Different fluorescent proteins and their physicochemical properties. Different properties of various fluorescent proteins (FPs) are summarized: maximal excitation and emission wavelengths, pKa, extinction coefficient (EC), quantum yield (QY), brightness (a relative brightness, % of enhanced green fluorescent protein (EGFP)), fluorescence fold change between pH 5.5 and 7.5.
| Fluorescent Protein |
λex | λem | pKa | EC | QY | Brightness | Fluorescence Fold Change (pH 5.5–7.5) |
Reference |
|---|---|---|---|---|---|---|---|---|
| mTagBFP2 | 399 | 454 | 2.7 | 50,600 | 0.64 | 32.38 | 1 | [93], This work |
| mTurquoise2 | 434 | 474 | 3.1 | 30,000 | 0.93 | 27.9 | - | [94][95] |
| CFP | 456 | 480 | - | - | - | - | - | [95] |
| PS-CFP2(cyan) | 400 | 468 | - | 43,000 | 0.2 | 8.6 | - | [95] |
| pHRed | 440 | 610 | 6.6 | - | - | - | - | [92] |
| mKeima | 440 | 620 | 6.5 | 14,400 | 0.24 | 3.46 | - | [96][95] |
| EGFP | 488 | 507 | 6 | 55,900 | 0.6 | 33.54 | 1 | [95], This work |
| PS-CFP2(green) | 490 | 511 | - | 47,000 | 0.23 | 10.81 | - | [95] |
| mWasabi | 493 | 509 | 6.5 | 70,000 | 0.8 | 56 | - | [95][97] |
| SE-pHluorin | 495 | 512 | 7.2 | - | - | - | 50 | [90] |
| pHoran1 | 547 | 564 | 6.7 | - | - | - | 10 | [90] |
| pHoran4 | 547 | 561 | 7.5 | - | - | - | 17 | [90] |
| mOrange | 548 | 562 | 6.5 | 71,000 | 0.69 | 48.99 | 5 | [90][95] |
| mApple | 548 | 592 | 6.5 | 75,000 | 0.49 | 36.75 | 4 | [90][95] |
| pHTomato | 550 | 580 | 7.8 | - | - | - | - | [89] |
| tdTomato | 554 | 581 | 4.7 | 138,000 | 0.69 | 95.22 | - | [95] |
| mNectarine | 558 | 578 | 6.9 | 58,000 | 0.45 | 30 | 6 | [98][95] |
| DsRed | 558 | 583 | - | 72,500 | 0.68 | 49.3 | - | [95][99] |
| pHmScarlet | 562 | 585 | 7.4 | 85,000 | 0.47 | 39.73 | - | [91] |
| PAmCherry1 | 564 | 595 | 6.3 | 18,000 | 0.46 | 8.28 | - | [95][100] |
| pHuji | 566 | 598 | 7.7 | 31,000 | 0.22 | 6.82 | 22 | [90][95] |
| mScarlet | 569 | 594 | 5.3 | 100,000 | 0.7 | 70 | 1.3 | [95], This work |
| mRFP1 | 584 | 607 | 4.5 | 50,000 | 0.25 | 12.5 | - | [89][101] |
| mCherry | 587 | 610 | 4.5 | 72,000 | 0.22 | 15.84 | 1 | [99], This work |
| mKate2 | 588 | 633 | 5.4 | 62,500 | 0.4 | 25 | 1.3 | [96], This work |
| mKate | 588 | 635 | 6.2 | 45,000 | 0.33 | 14.85 | - | [95][102] |
| HcRed | 592 | 645 | - | 20,000 | 0.015 | 0.3 | - | [95] |
The colors represent the colors for particular wavelengths of light.
3.1. GFP-LC3
The simple strategy of FP-based biosensor to visualize autophagy progression in live cells is utilizing GFP-tagged LC3, which can directly monitor the formation of LC3-containing autophagosomes [68] (Figure 2). As described in the Section 1.2 and Section 2.3, LC3-II can be a representative autophagy marker presents at autophagic vesicles [103]. GFP-tagged LC3 expressed in cells are observed as fluorescent puncta or ring-shaped structures, indicating the existence of autophagosomes or autolysosomes. The number of GFP-LC3 puncta can be used as an indicator of autophagy induction [104][105]. LC3 tagged with various colors of FPs, for example EGFP, YFP, CFP, RFP, mCherry and HcRed, have been used to monitor autophagosomes in live cells [106][107][108][109][110][111] (Figure 2a).
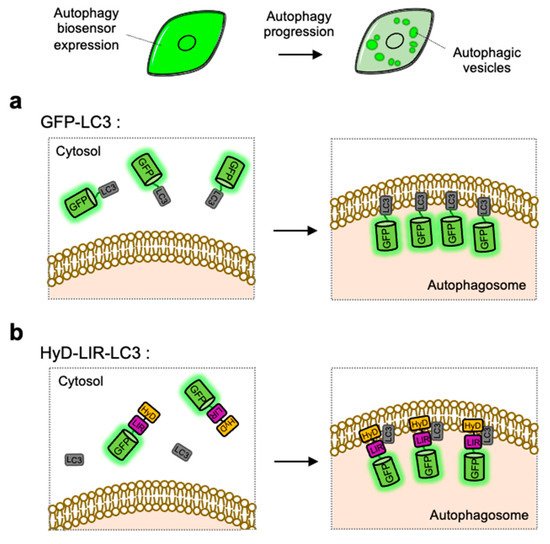
Figure 2. Detection of autophagic vesicles by single FP-tagged light chain 3 (LC3) or LC3 interacting region (LIR) domain. When autophagy is induced, single green fluorescent protein (GFP)-tagged LC3 or LIR domains can change its distribution from whole cell area to autophagic vesicles displaying as bright green puncta. (a) Scheme of the GFP-LC3 before and after autophagy induction. (b) Scheme of the hydrophobic domain (HyD)-LIR-LC3 before and after autophagy induction. LIR: LC3-interacting region, HyD: hydrophobic domain.
However, in a simple observation of LC3-positive vesicles it is difficult to identify the stages of autophagy progression, thus additional makers for lysosome such as LysoTracker are required to distinguish between autophagosome and autolysosome [57]. In addition, as explained in Section 2, lysosomal inhibitors need to be further applied when we test whether the accumulation of LC3-positive puncta is derived from excessive induction of autophagy or blockage of autophagic flux.
3.2. HyD-LIR-GFP
LC3-positive autophagosomes can be directly monitored by GFP-tagged LC3, however the observed puncta are not from endogenous LC3 but from overexpressed exogenous LC3 [112]. For the visualization of endogenous LC3, HyD-LIR-GFP was developed which is composed of a short hydrophobic domain (HyD) for membrane targeting, a LC3 interacting region (LIR) motif, and GFP [113] (Figure 2b). After, the LIR motifs from 34 LC3-interacting proteins were screened, it was shown that HyD-LIR(Fy)-GFP, containing the LIR motif from FYCO1, allows the specific visualization of LC3-positive autophagosomes. Therefore, HyD-LIR-GFP can be utilized as autophagy biosensors which directly label endogenous LC3-positive autophagosomes.
While HyD-LIR-GFP can avoid the overexpression of exogenous LC3 which may cause unwanted effects, this biosensor also can cause the overexpression of LIR motif which may compete with endogenous LIR-containing proteins. Thus it is generally important to optimize the expression level of the exogenous biosensors. In addition, as in the case of LC3-GFP, it is still difficult to identify exact stages of autophagy by the detection of autophagic vesicles with HyD-LIR-GFP.
3.3. RFP-GFP-LC3
As discussed above, the monitoring of LC3-positive autophagosomes by single FP-tagged autophagy biosensors is not sufficient to report different stages of autophagy. During the progression of autophagy, the pH inside autophagic vesicles changes to be more acidic, pH-sensitive FPs are applied to distinguish between autophagosomes and autolysosomes [81][84][114]. In particular, LC3 was fused to tandem FPs with different pH-sensitivity and spectral profiles [79][81][84][114] (Figure 3a).
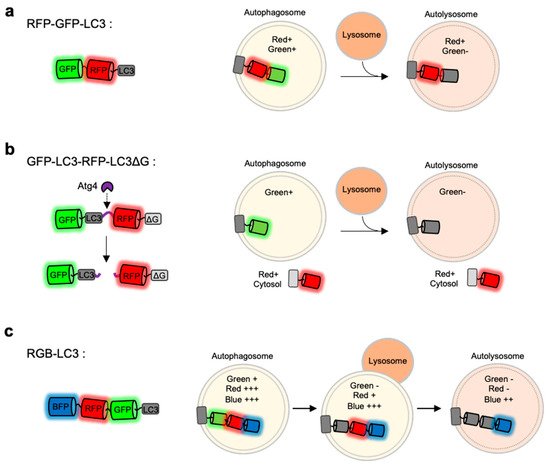
Figure 3. Monitoring of autophagy progression by tandem or triple FPs with different pH-sensitivity (a) RFP-GFP-LC3 is a tandem FP-tagged LC3 sensor consisting a pH-sensitive GFP and a pH-stable RFP. Both green and red signals are expected in autophagosomes, while green signal disappears in autolysosomes. (b) GFP-LC3-RFP-LC3∆G is composed of GFP-LC3 and RFP-LC3∆G linked by a substrate for an autophagy initiating protease Atg4. When autophagy is induced, the activated Atg cleaves the substrate, generating GFP-LC3 and RFP-LC3∆G. The released GFP-LC3 can be localized at autophagic vesicles, while the RFP-LC3∆G remains in the cytosol serving as an internal control for GFP-LC3. (c) Red-green-blue-LC3 (RGB-LC3) is composed of three colors of FPs with different pH-sensitivity: a highly pH-sensitive superecliptic pHluourin (SEP, pKa = 7.2), a pH-stable mTagBFP2 (pKa = 2.7), and mApple (pKa = 6.5) with intermediate pKa and pH-sensitivity. The RGB-LC3 sensor allows for the monitoring of different stages of autophagy.
For example, mRFP-GFP-LC3 includes a pH-sensitive EGFP (pKa = 6.0), a relatively pH-stable mRFP (pKa = 4.5) [81]. When the LC3-positive autophagic vesicles become acidic by the fusion of lysosomes, the GFP signal decreases while mRFP signal can be remained. Thus, autophagy progression can be predicted by detecting green and red signals at the LC3-positive vesicles. Similarly, mCherry-EGFP-LC3 shows the pH-sensitive green signal from EGFP (pKa = 6.0) and relatively stable red signal from mCherry (pKa = 4.5) [27]. However, EGFP in these sensors still shows a weak fluorescence even at acidic autolysosomes [84][115], thus green+ red+ autophagic vesicles can be both autophagosomes and autolysosomes. Therefore, careful quantification is required for the accurate analysis of autophagy status.
To overcome this limitation, the mTagRFP-mWasabi-LC3 was developed [84]. The pKa of mWasabi is 6.5 [116], thus compared to EGFP, its fluorescence decreases at acidic environments more sensitively. In addition, mTagRFP (pKa = 3.8) is very stable in acidic pH [76][117]. However, the green signal from mWasabi was still detected at autolysosomes, thus green+ red+ and green− red+ signals cannot still represent autophagosome and autolysosomes, respectively.
Next, mKate-SEP-LC3 was developed, which contains a highly pH-sensitive SEP (pKa = 7.2) and a relatively stable mKate (pKa = 5.4) [83]. As the pKa of SEP is around 7 and the intensity change is around 50-fold between pH 5.5 and pH 7.5 [87], the autolysosomes can be represented by green− red+ signals of mKate-SEP-LC3. However, the highly pH-sensitive SEP signal can be also lost even in the autophagosomes, thus green− red+ vesicles may be detected from autophagosomes as well as autolysosomes.
3.4. Red, Green and Blue (RGB)-LC3
The FP-based autophagy biosensors composed of LC3 and tandem FPs are not sufficient to identify different status of autophagy progression. Thus the autophagy flux biosensor Red-Green-Blue-LC3 (RGB-LC3) was recently developed, which is composed of three colors of FPs with different pH-sensitivity [80] (Figure 3c). For the FPs in the RGB-LC3, SEP (pKa = 7.2) was selected as a highly pH-sensitive green FP, and mTagBFP2 (pKa = 2.7) was chosen for a pH-stable blue FP. Additionally, mApple (pKa = 6.5) [118], a red FP whose pKa value and the pH-sensitivity are between the ones from SEP and mTagBFP2, was selected to complete RGB-LC3. After the induction of autophagy in the cells expressing RGB-LC3, the formation of autophagosome can be detected by the disappearance of the SEP signal. During the progression of autophagy, the red signal from mApple gradually decreases while mTagBFP2 signal is very stable. Thus the intensity ratios of mApple/BFP2 at the LC-positive autophagic vesicles can display the pH changes in the ranges of the entire autophagy progression, i.e., phagophore, autophagosome, autophagosome-lysosome fusion, and autolysosomes. Therefore, the RGB-LC3 allows for the monitoring of different stages of autophagy.
3.5. GFP-LC3-RFP-LC3∆G
GFP-LC3-RFP-LC3∆G is composed of GFP-LC3 and RFP-LC3∆G linked by a substrate for the autophagy initiating protease Atg4 [79] (Figure 3b). When autophagy is induced, Atg4 can cleave the biosensor into GFP-LC3 and RFP-LC3∆G. The released GFP-LC3 can be conjugated to PE and localize to the autophagosomes. Conversely, the RFP-LC3∆G does not contain the C-terminal glycine, which is critical for the PE conjugation, thus remains in the cytosol serving as an internal control for GFP-LC3. Therefore, green puncta of the GFP-LC3 part can visualize the formation and degradation of autophagic vesicles during autophagy, while red signal from the RFP-LC3∆G part is constant in the cytosol. Thus, the GFP/RFP signal ratio can represent the status of autophagy progression. This approach was also successfully applied for high-throughput detection of the level of autophagic flux in vivo as well as in cells.
3.6. Fluorescence Resonance Energy Transfer (FRET)-Based Autophagy Sensor
pHlameleons are pH sensors based on fluorescence resonance energy transfer (FRET) between a pH-sensitive FP and a pH-stable FP [119]. For example, a pH-sensitive yellow EYFP (pKa = 6.9) and a pH-stable cyan ECFP (pKa = 4.8) can be an acceptor and a donor for the FRET pair of pHlameleons [120][121][122]. This principle was applied to Cy11.5, a chimeric protein composed of tightly concatenated CFP and YFP thus has a highly efficient orientation for FRET [123]. In the pH ranges of pH 5 and pH 9, the emission of the pH-sensitive EYFP decreases at acidic environment thus resulting in the decreased FRET between ECFP and EYFP. pHlameleons were further improved by replacing ECFP with a more stable cyan FP
Variant mTurquoise2 (pKa = 3.1) [94][120]. This FRET-based pH sensor with mTurquoise2 and EYFP was named as pH-Lemon, and further fused to or other organelles to visualize the pH levels of different intracellular vesicles [124]. The LC3-tagged pH-Lemon confirmed the acidification of LC3-positive autophagic vesicles in the subcellular levels. Further validation is required for the application to an autophagy flux biosensor.
3.7. Mitophagy Sensor
The FRET-based mitophagy biosensor was recently developed to monitor selective macroautophagy for damaged mitochondria [125]. As a donor for the FRET biosensor, a very stable cyan FP named TOLLES (TOLerance of Lysosomal EnvironmentS) was applied, which is originally from Anthozoans and optimized to be resistant to lysosomal degradation as well as acidic pH (pKa < 3) [126]. This stable cyan FP TOLLES was paired with YPet, a yellow FP which is irreversibly denatured and degraded in the lysosomes, and this FRET-based autophagy flux sensor was named the SRAI (signal-retaining autophagy indicator) [125][126]. The SRAI shows strong FRET between TOLLES and YPet in neural cytosol. While TOLLES is stable during the autophagy process, the YPet signal gradually decreases and completely disappears as degraded in the lysosomes. Thus, the autophagy progression can be monitored by the FRET changes between TOLLES and YPet in the SRAI.
For the detection of mitophagy, the SRAI was strictly targeted to mitochondria, through a tandem repeat of the COX VIII presequence [127] and the additional C-terminal degrons CL1 [128] and PEST [129]. This FRET-based mitophagy sensor was named mito-SRAI, and it allows for the monitoring of the lysosomal degradation status by mitophagy in cells and also in vivo [125] (Figure 4). In particular, the signal of a stable cyan TOLLES is fully retained in the fixed cells, mito-SRAI can be successfully applied to large-scale high-throughput screening of a selective mitophagy inducer. Furthermore, mito-SRAI can detect the mitophagy from the fixed brain tissues in a mouse model of Parkinson’s disease.
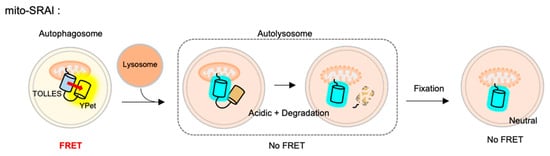
Figure 4. The fluorescence resonance energy transfer (FRET)-based mitophagy biosensor.Mito-SRAI (signal-retaining autophagy indicator) consists a sable cyan FP TOLLES (TOLerance of Lysosomal EnvironmentS) and a yellow FP YPet, as a FRET pair, and strict targeting sequences to mitochondria. Because TOLLES is stable to pH changes and lysosomal degradation, this FRET-based mitophagy sensor allows for accurate monitoring of mitophagy process in live and fixed cells.
While other FRET-based autophagy biosensors were focused on different pH-sensitivity of tandem FPs, the SRAI further considered the degradation rates of these FPs in the lysosomes. In particular, if the pH-stable donor FP is easily degraded in the lysosomes, the FRET signals may not be correctly interpreted for the stages of autophagy progression. Thus the discovery of TOLLES, a stable cyan FP resistant to lysosomal degradation as well as acidic pH, is important for the development of the FRET-based autophagy biosensor. Further targeting of the SRAI to other organelles will be useful for the monitoring of selective autophagy.
3.8. Chaperone-Mediated Autophagy Sensor
CMA is a special type of autophagy for the proteins containing KFERQ motif. When the KFERQ-motif is exposed from the proteins, the motif is recognized by the cytosolic chaperone Hsc70, and they can be conveyed to the lysosome by interaction of Hsc70 and LAMP2 [10]. For the FP-based CMA biosensor, KFERQ-PS-CFP2 was developed by the fusion of the KFERQ-containing sequences with a photoconvertible cyan FP (PS-CFP2) [85] (Figure 5). In the default state, PS-CFP is a cyan FP (ex: 405 nm, em: 468 nm), but upon photoactivation with 405 nm, PS-CFP is irreversibly converted to a green FP (ex: 490 nm, em: 511 nm) [130]. Thus, a photoconverted population of KFERQ-PS-CFP2 can be selectively monitored by green puncta near the lysosomal membranes. Newly synthesized KFERQ-PS-CFP2 after the illumination will be cyan in the cytosol, thus it can provide a good contrast to green puncta which reporting the CMA. Similarly, a photoactivable mCherry-fused CMA reporter, KFERQ-PA-mCherry, has also been generated as a red version of CMA sensor.
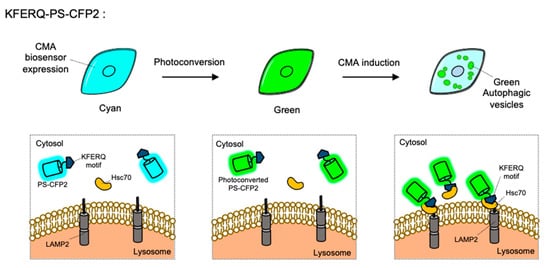
Figure 5. The chaperone-mediated autophagy (CMA) biosensor. The CMA biosensor is composed of the KFERQ-motif and PS-CFP2, a photoconvertible cyan FP. Before photostimulation, the KFERQ-PS-CFP2 is observed as cyan color in whole cell area (left). Upon illumination, PS-CFP2 in the CMA biosensor changes its color to green (middle). After the induction of CMA, the KFERQ-motif in the CMA biosensor is recognized by Hsc70, which can deliver it to LAMP2 at lysosomes. Thus CMA process can be visualized by green puncta (right).
References
- Mizushima, N.; Levine, B. Autophagy in Human Diseases. N. Engl. J. Med. 2020, 383, 15641576.
- Bar-Yosef, T.; Damri, O.; Agam, G. Dual Role of Autophagy in Diseases of the Central Nervous System. Front. Cell Neurosci. 2019, 13, 196.
- Mulcahy Levy, J.M.; Thorburn, A. Autophagy in cancer: Moving from understanding mechanism to improving therapy responses in patients. Cell Death Differ. 2020, 27, 843–857.
- Yim, W.W.; Mizushima, N. Lysosome biology in autophagy. Cell Discov. 2020, 6, 6.
- Rubinsztein, D.C.; Shpilka, T.; Elazar, Z. Mechanisms of autophagosome biogenesis. Curr. Biol. 2012, 22, R29–R34.
- Reggiori, F.; Komatsu, M.; Finley, K.; Simonsen, A. Autophagy: More than a nonselective pathway. Int J. Cell Biol. 2012, 2012, 219625.
- Palikaras, K.; Lionaki, E.; Tavernarakis, N. Mechanisms of mitophagy in cellular homeostasis, physiology and pathology. Nat. Cell Biol. 2018, 20, 1013–1022.
- Klionsky, D.J.; Cuervo, A.M.; Dunn, W.A., Jr.; Levine, B.; van der Klei, I.; Seglen, P.O. How shall I eat thee? Autophagy 2007, 3, 413–416.
- Schuck, S. Microautophagy—Distinct molecular mechanisms handle cargoes of many sizes. J. Cell Sci. 2020, 133, 17.
- Kaushik, S.; Cuervo, A.M. The coming of age of chaperone-mediated autophagy. Nat. Rev. Mol. Cell Biol. 2018, 19, 365–381.
- Kaushik, S.; Cuervo, A.M. Chaperone-mediated autophagy: A unique way to enter the lysosome world. Trends Cell Biol. 2012, 22, 407–417.
- Kaushik, S.; Bandyopadhyay, U.; Sridhar, S.; Kiffin, R.; Martinez-Vicente, M.; Kon, M.; Orenstein, S.J.; Wong, E.; Cuervo, A.M. Chaperone-mediated autophagy at a glance. J. Cell Sci. 2011, 124, 495–499.
- Feng, Y.; He, D.; Yao, Z.; Klionsky, D.J. The machinery of macroautophagy. Cell Res. 2014, 24, 24–41.
- Mehrpour, M.; Esclatine, A.; Beau, I.; Codogno, P. Overview of macroautophagy regulation in mammalian cells. Cell Res. 2010, 20, 748–762.
- Hardie, D.G. AMPK and autophagy get connected. EMBO J. 2011, 30, 634–635.
- Kim, Y.C.; Guan, K.L. mTOR: A pharmacologic target for autophagy regulation. J. Clin. Invest. 2015, 125, 25–32.
- Zachari, M.; Ganley, I.G. The mammalian ULK1 complex and autophagy initiation. Essays Biochem. 2017, 61, 585–596.
- Feng, Y.; Klionsky, D.J. Autophagic membrane delivery through ATG9. Cell Res. 2017, 27, 161–162.
- Mack, H.I.; Zheng, B.; Asara, J.M.; Thomas, S.M. AMPK-dependent phosphorylation of ULK1 regulates ATG9 localization. Autophagy 2012, 8, 1197–1214.
- Burman, C.; Ktistakis, N.T. Regulation of autophagy by phosphatidylinositol 3-phosphate. FEBS Lett. 2010, 584, 1302–1312.
- Proikas-Cezanne, T.; Takacs, Z.; Donnes, P.; Kohlbacher, O. WIPI proteins: Essential PtdIns3P effectors at the nascent autophagosome. J. Cell Sci. 2015, 128, 207–217.
- Walczak, M.; Martens, S. Dissecting the role of the Atg12-Atg5-Atg16 complex during autophagosome formation. Autophagy 2013, 9, 424–425.
- Agrotis, A.; von Chamier, L.; Oliver, H.; Kiso, K.; Singh, T.; Ketteler, R. Human ATG4 autophagy proteases counteract attachment of ubiquitin-like LC3/GABARAP proteins to other cellular proteins. J. Biol. Chem. 2019, 294, 12610–12621.
- Khaminets, A.; Behl, C.; Dikic, I. Ubiquitin-Dependent And Independent Signals In Selective Autophagy. Trends Cell Biol. 2016, 26, 6–16.
- Kirkin, V.; Lamark, T.; Sou, Y.S.; Bjorkoy, G.; Nunn, J.L.; Bruun, J.A.; Shvets, E.; McEwan, D.G.; Clausen, T.H.; Wild, P.; et al. A role for NBR1 in autophagosomal degradation of ubiquitinated substrates. Mol. Cell 2009, 33, 505–516.
- Kirkin, V.; Rogov, V.V. A Diversity of Selective Autophagy Receptors Determines the Specificity of the Autophagy Pathway. Mol. Cell 2019, 76, 268–285.
- Pankiv, S.; Clausen, T.H.; Lamark, T.; Brech, A.; Bruun, J.A.; Outzen, H.; Overvatn, A.; Bjorkoy, G.; Johansen, T. p62/SQSTM1 binds directly to Atg8/LC3 to facilitate degradation of ubiquitinated protein aggregates by autophagy. J. Biol. Chem. 2007, 282, 24131–24145.
- Maruyama, T.; Noda, N.N. Autophagy-regulating protease Atg4: Structure, function, regulation and inhibition. J. Antibiot. (Tokyo) 2018, 71, 72–78.
- Ao, X.; Zou, L.; Wu, Y. Regulation of autophagy by the Rab GTPase network. Cell Death Differ. 2014, 21, 348–358.
- Wang, Y.; Li, L.; Hou, C.; Lai, Y.; Long, J.; Liu, J.; Zhong, Q.; Diao, J. SNARE-mediated membrane fusion in autophagy. Semin Cell Dev. Biol. 2016, 60, 97–104.
- Nixon, R.A. The role of autophagy in neurodegenerative disease. Nat. Med. 2013, 19, 983–997.
- Tanida, I.; Ueno, T.; Kominami, E. LC3 conjugation system in mammalian autophagy. Int J. Biochem. Cell Biol. 2004, 36, 2503–2518.
- Chung, C.G.; Lee, H.; Lee, S.B. Mechanisms of protein toxicity in neurodegenerative diseases. Cell Mol. Life Sci. 2018, 75, 3159–3180.
- Harjes, P.; Wanker, E.E. The hunt for huntingtin function: Interaction partners tell many different stories. Trends Biochem. Sci. 2003, 28, 425–433.
- Martinez-Vicente, M.; Talloczy, Z.; Wong, E.; Tang, G.; Koga, H.; Kaushik, S.; de Vries, R.; Arias, E.; Harris, S.; Sulzer, D.; et al. Cargo recognition failure is responsible for inefficient autophagy in Huntington’s disease. Nat. Neurosci. 2010, 13, 567–576.
- Wong, Y.C.; Holzbaur, E.L. The regulation of autophagosome dynamics by huntingtin and HAP1 is disrupted by expression of mutant huntingtin, leading to defective cargo degradation. J. Neurosci. 2014, 34, 1293–1305.
- Koga, H.; Martinez-Vicente, M.; Arias, E.; Kaushik, S.; Sulzer, D.; Cuervo, A.M. Constitutive upregulation of chaperone-mediated autophagy in Huntington’s disease. J. Neurosci. 2011, 31, 18492–18505.
- Nixon, R.A. Autophagy, amyloidogenesis and Alzheimer disease. J. Cell Sci. 2007, 120, 4081–4091.
- Boland, B.; Kumar, A.; Lee, S.; Platt, F.M.; Wegiel, J.; Yu, W.H.; Nixon, R.A. Autophagy induction and autophagosome clearance in neurons: Relationship to autophagic pathology in Alzheimer’s disease. J. Neurosci. 2008, 28, 6926–6937.
- Neely, K.M.; Green, K.N.; LaFerla, F.M. Presenilin is necessary for efficient proteolysis through the autophagy-lysosome system in a gamma-secretase-independent manner. J. Neurosci 2011, 31, 2781–2791.
- Guglielmotto, M.; Monteleone, D.; Piras, A.; Valsecchi, V.; Tropiano, M.; Ariano, S.; Fornaro, M.; Vercelli, A.; Puyal, J.; Arancio, O.; et al. Abeta1-42 monomers or oligomers have different effects on autophagy and apoptosis. Autophagy 2014, 10, 1827–1843.
- Iqbal, K. Tau in Alzheimer Disease and Related Tauopathies. Curr Alzheimer Res. 2010, 7, 656–664.
- Jiang, S.; Bhaskar, K. Degradation and Transmission of Tau by Autophagic-Endolysosomal Networks and Potential Therapeutic Targets for Tauopathy. Front. Mol. Neurosci. 2020, 13, 586731.
- Menzies, F.M.; Fleming, A.; Caricasole, A.; Bento, C.F.; Andrews, S.P.; Ashkenazi, A.; Fullgrabe, J.; Jackson, A.; Jimenez Sanchez, M.; Karabiyik, C.; et al. Autophagy and Neurodegeneration: Pathogenic Mechanisms and Therapeutic Opportunities. Neuron 2017, 93, 1015–1034.
- Stefanis, L. alpha-Synuclein in Parkinson’s disease. Cold Spring Harb Perspect Med. 2012, 2, a009399.
- Cuervo, A.M. Impaired Degradation of mutant alpha synuclein of chaperone-mediated autophagy. Science 2004, 305, 1292–1295.
- Vogiatzi, T.; Xilouri, M.; Vekrellis, K.; Stefanis, L. Wild type alpha-synuclein is degraded by chaperone-mediated autophagy and macroautophagy in neuronal cells. J. Biol Chem. 2008, 283, 23542–23556.
- Winslow, A.R.; Chen, C.W.; Corrochano, S.; Acevedo-Arozena, A.; Gordon, D.E.; Peden, A.A.; Lichtenberg, M.; Menzies, F.M.; Ravikumar, B.; Imarisio, S.; et al. alpha-Synuclein impairs macroautophagy: Implications for Parkinson’s disease. J. Cell Biol. 2010, 190, 1023–1037.
- Coune, P.G.; Bensadoun, J.C.; Aebischer, P.; Schneider, B.L. Rab1A over-expression prevents Golgi apparatus fragmentation and partially corrects motor deficits in an alpha-synuclein based rat model of Parkinson’s disease. J. Parkinsons Dis. 2011, 1, 373–387.
- Tanik, S.A.; Schultheiss, C.E.; Volpicelli-Daley, L.A.; Brunden, K.R.; Lee, V.M. Lewy body-like alpha-synuclein aggregates resist degradation and impair macroautophagy. J. Biol. Chem. 2013, 288, 15194–15210.
- Volpicelli-Daley, L.A.; Gamble, K.L.; Schultheiss, C.E.; Riddle, D.M.; West, A.B.; Lee, V.M. Formation of alpha-synuclein Lewy neurite-like aggregates in axons impedes the transport of distinct endosomes. Mol. Biol. Cell 2014, 25, 4010–4023.
- Malpartida, A.B.; Williamson, M.; Narendra, D.P.; Wade-Martins, R.; Ryan, B.J. Mitochondrial Dysfunction and Mitophagy in Parkinson’s Disease: From Mechanism to Therapy. Trends Biochem. Sci. 2021, 46, 329–343.
- Pickrell, A.M.; Youle, R.J. The roles of PINK1, parkin, and mitochondrial fidelity in Parkinson’s disease. Neuron 2015, 85, 257–273.
- Ge, P.; Dawson, V.L.; Dawson, T.M. PINK1 and Parkin mitochondrial quality control: A source of regional vulnerability in Parkinson’s disease. Mol. Neurodegener 2020, 15, 20.
- Mizushima, N.; Yoshimori, T.; Levine, B. Methods in mammalian autophagy research. Cell 2010, 140, 313–326.
- Mizushima, N. Methods for monitoring autophagy. Int J. Biochem. Cell Biol. 2004, 36, 2491–2502.
- du Toit, A.; Hofmeyr, J.S.; Gniadek, T.J.; Loos, B. Measuring autophagosome flux. Autophagy 2018, 14, 1060–1071.
- Rhodin, J. Correlation of Ultrastructural Organization and Function in Normal and Experimentally Changed Proximal Convoluted Tubule Cells of the Mouse Kidney: An Electron Microscopic Study Including an Experimental Analysis of the Conditions For Fixation of the Renal Tissue For High Reso-Lution Electron Microscopy. Ph.D. Thesis, Karolinska Institutet, Stockholm, Sweden, 1954.
- Eskelinen, E.L.; Reggiori, F.; Baba, M.; Kovacs, A.L.; Seglen, P.O. Seeing is believing: The impact of electron microscopy on autophagy research. Autophagy 2011, 7, 935–956.
- Barth, S.; Glick, D.; Macleod, K.F. Autophagy: Assays and artifacts. J. Pathol. 2010, 221, 117–124.
- Bauvy, C.; Meijer, A.J.; Codogno, P. Chapter 4 Assaying of Autophagic Protein Degradation. Autophagy Mamm. Syst. Part B 2009, 452, 47–61.
- Zhang, T.; Wolfe, C.; Pierle, A.; Welle, K.A.; Hryhorenko, J.R.; Ghaemmaghami, S. Proteome-wide modulation of degradation dynamics in response to growth arrest. Proc. Natl. Acad. Sci. USA 2017, 114, E10329–E10338.
- Zhang, T.; Price, J.C.; Nouri-Nigjeh, E.; Li, J.; Hellerstein, M.K.; Qu, J.; Ghaemmaghami, S. Kinetics of precursor labeling in stable isotope labeling in cell cultures (SILAC) experiments. Anal. Chem. 2014, 86, 11334–11341.
- Luhr, M.; Szalai, P.; Saetre, F.; Gerner, L.; Seglen, P.O.; Engedal, N. A Simple Cargo Sequestration Assay for Quantitative Measurement of Nonselective Autophagy in Cultured Cells. Methods Enzymol. 2017, 587, 351–364.
- Lamark, T.; Svenning, S.; Johansen, T. Regulation of selective autophagy: The p62/SQSTM1 paradigm. Essays Biochem. 2017, 61, 609–624.
- Kirisako, T.; Ichimura, Y.; Okada, H.; Kabeya, Y.; Mizushima, N.; Yoshimori, T.; Ohsumi, M.; Takao, T.; Noda, T.; Ohsumi, Y. The Reversible Modification Regulates the Membrane-Binding State of Apg8 Aut7 essential for autophagy and the cytoplasm to vacuole targeting pathway. J. Cell Biol. 2000, 151, 263–275.
- Wild, P.; McEwan, D.G.; Dikic, I. The LC3 interactome at a glance. J. Cell Sci. 2014, 127, 3–9.
- Kabeya, Y.; Mizushima, N.; Ueno, T.; Yamamoto, A.; Kirisako, T.; Noda, T.; Kominami, E.; Ohsumi, Y.; Yoshimori, T. LC3, a mammalian homologue of yeast Apg8p, is localized in autophagosome membranes after processing. EMBO J. 2000, 19, 5720–5728.
- Mizushima, N.; Yoshimori, T. How to interpret LC3 immunoblotting. Autophagy 2007, 3, 542–545.
- Cui, D.; Sun, D.; Wang, X.; Yi, L.; Kulikowicz, E.; Reyes, M.; Zhu, J.; Yang, Z.J.; Jiang, W.; Koehler, R.C. Impaired autophagosome clearance contributes to neuronal death in a piglet model of neonatal hypoxic-ischemic encephalopathy. Cell Death Dis. 2017, 8, e2919.
- Mauthe, M.; Orhon, I.; Rocchi, C.; Zhou, X.; Luhr, M.; Hijlkema, K.J.; Coppes, R.P.; Engedal, N.; Mari, M.; Reggiori, F. Chloroquine inhibits autophagic flux by decreasing autophagosome-lysosome fusion. Autophagy 2018, 14, 1435–1455.
- Mauvezin, C.; Neufeld, T.P. Bafilomycin A1 disrupts autophagic flux by inhibiting both V-ATPase-dependent acidification and Ca-P60A/SERCA-dependent autophagosome-lysosome fusion. Autophagy 2015, 11, 1437–1438.
- Kim, E.; Koh, M.; Lim, B.J.; Park, S.B. Emission wavelength prediction of a full-color-tunable fluorescent core skeleton, 9-aryl-1,2-dihydropyrrolo[3,4-b]indolizin-3-one. J. Am. Chem Soc. 2011, 133, 6642–6649.
- Lee, S.; Kim, E.; Park, S.B. Discovery of autophagy modulators through the construction of a high-content screening platform via monitoring of lipid droplets. Chem. Sci. 2013, 4, 8.
- Li, S.S.; Zhang, M.; Wang, J.H.; Yang, F.; Kang, B.; Xu, J.J.; Chen, H.Y. Monitoring the Changes of pH in Lysosomes during Autophagy and Apoptosis by Plasmon Enhanced Raman Imaging. Anal. Chem. 2019, 91, 8398–8405.
- Chudakov, D.M.; Matz, M.V.; Lukyanov, S.; Lukyanov, K.A. Fluorescent proteins and their applications in imaging living cells and tissues. Physiol Rev. 2010, 90, 1103–1163.
- Shaner, N.C.; Patterson, G.H.; Davidson, M.W. Advances in fluorescent protein technology. J. Cell Sci 2007, 120, 4247–4260.
- Kim, H.; Ju, J.; Lee, H.N.; Chun, H.; Seong, J. Genetically Encoded Biosensors Based on Fluorescent Proteins. Sensors 2021, 21, 3.
- Kaizuka, T.; Morishita, H.; Hama, Y.; Tsukamoto, S.; Matsui, T.; Toyota, Y.; Kodama, A.; Ishihara, T.; Mizushima, T.; Mizushima, N. An Autophagic Flux Probe that Releases an Internal Control. Mol. Cell 2016, 64, 835–849.
- Kim, H.; Kim, H.; Choi, J.; Inn, K.S.; Seong, J. Visualization of Autophagy Progression by a Red-Green-Blue Autophagy Sensor. ACS Sens. 2020, 5, 3850–3861.
- Kimura, S.; Noda, T.; Yoshimori, T. Dissection of the autophagosome maturation process by a novel reporter protein, tandem fluorescent-tagged LC3. Autophagy 2007, 3, 452–460.
- Maulucci, G.; Chiarpotto, M.; Papi, M.; Samengo, D.; Pani, G.; De Spirito, M. Quantitative analysis of autophagic flux by confocal pH-imaging of autophagic intermediates. Autophagy 2015, 11, 1905–1916.
- Tanida, I.; Ueno, T.; Uchiyama, Y. A super-ecliptic, pHluorin-mKate2, tandem fluorescent protein-tagged human LC3 for the monitoring of mammalian autophagy. PLoS ONE 2014, 9, e110600.
- Zhou, C.; Zhong, W.; Zhou, J.; Sheng, F.; Fang, Z.; Wei, Y.; Chen, Y.; Deng, X.; Xia, B.; Lin, J. Monitoring autophagic flux by an improved tandem fluorescent-tagged LC3 (mTagRFP-mWasabi-LC3) reveals that high-dose rapamycin impairs autophagic flux in cancer cells. Autophagy 2012, 8, 1215–1226.
- Koga, H.; Martinez-Vicente, M.; Macian, F.; Verkhusha, V.V.; Cuervo, A.M. A photoconvertible fluorescent reporter to track chaperone-mediated autophagy. Nat. Commun. 2011, 2, 386.
- D’Acunzo, P.; Strappazzon, F.; Caruana, I.; Meneghetti, G.; Di Rita, A.; Simula, L.; Weber, G.; Del Bufalo, F.; Dalla Valle, L.; Campello, S.; et al. Reversible induction of mitophagy by an optogenetic bimodular system. Nat. Commun. 2019, 10, 1533.
- Miesenbock, G.; De Angelis, D.A.; Rothman, J.E. Visualizing secretion and synaptic transmission with pH-sensitive green fluorescent proteins. Nature 1998, 394, 192–195.
- Sankaranarayanan, S.; De Angelis, D.; Rothman, J.E.; Ryan, T.A. The Use of pHluorins for Optical Measurements of Presynaptic Activity. Biophys. J. 2000, 79, 2199–2208.
- Li, Y.; Tsien, R.W. pHTomato, a red, genetically encoded indicator that enables multiplex interrogation of synaptic activity. Nat. Neurosci. 2012, 15, 1047–1053.
- Shen, Y.; Rosendale, M.; Campbell, R.E.; Perrais, D. pHuji, a pH-sensitive red fluorescent protein for imaging of exo- and endocytosis. J. Cell Biol. 2014, 207, 419–432.
- Liu, A.; Huang, X.; He, W.; Xue, F.; Yang, Y.; Liu, J.; Chen, L.; Yuan, L.; Xu, P. pHmScarlet is a pH-sensitive red fluorescent protein to monitor exocytosis docking and fusion steps. Nat. Commun. 2021, 12, 1413.
- Tantama, M.; Hung, Y.P.; Yellen, G. Imaging intracellular pH in live cells with a genetically encoded red fluorescent protein sensor. J. Am. Chem Soc. 2011, 133, 10034–10037.
- Subach, O.M.; Cranfill, P.J.; Davidson, M.W.; Verkhusha, V.V. An enhanced monomeric blue fluorescent protein with the high chemical stability of the chromophore. PLoS ONE 2011, 6, e28674.
- Goedhart, J.; von Stetten, D.; Noirclerc-Savoye, M.; Lelimousin, M.; Joosen, L.; Hink, M.A.; van Weeren, L.; Gadella, T.W., Jr.; Royant, A. Structure-guided evolution of cyan fluorescent proteins towards a quantum yield of 93%. Nat. Commun 2012, 3, 751.
- Lambert, T.J. FPbase: A community-editable fluorescent protein database. Nat. Methods. 2019, 16, 277–278.
- Kogure, T.; Karasawa, S.; Araki, T.; Saito, K.; Kinjo, M.; Miyawaki, A. A fluorescent variant of a protein from the stony coral Montipora facilitates dual-color single-laser fluorescence cross-correlation spectroscopy. Nat. Biotechnol. 2006, 24, 577–581.
- Shaner, N.C.; Lambert, G.G.; Chammas, A.; Ni, Y.; Cranfill, P.J.; Baird, M.A.; Sell, B.R.; Allen, J.R.; Day, R.N.; Israelsson, M.; et al. A bright monomeric green fluorescent protein derived from Branchiostoma lanceolatum. Nat. Methods 2013, 10, 407–409.
- Johnson, D.E.; Ai, H.W.; Wong, P.; Young, J.D.; Campbell, R.E.; Casey, J.R. Red fluorescent protein pH biosensor to detect concentrative nucleoside transport. J. Biol. Chem. 2009, 284, 20499–20511.
- Gross, L.A.; Baird, G.S.; Hoffman, R.C.; Baldridge, K.K.; Tsien, R.Y. The structure of the chromophore within DsRed, a red fluorescent protein from coral. Proc. Natl. Acad. Sci. USA 2000, 97, 11990–11995.
- Subach, F.V.; Patterson, G.H.; Manley, S.; Gillette, J.M.; Lippincott-Schwartz, J.; Verkhusha, V.V. Photoactivatable mCherry for high-resolution two-color fluorescence microscopy. Nat. Methods 2009, 6, 153–159.
- Bindels, D.S.; Haarbosch, L.; van Weeren, L.; Postma, M.; Wiese, K.E.; Mastop, M.; Aumonier, S.; Gotthard, G.; Royant, A.; Hink, M.A.; et al. mScarlet: A bright monomeric red fluorescent protein for cellular imaging. Nat. Methods 2017, 14, 53–56.
- Shcherbo, D.; Merzlyak, E.M.; Chepurnykh, T.V.; Fradkov, A.F.; Ermakova, G.V.; Solovieva, E.A.; Lukyanov, K.A.; Bogdanova, E.A.; Zaraisky, A.G.; Lukyanov, S.; et al. Bright far-red fluorescent protein for whole-body imaging. Nat. Methods 2007, 4, 741–746.
- Kabeya, Y.; Mizushima, N.; Yamamoto, A.; Oshitani-Okamoto, S.; Ohsumi, Y.; Yoshimori, T. LC3, GABARAP and GATE16 localize to autophagosomal membrane depending on form-II formation. J. Cell Sci. 2004, 117, 2805–2812.
- Leeman, D.S.; Hebestreit, K.; Ruetz, T.; Webb, A.E.; McKay, A.; Pollina, E.A.; Dulken, B.W.; Zhao, X.; Yeo, R.W.; Ho, T.T.; et al. Lysosome activation clears aggregates and enhances quiescent neural stem cell activation during aging. Science 2018, 359, 1277–1283.
- Lee, I.H.; Cao, L.; Mostoslavsky, R.; Lombard, D.B.; Liu, J.; Bruns, N.E.; Tsokos, M.; Alt, F.W.; Finkel, T. A role for the NAD-dependent deacetylase Sirt1 in the regulation of autophagy. Proc. Natl. Acad. Sci. USA 2008, 105, 3374–3379.
- Bains, M.; Heidenreich, K.A. Chapter 7 Live-Cell Imaging of Autophagy Induction and Autophagosome-Lysosome Fusion in Primary Cultured Neurons. Autophagy Dis. Clin. Appl. Part C 2009, 453, 145–158.
- Demarchi, F.; Bertoli, C.; Copetti, T.; Tanida, I.; Brancolini, C.; Eskelinen, E.L.; Schneider, C. Calpain is required for macroautophagy in mammalian cells. J. Cell Biol. 2006, 175, 595–605.
- Flavin, W.P.; Bousset, L.; Green, Z.C.; Chu, Y.; Skarpathiotis, S.; Chaney, M.J.; Kordower, J.H.; Melki, R.; Campbell, E.M. Endocytic vesicle rupture is a conserved mechanism of cellular invasion by amyloid proteins. Acta Neuropathol. 2017, 134, 629–653.
- Jahreiss, L.; Menzies, F.M.; Rubinsztein, D.C. The itinerary of autophagosomes: From peripheral formation to kiss-and-run fusion with lysosomes. Traffic 2008, 9, 574–587.
- Mizushima, N.; Yamamoto, A.; Hatano, M.; Kobayashi, Y.; Kabeya, Y.; Suzuki, K.; Tokuhisa, T.; Ohsumi, Y.; Yoshimori, T. Dissection of autophagosome formation using Apg5-deficient mouse embryonic. J. Cell Biol. 2001, 152, 657–667.
- Tanida, I.; Yamaji, T.; Ueno, T.; Ishiura, S.; Kominami, E.; Hanada, K. Consideration about negative controls for LC3 and expression vectors for four colored fluorescent protein-LC3 negative controls. Autophagy 2008, 4, 131–134.
- Erin, M.; Buckingham, J.E.C. Wallen Jackson Charles Grose, Nuclear LC3-positive puncta in stressed cells do not represent autophagosomes. Biotechniques 2018, 57, 241–244.
- Lee, Y.K.; Jun, Y.W.; Choi, H.E.; Huh, Y.H.; Kaang, B.K.; Jang, D.J.; Lee, J.A. Development of LC3/GABARAP sensors containing a LIR and a hydrophobic domain to monitor autophagy. EMBO J. 2017, 36, 1100–1116.
- Rosado, C.J.; Mijaljica, D.; Hatzinisiriou, I.; Prescott, M.; Devenish, R.J. Rosella: A fluorescent pH-biosensor for reporting vacuolar turnover of cytosol and organelles in yeast. Autophagy 2008, 4, 205–213.
- Patterson, G.H.; Knobel, S.M.; Sharif, W.D.; Kain, S.R.; Piston, D.W. Use of the green fluorescent protein and its mutants in quantitative fluorescence microscopy. Biophys. J. 1997, 73, 2782–2790.
- Ai, H.W.; Olenych, S.G.; Wong, P.; Davidson, M.W.; Campbell, R.E. Hue-shifted monomeric variants of Clavularia cyan fluorescent protein: Identification of the molecular determinants of color and applications in fluorescence imaging. BMC Biol. 2008, 6, 13.
- Merzlyak, E.M.; Goedhart, J.; Shcherbo, D.; Bulina, M.E.; Shcheglov, A.S.; Fradkov, A.F.; Gaintzeva, A.; Lukyanov, K.A.; Lukyanov, S.; Gadella, T.W.; et al. Bright monomeric red fluorescent protein with an extended fluorescence lifetime. Nat. Methods 2007, 4, 555–557.
- Shaner, N.C.; Lin, M.Z.; McKeown, M.R.; Steinbach, P.A.; Hazelwood, K.L.; Davidson, M.W.; Tsien, R.Y. Improving the photostability of bright monomeric orange and red fluorescent proteins. Nat. Methods 2008, 5, 545–551.
- Esposito, A.; Gralle, M.; Dani, M.A.C.; Lange, D.; Wouters, F.S. pHlameleons: A Family of FRET-Based Protein Sensors for Quantitative pH Imaging. Biochemistry 2008, 47, 13115–13126.
- Kremers, G.; Goedhart, J.; van Munster, E.B.; Gadella, T.W.J. Cyan and Yellow Super Fluorescent Proteins with Improved Brightness, Protein Folding, and FRET Förster Radius. Biochemistry 2006, 45, 6570–6580.
- Elsliger, M.; Wachter, R.M.; Hanson, G.T.; Kallio, K.; Remington, S.J. Structural and Spectral Response of Green Fluorescent Protein Variants to Changes in pH. Biochemistry 1999, 38, 5296–5301.
- Nagai, T.; Ibata, K.; Park, E.S.; Kubota, M.; Mikoshiba, K.; Miyawaki, A. A variant of yellow fluorescent protein with fast and efficient maturation for cell-biological applications. Nat. Biotechnol. 2002, 20, 87–90.
- Shimozono, S.; Hosoi, H.; Mizuno, H.; Fukano, T.; Tahara, T.; Miyawaki, A. Concatenation of Cyan and Yellow Fluorescent Proteins for Efficient Resonance Energy Transfer. Biochemistry 2006, 45, 6267–6271.
- Burgstaller, S.; Bischof, H.; Gensch, T.; Stryeck, S.; Gottschalk, B.; Ramadani-Muja, J.; Eroglu, E.; Rost, R.; Balfanz, S.; Baumann, A.; et al. pH-Lemon, a Fluorescent Protein-Based pH Reporter for Acidic Compartments. ACS Sens. 2019, 4, 883–891.
- Katayama, H.; Hama, H.; Nagasawa, K.; Kurokawa, H.; Sugiyama, M.; Ando, R.; Funata, M.; Yoshida, N.; Homma, M.; Nishimura, T.; et al. Visualizing and Modulating Mitophagy for Therapeutic Studies of Neurodegeneration. Cell 2020, 181, 1176–1187.e16.
- Karasawa, S.; Araki, T.; Yamamoto-Hino, M.; Miyawaki, A. A green-emitting fluorescent protein from Galaxeidae coral and its monomeric version for use in fluorescent labeling. J. Biol. Chem. 2003, 278, 34167–34171.
- Rudolf, R.; Mongillo, M.; Magalhaes, P.J.; Pozzan, T. In vivo monitoring of Ca(2+) uptake into mitochondria of mouse skeletal muscle during contraction. J. Cell Biol. 2004, 166, 527–536.
- Gilon, T.; Chomsky, O.; Kulka, R.G. Degradation signals for ubiquitin system proteolysis in Saccharomyces cerevisiae. EMBO J. 1998, 17, 2759–2766.
- Ghoda, L.; Sidney, D.; Macrae, M.; Coffino, P. Structural elements of Ornithine decarboxylase required for intracellular degradation and polyamine-dependent regulation. Mol. Cell. Biol. 1992, 12, 2178–2185.
- Chudakov, D.M.; Verkhusha, V.V.; Staroverov, D.B.; Souslova, E.A.; Lukyanov, S.; Lukyanov, K.A. Photoswitchable cyan fluorescent protein for protein tracking. Nat. Biotechnol. 2004, 22, 1435–1439.


