 +1 credit
| Version | Summary | Created by | Modification | Content Size | Created at | Operation |
|---|---|---|---|---|---|---|
| 1 | Zhizhong Sun | + 3827 word(s) | 3827 | 2021-05-19 05:24:22 | | | |
| 2 | Karina Chen | Meta information modification | 3827 | 2021-06-01 04:45:23 | | | | |
| 3 | Karina Chen | Meta information modification | 3827 | 2021-06-01 04:49:01 | | |
Video Upload Options
Measurement of optical properties is critical for understanding light-tissue interaction, properly interpreting measurement data, and gaining better knowledge of tissue physicochemical properties. However, conventional optical measuring techniques are limited in point measurement, which partly hinders the applications on characterizing spatial distribution and inhomogeneity of optical properties of biological tissues. Spatial-frequency domain imaging (SFDI), as an emerging non-contact, depth-varying and wide-field optical imaging technique, is capable of measuring the optical properties in a wide field-of-view on a pixel-by-pixel basis.
1. Typical SFDI System
As shown in Figure 1a, a typical SFDI system mainly consists of three parts: projection, imaging, and sampling [1][2][3], which are specifically selected based on experimental or practical requirements. An ordinary commercial projector is commonly used in the projection part due to the low cost and easy-to-use property. The light engine produced by Digital Light Innovations in Austin, TX, USA (e.g., model DLi CEL5500) is a better choice for projecting patterns and has been widely used in the SFDI system, since it can obtain high brightness, high definition, and real color images. When selecting the projecting part, the performance, like frame rate, bit depth, and resolution, should be carefully considered because the specific requirements for experimental research and engineering application are different. Considering varying tissue properties at different wavelengths (e.g., 470, 525, 590, 625, 658, 690, 730, 850, and 970 nm), a wavelength dispersion device, such as liquid crystal tunable filter (LCTF) and band-pass filter, is used for selecting required wavelengths in the case of broadband quartz halogen tungsten lamp. Discrete light source (e.g., LED with single wavelength) is another choice to have the predetermined wavelength based on preliminary experiments. An imaging device (e.g., high-performance camera), coupled with a prime lens, is used to acquire the remitted light intensity images under structured illuminations with different frequencies and phases. Performance of the imaging device needs to be higher than that of the projector. For example, if the frame rate of the projector is 30 fps, the frame rate of the imaging device is better at 60 fps, so that the change of the projection can be collected. It was reported that it took about 10 min to acquire three-phase-images for 30 frequencies at four different wavelengths (a total of 360 images), with a field-of-view about 5 × 5 cm [4]. A computer is connected with the projector and imaging device to control output of the lighting patterns (i.e., frequency and phase), and acquire and preserve the remitted images at different wavelengths. It should be noted that the pattern projection and image acquisition should be triggered simultaneously. A pair of linear polarizers is put in the projection and imaging parts to reduce and even eliminate specular reflection from the sample surface. Target samples are placed on the sampling stage, which has an adjustable height, allowing a consistent distance between the sample surface and imaging device. It is desirable to have the sampling part move along the horizontal axis, so that the SFDI system can be applied to the real-time applications. Note that most of the SFDI systems used in the published literature are constructed by the researchers, and the SFDI device manufactured and produced by the Modulim Incorporation for research purposes, called Clarifi® (https://modulim.com/, accessed on 23 March 2021), has also been used in some studies [5][6][7][8].
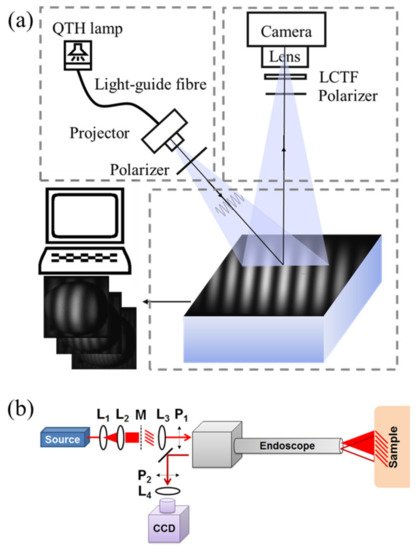
Figure 1. (a) Schematics of a typical SFDI system. QTH and LCTF denote quartz tungsten halogen and liquid crystal tunable filter, respectively. (b) Schematic of an endoscopic imaging system: a laser source is expanded and collimated by lenses L1 and L2, passes through a mask of a sinusoid printed onto a transparency and is collimated by L3 into the projection channel of the endoscope. The polarizers P1 and P2 ensure specular light removal. The collection channel of the endoscope sends light through L4 where it is imaged onto a CCD camera (adapted from Ref. [9]).
Figure 1b depicts the optical design of an endoscopic imaging system [9]. The fundamentals of imaging in the spatial-frequency domain are preserved, starting with a light source. Given a source with a fiber output, lenses L1 and L2 are used to expand and collimate the beam onto a mask M of a sinusoidal pattern. The image of the illuminated pattern is then collimated by L3 and polarized by linear polarizer P1 as it is sent through the projection channel of the endoscope and onto the sample. The reflected light is imaged through the collection channel of the endoscope. The collimated output is cross-polarized with respect to P1 by linear polarizer P2 and then imaged by objective lens L4 onto the CCD. This design combines the endoscope with SFDI, which makes it possible to measure optical properties of endoscope in real-time with a large field-of-view.
2. Applications
Dognitz et al. [10] first investigated the potential of spatially modulated area lighting by employing a xenon lamp with a band-pass filter to illuminate a patterned glass plate and generate a circular modulation pattern. A CCD camera was used for capturing the reflected image of the sample at three different modulated frequencies (i.e., 0.10, 0.16, and 0.50 mm−1). The results indicated that SFDI was capable of measuring the absorption and reduced scattering coefficients noninvasively. However, the value of their work was not recognized by the scientific community at that time. Thanks to the rapid advances in digital technology and computing technology, great progress has been made in the development of spatially resolved and time-domain techniques for measuring optical properties of biological tissues, which, in turn, can be routinely used for chemical composition prediction and functional analysis [11]. Therefore, the researchers began to renew their interest in spatial-frequency domain imaging after the arrival of the twenty-first century. In 2005, Cuccia et al. applied the SFDI technique for the measurement and analysis of wide-field mapping of tissue optical properties [12]. They used a modulation pattern with the frequency of 0–0.6 mm−1 at 640 nm, demonstrating that SFDI was a fast and inexpensive method for tomographic imaging and quantitative optical property mapping in a wide field-of-view. The conceptual framework, hardware composition, and software algorithm proposed in their study have been widely used for optical property estimation by other researchers. The estimated optical properties can be used in the field of biomedical optics for inspecting breast tumors and non-melanoma tumor lesions, as well as in the food and agricultural domain for apple internal browning and early bruise detection. The following sections present more details regarding the practical applications of SFDI.
2.1. Burn Assessment
Burn is a common affliction which usually causes damage to the skin, mucous membrane, subcutaneous and submucosal tissues, and even some complications. Accurate detection of burn location and severity is critical for determining the scheme for the treatment and recovery. Thanks to the advantages of SFDI for depth-varying characterizing of biological tissues, it has been applied for surface and subsurface burn detection.
The potential of SFDI for burn assessment was first explored in a rat model, with a graded control scheme for detecting burn severity [13]. The results showed that SFDI technique was capable of quantitatively and noninvasively assessing the burn wound severity, which could assist clinicians to better identify burn areas. Due to the small skin area of rats, it is difficult to realize the artificial controllable burn models; thus, the pig has appeared as a new model for burn assessment [14][15][16]. Mazhar et al. measured 48 cases of severe heat burns in a pig model, and monitored functional and structural parameters of each burn type for more than 72 h [7]. Ponticorvo et al. and Burmeister et al. imaged wounds on the back of pigs with different burn degrees and calculated the absorption coefficient based on Monte Carlo simulation [17]. It was proven that SFDI could reflect the changes of skin parameters after the burns. Ponticorvo et al. shifted their focus to burn care in an attempt to help quantify not only burn depth but also the progress of healing [18]. They showed that SFDI coupled with laser speckle imaging was capable of monitoring changes in hemodynamic and scattering properties in burn wounds over a 28-day period. These results highlighted the potential insights that can be gained by using SFDI to study wound healing.
Relative changes in oxygenated hemoglobin concentration (HbO2), deoxygenated hemoglobin concentration (Hb), total hemoglobin concentration (HbT), and blood oxygen saturation (StO2) could be used to present the skin condition. StO2 was more frequently used as an index of burn assessment due to its ability in revealing vascular damage and patency. Figure 2 shows typical results of burn assessment for porcine dorsal skin with three levels (i.e., superficial partial, deep partial, and full). It was found that the reduced scattering coefficients of porcine dorsal skin with burns were smaller than those without burns, indicating that the reduced scattering coefficient mappings estimated by the SFDI were capable of burn detection.
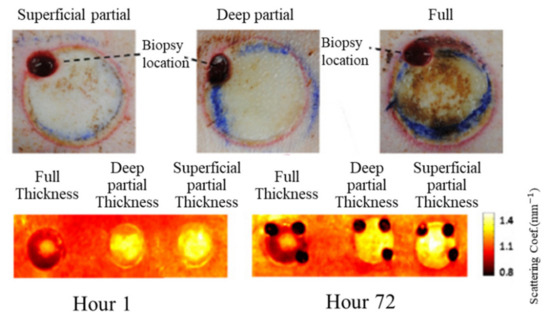
Figure 2. Typical results for burn assessment of porcine dorsal skin in three levels (i.e., superficial partial, deep partial, and full). The top row is for color digital images, and the bottom row is for maps of the reduced scattering coefficients (adapted from Ref. [17]).
A large number of animal experiments on burn assessment have achieved acceptable results, which gives researchers full confidence in the feasibility of applying the SFDI to human beings for burn assessment. Recently, Poon et al. evaluated the burn severity of human tissues using SFDI [19]. The thermal burn treatment of skin obtained during plastic surgery was used as experimental material. Monte Carlo simulation was adopted to replace the DAE for inversely estimating optical properties. Experimental results showed that SFDI could be used for early evaluation of burns in human beings.
2.2. Skin Tissue Evaluation
Body skin tissue contains melanin, oxyhemoglobin, deoxyhemoglobin, and many other physicochemical constituents. Among them, melanin content and oxygen saturation can reflect the skin health status and provide much valuable information in detecting skin diseases, such as port wine stain (PWS), actinic keratosis (AK), and pressure ulcers. SFDI is advantageous in measuring these indices by extracting and mapping tissue optical properties, which can be used to evaluate the skin tissue.
Cuccia et al. first employed modulated lighting to measure the optical properties of forearm skin tissue, and the extracted optical properties can help detect the accumulation and dissipation of blood volume for the human skin tissue [20]. After that, Chen et al. extended the application of SFDI in skin tissue evaluation by decoupling the absorption of melanin from that of hemoglobin successfully [21]. The measured absorption coefficients were used to predict hemoglobin concentration and oxygen saturation of the skin.
On this basis, Mazhar et al. applied SFDI for recording the biochemical changes of PWS after laser treatment [22]. It was proven that SFDI could present biochemical components of wide-field tissues after laser treatment of PWS lesions. Similarly, the SFDI technique was also employed by Saager et al. for imaging skin cancer lesions [23]. The results demonstrated that SFDI is a new modality which can provide parameter information for photodynamic therapy (PDT), so as to provide more quantitative and controllable dosimetry for lesions.
Furthermore, SFDI has been applied for evaluating other skin diseases, such as AK and pressure ulcers. Travers et al. measured the changes of optical properties and vascular parameters of skin tissue suffering from mild light damage to AK by SFDI [24]. The results showed that SFDI could provide quantitative maps of optical and vascular parameters of precancerous lesions like human actinic keratosis, and also feedback on the process of precancerous lesions transforming into malignant lesions. Figure 3 shows absorption and histogram imaging maps for three patients at 590 nm. It was observed that the value of absorption coefficient of the patient suffering from AK (P3 in Figure 3) was larger than the patient without AK (P1, P2 in Figure 3), which was an early biomarker for evaluating AK. In addition, Yafi et al. used SFDI for detecting pressure ulcers, indicating that SFDI has the potential for risk stratification and healing of pressure ulcers [25]. Recently, Gevaux et al. investigated the potential of combining hyperspectral imaging with SFDI to estimate mappings of absorption and scattering properties of human face skin independently from irradiance drifts [26]. This study showed the feasibility of this method, but additional measurements on calibrated samples are required to fully identify its limitations and sensitivity to errors. Combining SFDI with other optical techniques, such as diffuse reflectance spectroscopy, for imaging a human prostate, demonstrated the ability for distinguishing prostatic tissue (anterior stroma, hyperplasia, and peripheral zone) from extra-prostatic tissue (urethra, ejaculatory ducts, and peri-prostatic tissue) [27].
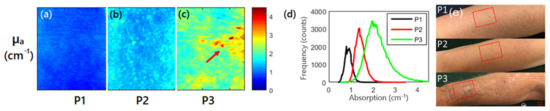
Figure 3. (a–c) are absorption maps for three patients at 590 nm, and the red arrow highlights the visible lesion for P3; (d) is histogram of the absorption coefficient for the three patients at 590 nm; P1, P2 (without actinic keratosis), and P3 (with actinic keratosis) in (e) are three patients expressing various levels of photodamage, corresponding to (a–c), respectively (adapted from Ref. [24]).
2.3. Tumor Tissue Detection
Accurate measurement of tumor size and edge is critical for removing the tumor in clinical surgery. Due to the differences of optical properties between tumor tissue and normal tissue, SFDI provides potential for detecting tumor tissue. Diverse tumor tissues, such as non-melanoma tissues, breast cancer tissues, and skin cancer tissues, have been successfully detected by using the SFDI. Researchers decoupled the absorption of melanin and hemoglobin from scattering, measured the hemoglobin concentration and oxygen saturation of the skin, as well as estimated the scattering characteristics of the skin in real time.
Rohrbach et al. demonstrated that combination of SFDI with ultrasound imaging was capable of inspecting non-melanoma skin cancer, and SFDI could characterize non-melanoma skin cancer phototherapy independently [28][29]. They concluded that SFDI could monitor the changes of optical and vascular parameters in real time, thus providing references for clinical surgery. Human ovarian tissues, cervical cancer and bladder tumor tissues were also researched by the biomedical engineers using the SFDI [30][31][32]. It was reported that the information derived from SFDI could provide significant contrast and differentiation between microstructure parameters of different tissue types and disease states, thus enabling tumor detection in these tissues.
SFDI was also used in breast cancer detection. Laughney et al. conducted studies on detecting breast tissue excised during surgery using the SFDI technique [4][33]. The results showed that SFDI could maintain the sensitivity to local scattering contrast in a wide range, which indicated that SFDI is suitable for the edge assessment of breast surgery. Figure 4 shows representative spectral parameter maps for tissue subtypes (i.e., normal, fibroadenoma, ductal carcinoma in situ (DCIS), invasive cancer, and partially treated invasive cancer after neoadjuvant chemotherapy). The extracted parameter maps, such as histology, scattering amplitude, scattering slope, hemoglobin, oxygen, and water maps, were valuable for tumor detection. Furthermore, the detection of breast tumor tissue by SFDI was not limited to the samples excised during surgery, and it was also used in breast tumor in vivo detection. For example, Nguyen et al. applied SFDI to breast reconstruction with perforator flaps [34]. The results suggested that SFDI could provide intraoperative oxygenation images in real time during surgery. With the use of this technique, surgeons can obtain tissue oxygenation and hemoglobin concentration mappings to assist in intraoperative planning. In order to explore the ability of SFDI in detecting different breast tumor tissues, McClatchy et al. studied both freshly homogeneous and heterogeneous resected samples of human breast tissue [35]. The results demonstrated that SFDI provided mappings of microscopic structural biomarkers that cannot be obtained with diffuse imaging (e.g., hyperspectral imaging), as well as characterized spatial variations not resolved by point-based optical sampling (e.g., spatially resolved). In order to further study the imaging ability of SFDI on tumor tissue detection, McClatchy et al., Robbins et al., and Wei et al. conducted SFDI research on different breast tumor tissue samples, and the results confirmed that SFDI could provide a wide-field mapping of scattering parameters for microscopic evaluation and distinguish different breast tissue morphology [36][37][38].
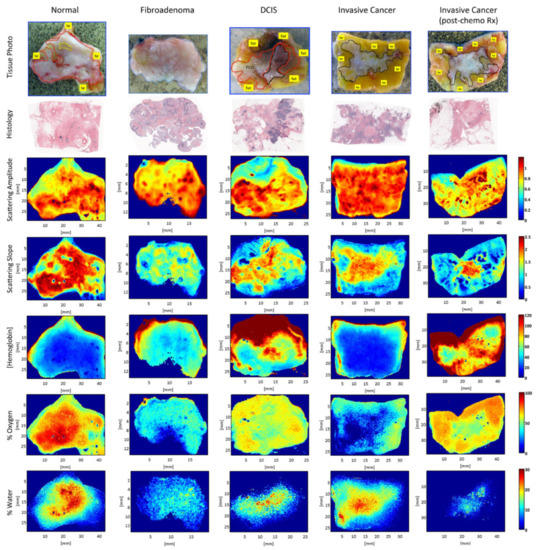
Figure 4. Representative spectral parameter maps for tissue subtypes. Spectral parameter maps correspond to the pathology subtypes: normal (including fibrocystic disease) (red outline), fibroadenoma (blue outline), DCIS, invasive cancer and partially treated invasive cancer after neoadjuvant chemotherapy (all black outline), and fat (yellow outline or label). Row 1 is the tissue photograph of the cut face of one slice of the specimen with the lesion; row 2 is the corresponding histology; row 3 is the scattering-amplitude maps; row 4 is the scattering slope maps; row 5 is the hemoglobin concentration maps; row 6 is the percentage oxygenated hemoglobin maps; and row 7 is the percentage water maps (adapted from Ref. [33]).
Great efforts have been made to combine the SFDI with other mature techniques to detect tumor on small animals. For instance, Zhao et al. [39] applied the correction of modified sensor to SFDI and conducted a longitudinal drug response study on subcutaneous tumor models of small animals. They suggested that SFDI could transform optical biomarkers of therapeutic response and drug resistance into imaging in vivo. Nandy et al. combined SFDI with rigid endoscopy for imaging a tumor model of a living mouse, which expanded the universality of SFDI application [40]. In the study of Burns et al., mouse tumor models were imaged by SFDI for tumor visualization [41]. They demonstrated that nanovesicles derived from erythrocytes and doped with an NIR chromophore (indocyanine green) could be used in conjunction with SFDI to visualize simulated tumors with different depths and concentration of NIR erythrocyte mimicking transducers within tissue mimicking objects. Moreover, Tabassu et al. employed SFDI for detecting tumor tissue in mice, and a two-layered look-up table model was proposed to improve the identification ability [42]. The two-layered look-up table model was shown to substantially improve the ability of SFDI in the extraction of bottom (tumor) layer’s optical properties, which revealed larger treatment changes in the tumor’s optical properties and a more hypoxic tumor environment.
2.4. Brain Tissue Monitoring
Brain is the main part of the central nervous system and main regulator of vital function. Quantitative measurements of absorption and reduced scattering coefficients of brain tissue can help to describe changes in brain function.
In 2011, Lin et al. used SFDI to conduct optical imaging of brain tissue in mice with Alzheimer’s disease (AD) [43]. The results showed that SFDI could measure quantitative absorption and reduced scattering coefficients of AD model, which can be used to investigate the structural and physiological changes of AD nerve tissue. In a follow-up experimental study, they focused on 3-month-old male CaM/Tet-DTA mice harboring transgenes for the doxycyline-regulated neuronal expression of diphtheria toxin [44]. When doxycycline was removed from the diet, CaM/Tet-DTA mice developed progressive neuronal loss in forebrain neurons. The results demonstrated that neuronal death and brain inflammation were associated with increased values of μs'
and this optical biomarker may be useful in pre-clinical AD therapy evaluation or monitoring of disease progression in AD patients. Singh-Moon et al. employed SFDI for evaluating the transport of cationic lipids in the arteries of rats with transient cerebral hypoperfusion to brain tissue, which was the first study to use SFDI for measuring drug uptake in postmortem tissue samples [45]. In the study, they obtained a spatial mapping of drug or tracer deposition for further generation of a dataset. Wilson et al. imaged the brain tissue of mice using square wave image and verified that multispectral SFDI (i.e., 655, 730, and 850 nm) could detect oxygen extraction in the brain as the brain resumed metabolism and electrical activity [46]. Their work enabled concurrent characterization of dynamic changes in tissue hemoglobin concentration, oxygenation, and scattering in an animal model of cardiac arrest and resuscitation. Sibai et al. indicated that implementing SFDI with a fluorescent-light transport model enabled recovery of 2-D images of PpIX, alleviating the need for time-consuming point sampling of the brain surface [47]. Despite the moderate errors in retrieving the absorption and reduced scattering coefficients in the sub-diffusive regime with the values of 14% and 19%, respectively, the recovered PpIX maps were within 10% of the point PpIX values measured by the fiber-optic probe, validating its potential as an extension or an alternative to point sampling during glioma resection. Recently, a method based on SFDI platform and different back-processing algorithms for measuring the refractive index (RI) of mouse brain tissue in the NIR spectral range was proposed by Abookasis et al. [48]. The changes in RI reflected the pathophysiology of the brain during heat stress and presented an additional advantage of SFDI for characterizing brain function. Figure 5 shows a series of 2-D false-color spatial maps of the RI at different wavelengths for two extreme temperatures of 28 °C and 43 °C, indicating that change in temperature leads to localized changes in RI within the brain surface and SFDI was capable of describing the characteristics and functions of the brain tissue.
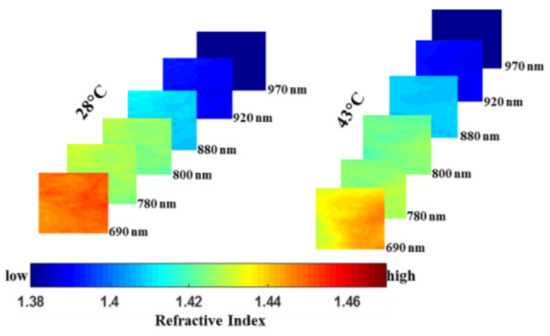
Figure 5. A series of 2-D false-color spatial maps of the refractive index (RI) at different wavelengths for two extreme temperatures of 28 °C and 43 °C (adapted from Ref. [48]).
2.5. Quality Evaluation of Agro-Products
In the field of food and agricultural engineering, SFDI is also involved in the quality evaluation of agricultural products. As early as 2007, Anderson et al. measured the optical properties of normal and damaged apple tissues using the SFDI technique [49]. The results showed that the reduced scattering coefficient of damaged apple tissues was larger than those of normal tissues, demonstrating that SFDI can differentiate the damaged apple from normal fruit. This is the first exploration and application of SFDI in the field of agricultural engineering. However, there was no research reported in the next few years. Until the year 2015, when the researchers in the food and agricultural engineering domain turned their attention back to the SFDI technique for optical property estimation. There are now two leading research groups working on the topic of SFDI technique in the field of agriculture. One is the Intelligent Bio-industrial Equipment Innovation Team (IBE) in Zhejiang University, which has established and developed the SFDI system for measuring optical properties of pear and apple fruit [50][51][52][53]. The measured optical properties are then used for quality evaluation, such as apple internal browning inspection and pear bruise detection. Recently, Hu et al. combined SFDI with frequency optimization to estimate the optical properties of two-layered tissues [54], indicating that the estimation accuracy of the absorption coefficient and reduced scattering coefficient of the second layer was 63.0% and 62.1% improvement, compared to that estimated with fixed frequency. These results are valuable for decoupling the effect of peel tissue of agro-products (e.g., apple, tomato, and peach) from flesh tissue on optical property estimation, as well as on quality assessment. The other group is the postharvest engineering laboratory at Michigan State University. A multispectral SFDI system was established and developed for optical property estimation and food quality evaluation, especially for early apple bruise and defect detection. Inverse algorithms for optical property estimation are optimized for accuracy improvement [49][55][56]. In addition, early apple bruise and surface imperfections are detected [57][58][59][60][61], and the 3-D structure of agro-products are reconstructed [62]. Overall, the study of SFDI in the food and agricultural engineering domain started relatively late and mainly focused on quality evaluation (e.g., early bruise, internal browning, chilling injury, etc.) of agro-products, including apple, pear, peach, tomato, and cucumber. The SFDI technique can be extended to measure optical properties of more agro-products in the future, which can be used to correlate with more quality attributes, such as firmness, soluble solids content, and defects.
References
- Wirth, D.; Sibai, M.; Olson, J.; Wilson, B.C.; Roberts, D.W.; Paulsen, K. Feasibility of using spatial frequency-domain imaging intraoperatively during tumor resection. J. Biomed. Opt. 2019, 24, 1–6.
- Nothelfer, S.; Bergmann, F.; Liemert, A.; Reitzle, D.; Kienle, A. Spatial frequency domain imaging using an analytical model for separation of surface and volume scattering. J. Biomed. Opt. 2019, 24, 1–10.
- Kennedy, G.T.; Stone, R.I.; Kowalczewski, A.C.; Rowland, R.; Chen, J.H.; Baldado, M.L.; Ponticorvo, A.; Bernal, N.; Christy, R.J.; Durkin, A.J. Spatial frequency domain imaging: A quantitative, noninvasive tool for in vivo monitoring of burn wound and skin graft healing. J. Biomed. Opt. 2019, 24, 1–9.
- Laughney, A.M.; Krishnaswamy, V.; Rice, T.B.; Cuccia, D.J.; Barth, R.J.; Tromberg, B.J.; Paulsen, K.D.; Pogue, B.W.; Wells, W.A. System analysis of spatial frequency domain imaging for quantitative mapping of surgically resected breast tissues. J. Biomed. Opt. 2013, 18, 036012–036022.
- Gioux, S.; Mazhar, A.; Lee, B.T.; Lin, S.J.; Tobias, A.M.; Cuccia, D.J.; Stockdale, A.; Oketokoun, R.; Ashitate, Y.; Kelly, E.; et al. First-in-human pilot study of a spatial frequency domain oxygenation imaging system. J. Biomed. Opt. 2011, 16, 086015.
- Balu, M.; Mazhar, A.; Hayakawa, C.K.; Mittal, R.; Krasieva, T.B.; Konig, K.; Venugopalan, V.; Tromberg, B.J. In vivo multiphoton NADH fluorescence reveals depth-dependent keratinocyte metabolism in human skin. Biophys. J. 2013, 104, 258–267.
- Mazhar, A.; Saggese, S.; Pollins, A.C.; Cardwell, N.L.; Nanney, L.; Cuccia, D.J. Noncontact imaging of burn depth and extent in a porcine model using spatial frequency domain imaging. J. Biomed. Opt. 2014, 19, 086019–086028.
- Gioux, S.; Mazhar, A.; Cuccia, D.J.; Durkin, A.J.; Tromberg, B.J.; Frangioni, J.V. Three-dimensional surface profile intensity correction for spatially modulated imaging. J. Biomed. Opt. 2009, 14, 034045–034055.
- Angelo, J.P.; van de Giessen, M.; Gioux, S. Real-time endoscopic optical properties imaging. Biomed. Opt. Express 2017, 8, 5113–5126.
- Dognitz, N.; Wagnieres, G. Determination of tissue optical properties by steady-state spatial frequency-domain reflectometry. Lasers Med. Sci. 1998, 13, 55–65.
- Lu, R.F. Light Scattering Technology for Food Property, Quality and Safety Assessment; CRC Press: Boca Raton, FL, USA, 2017.
- Cuccia, D.J.; Bevilacqua, F.; Durkin, A.J.; Tromberg, B.J. Modulated imaging: Quantitative analysis and tomography of turbid media in the spatial-frequency domain. Opt. Lett. 2005, 30, 1354–1359.
- Nguyen, T.T.A.; Ramella-Roman, J.C.; Moffatt, L.T.; Ortiz, R.T.; Jordan, M.H.; Shupp, J.W. Novel Application of a Spatial Frequency Domain Imaging System to Determine Signature Spectral Differences Between Infected and Noninfected Burn Wounds. J. Burn Care Res. 2013, 34, 44–50.
- Kennedy, G.T.; Stone, R.; Kowalczewski, A.C.; Chen, J.H.; Rowland, R.; Ponticorvo, A.; Christy, R.J.; Durkin, A.J. Characterization of debrided burn wounds using spatial frequency domain imaging. Photonics Dermatol. Plast. Surg. 2019, 108510.
- Ponticorvo, A.; Rowland, R.; Baldado, M.; Burmeister, D.M.; Christy, R.J.; Bernal, N.P.; Durkin, A.J. Evaluating clinical observation versus Spatial Frequency Domain Imaging (SFDI), Laser Speckle Imaging (LSI) and thermal imaging for the assessment of burn depth. Burns 2019, 45, 450–460.
- Rowland, R.; Ponticorvo, A.; Baldado, M.; Kennedy, G.T.; Burmeister, D.M.; Christy, R.J.; Bernal, N.P.; Durkin, A.J. A Simple Burn Wound Severity Assessment Classifier Based On Spatial Frequency Domain Imaging (SFDI) and Machine Learning. Photonics Dermatol. Plast. Surg. 2019, 1085109.
- Ponticorvo, A.; Burmeister, D.M.; Yang, B.; Choi, B.; Christy, R.J.; Durkin, A.J. Quantitative assessment of graded burn wounds in a porcine model using spatial frequency domain imaging (SFDI) and laser speckle imaging (LSI). Biomed. Opt. Express 2014, 5, 3467–3481.
- Ponticorvo, A.; Burmeister, D.M.; Rowland, R.; Baldado, M.; Kennedy, G.T.; Saager, R.; Bernal, N.; Choi, B.; Durkin, A.J. Quantitative long-term measurements of burns in a rat model using Spatial Frequency Domain Imaging (SFDI) and Laser Speckle Imaging (LSI). Laser. Surg. Med. 2017, 49, 293–304.
- Poon, C.; Sunar, U.; Rohrbach, D.J.; Krishnamurthy, S.; Olsen, T.; Kent, M.; Weir, N.M.; Simman, R.; Travers, J.B. Early assessment of burn severity in human tissue ex vivo with multi-wavelength spatial frequency domain imaging. Toxicol. Vitr. 2018, 52, 251–254.
- Cuccia, D.J.; Bevilacqua, F.; Durkin, A.J.; Ayers, F.R.; Tromberg, B.J. Quantitation and mapping of tissue optical properties using modulated imaging. J. Biomed. Opt. 2009, 14, 024012.
- Chen, X.; Lin, W.; Wang, C.; Chen, S.; Sheng, J.; Zeng, B.; Xu, M. In vivo real-time imaging of cutaneous hemoglobin concentration, oxygen saturation, scattering properties, melanin content, and epidermal thickness with visible spatially modulated light. Biomed. Opt. Express 2017, 8, 5468–5482.
- Mazhar, A.; Sharif, S.A.; Cuccia, J.D.; Nelson, J.S.; Kelly, K.M.; Durkin, A.J. Spatial frequency domain imaging of port wine stain biochemical composition in response to laser therapy: A pilot study. Laser. Surg. Med. 2012, 44, 611–621.
- Saager, R.B.; Dang, A.N.; Huang, S.S.; Kelly, K.M.; Durkin, A.J. Portable (handheld) clinical device for quantitative spectroscopy of skin, utilizing spatial frequency domain reflectance techniques. Rev. Sci. Instrum. 2017, 88, 094302.
- Travers, J.B.; Poon, C.; Rohrbach, D.J.; Weir, N.M.; Cates, E.; Hager, F.; Sunar, U. Noninvasive mesoscopic imaging of actinic skin damage using spatial frequency domain imaging. Biomed. Opt. Express 2017, 8, 3045–3052.
- Yafi, A.; Muakkassa, F.K.; Pasupneti, T.; Fulton, J.; Cuccia, D.J.; Mazhar, A.; Blasiole, K.N.; Mostow, E.N. Quantitative Skin Assessment Using Spatial Frequency Domain Imaging (SFDI) in Patients With or at High Risk for Pressure Ulcers. Lasers Surg. Med. 2017, 49, 827–834.
- Gevaux, L.; Cherel, M.; Seroul, P.; Clerc, R.; Tremeau, A.; Hebert, M. Hyperspectral imaging and spatial frequency domain imaging: Combined acquisition for full face skin analysis. Imaging Manip. Anal. Biomol. Cells Tissues Xvii 2019, 10881.
- Burmeister, D.M.; Ponticorvo, A.; Yang, B.; Becerra, S.C.; Choi, B.; Durkin, A.J.; Christy, R.J. Utility of spatial frequency domain imaging (SFDI) and laser speckle imaging (LSI) to non-invasively diagnose burn depth in a porcine model. Burns 2015, 41, 1242–1252.
- Rohrbach, D.J.; Muffoletto, D.; Huihui, J.; Saager, R.; Keymel, K.; Paquette, A.; Morgan, J.; Zeitouni, N.; Sunar, U. Preoperative Mapping of Nonmelanoma Skin Cancer Using Spatial Frequency Domain and Ultrasound Imaging. Acad. Radiol. 2014, 21, 263–270.
- Rohrbach, D.J.; Zeitouni, N.C.; Muffoletto, D.; Saager, R.; Tromberg, B.J.; Sunar, U. Characterization of nonmelanoma skin cancer for light therapy using spatial frequency domain imaging. Biomed. Opt. Express 2015, 6, 1761–1766.
- Nandy, S.; Mostafa, A.; Kumavor, P.D.; Sanders, M.; Brewer, M.; Zhu, Q. Characterizing optical properties and spatial heterogeneity of human ovarian tissue using spatial frequency domain imaging. J. Biomed. Opt. 2016, 21, 101402.
- Lin, W.H.; Zeng, B.X.; Cao, Z.L.; Chen, X.L.; Yang, K.Y.; Xu, M. Quantitative diagnosis of tissue microstructure with wide-field high spatial frequency domain imaging. Biomed. Opt. Express 2018, 9, 2905–2916.
- Lin, W.H.; Zeng, B.X.; Cao, Z.L.; Zhu, D.F.; Xu, M. Wide-field high spatial frequency domain imaging of tissue microstructure. Prog. Biomed. Opt. Imaging Proc. SPIE 2018, 10484.
- Laughney, A.M.; Krishnaswamy, V.; Rizzo, E.J.; Schwab, M.C.; Barth, R.J.; Cuccia, D.J.; Tromberg, B.J.; Paulsen, K.D.; Pogue, B.W.; Wells, W.A. Spectral discrimination of breast pathologies in situ using spatial frequency domain imaging. Breast Cancer Res. 2013, 15, R61.
- Nguyen, J.T.; Lin, S.J.; Tobias, A.M.; Gioux, S.; Mazhar, A.; Cuccia, D.J.; Ashitate, Y.; Stockdale, A.; Oketokoun, R.; Durr, N.J.; et al. A Novel Pilot Study Using Spatial Frequency Domain Imaging to Assess Oxygenation of Perforator Flaps During Reconstructive Breast Surgery. Ann. Plast. Surg. 2013, 71, 308–315.
- McClatchy, D.M.; Rizzo, E.J.; Wells, W.A.; Cheney, P.P.; Hwang, J.C.; Paulsen, K.D.; Pogue, B.W.; Kanick, S.C. Wide-field quantitative imaging of tissue microstructure using sub-diffuse spatial frequency domain imaging. Optica 2016, 3, 613–621.
- McClatchy, D.M.; Rizzo, E.; Krishnaswamy, V.; Kanick, S.; Wells, W.; Paulsen, K.; Pogue, B. Combined multispectral spatial frequency domain imaging and computed tomography system for intraoperative breast tumor margin assessment. Prog. Biomed. Opt. Imaging Proc. SPIE 2017, 10057.
- Robbins, C.M.; Antaki, J.F.; Kainerstorfer, J.M. Spatial frequency domain imaging for monitoring palpable breast lesions. Prog. Biomed. Opt. Imaging Proc. SPIE 2017, 10059.
- Wei, R.L.; Leproux, A.; Laoui, S.; Kuo, J.V.; Daroui, P.; Farol, H.Y.; Ramsinghani, N.S.; Al-Ghazi, M.; Durkin, A.J.; Tromberg, B. Temporal and Spatial Quantification of Tissue Oxygen Saturation and Melanin Deposition During Whole Breast Radiation Using Noninvasive Spatial Frequency Domain Imaging. Int. J. Radiat. Oncol. 2017, 99, E54–E55.
- Zhao, Y.; Tabassum, S.; Piracha, S.; Nandhu, M.S.; Viapiano, M.; Roblyer, D. Angle correction for small animal tumor imaging with spatial frequency domain imaging (SFDI). Biomed. Opt. Express 2016, 7, 2373–2384.
- Nandy, S.; Erfanzadeh, M.; Zhou, F.F.; Zhu, Q. Feasibility study of spatial frequency domain imaging using a handheld miniaturized projector and rigid endoscope. Prog. Biomed. Opt. Imaging Proc. SPIE 2017, 10059.
- Burns, J.M.; Schaefer, E.; Anvari, B. Near Infrared Spatial Frequency Domain Fluorescence Imaging of Tumor Phantoms Containing Erythrocyte-Derived Optical Nanoplatforms. Prog. Biomed. Opt. Imaging Proc. SPIE 2018, 105060.
- Tabassu, S.; Pera, V.; Greening, G.; Muldoon, T.J.; Roblyer, D. Two-layer inverse model for improved longitudinal preclinical tumor imaging in the spatial frequency domain. J. Biomed. Opt. 2018, 23, 076011.
- Lin, A.J.; Koike, M.A.; Green, K.N.; Kim, J.G.; Mazhar, A.; Rice, T.B.; LaFerla, F.M.; Tromberg, B.J. Spatial Frequency Domain Imaging of Intrinsic Optical Property Contrast in a Mouse Model of Alzheimer’s Disease. Ann. Biomed. Eng. 2011, 39, 1349–1357.
- Lin, A.J.; Castello, N.A.; Lee, G.; Green, K.N.; Durkin, A.J.; Choi, B.; LaFerla, F.; Tromberg, B.J. In vivo optical signatures of neuronal death in a mouse model of Alzheimer’s disease. Lasers Surg. Med. 2014, 46, 27–33.
- Singh-Moon, R.P.; Roblyer, D.M.; Bigio, I.J.; Joshi, S. Spatial mapping of drug delivery to brain tissue using hyperspectral spatial frequency-domain imaging. J. Biomed. Opt. 2014, 19, 096003.
- Wilson, R.H.; Crouzet, C.; Torabzadeh, M.; Bazrafkan, A.; Farahabadi, M.H.; Jamasian, B.; Donga, D.; Alcocer, J.; Zaher, S.M.; Choi, B.; et al. High-speed spatial frequency domain imaging of rat cortex detects dynamic optical and physiological properties following cardiac arrest and resuscitation. Neurophotonics 2017, 4, 045008.
- Sibai, M.; Fisher, C.; Veilleux, I.; Elliott, J.T.; Leblond, F.; Roberts, D.W.; Wilson, B.C. Preclinical evaluation of spatial frequency domain-enabled wide-field quantitative imaging for enhanced glioma resection. J. Biomed. Opt. 2017, 22, 76007.
- Abookasis, D.; Meitav, O. Assessing mouse brain tissue refractive index in the NIR spectral range utilizing spatial frequency domain imaging technique combined with processing algorithms. Clin. Transl. Neurophotonics 2019, 10864.
- Anderson, E.R.; Cuccia, D.J.; Durkin, A.J. Detection of bruises on golden delicious apples using spatial- frequency-domain imaging. Proc. SPIE Int. Soc. Opt. Eng. 2007, 36, 6430.
- Li, T.W.; He, X.M.; Fu, X.P.; Rao, X.Q. LabVIEW Base Software for Spatial Frequency Domain Imaging System. In Proceedings of the 2017 ASABE Annual International Meeting, Spokane, WA, USA, 16 July 2017.
- Hu, D.; Fu, X.P.; He, X.M.; Ying, Y.B. Noncontact and Wide-Field Characterization of the Absorption and Scattering Properties of Apple Fruit Using Spatial-Frequency Domain Imaging. Sci. Rep. 2016, 6, 37920–37930.
- He, X.M.; Fu, X.P.; Rao, X.Q.; Fu, F. Nondestructive determination of optical properties of a pear using spatial frequency domain imaging combined with phase-measuring profilometry. Appl. Opt. 2017, 56, 8207–8215.
- He, X.M.; Fu, X.P.; Li, T.W.; Rao, X.Q. Spatial frequency domain imaging for detecting bruises of pears. J. Food Meas. Charact. 2018, 12, 1266–1273.
- Hu, D.; Lu, R.F.; Ying, Y.B. Spatial-frequency domain imaging coupled with frequency optimization for estimating optical properties of two-layered food and agricultural products. J. Food. Eng. 2020, 277, 109909–109913.
- Hu, D.; Lu, R.F.; Ying, Y.B. Optimization of Spatial Frequency Domain Imaging Technique for Estimating Optical Properties of Food and Biological Materials. In Proceedings of the 2017 ASABE Annual International Meeting, Spokane, WA, USA, 16 July 2017.
- Hu, D.; Lu, R.F.; Ying, Y.B. A two-step parameter optimization algorithm for improving estimation of optical properties using spatial frequency domain imaging. J. Quant. Spectrosc. Radiat. Transf. 2018, 207, 32–40.
- Lu, Y.Z.; Li, R.; Lu, R.F. Gram–Schmidt orthonormalization for retrieval of amplitude images under sinusoidal patterns of illumination. Appl. Opt. 2016, 55, 6866–6873.
- Lu, Y.Z.; Li, R.; Lu, R.F. Fast demodulation of pattern images by spiral phase transform in structured-illumination reflectance imaging for detection of bruises in apples. Comput. Electron. Agric. 2016, 127, 652–658.
- Lu, Y.Z.; Lu, R.F. Development of a Multispectral Structured Illumination Reflectance Imaging (SIRI) System and Its Application to Bruise Detection of Apples. Trans. ASABE 2017, 60, 1379–1389.
- Lu, Y.Z.; Lu, R.F. Histogram-based automatic thresholding for bruise detection of apples by structured-illumination reflectance imaging. Biosyst. Eng. 2017, 160, 30–41.
- Lu, Y.Z.; Huang, Y.P.; Lu, R.F. Innovative Hyperspectral Imaging-Based Techniques for Quality Evaluation of Fruits and Vegetables: A Review. Appl. Sci. 2017, 7, 189.
- Lu, Y.Z.; Lu, R.F. Using composite sinusoidal patterns in structured-illumination reflectance imaging (SIRI) for enhanced detection of apple bruise. J. Food Eng. 2017, 199, 54–64.


