 +1 credit
| Version | Summary | Created by | Modification | Content Size | Created at | Operation |
|---|---|---|---|---|---|---|
| 1 | Fedor Subach | + 9023 word(s) | 9023 | 2020-03-17 08:14:28 | | | |
| 2 | Rita Xu | + 8114 word(s) | 8114 | 2020-03-17 09:59:13 | | | | |
| 3 | Rita Xu | -205 word(s) | 7909 | 2020-10-26 04:45:18 | | |
Video Upload Options
Green fluorescent genetically encoded calcium indicators (GECIs) are the most popular tool for visualization of calcium dynamics in vivo. However, most of them are based on the EGFP protein and have similar molecular brightnesses. The NTnC indicator, which is composed of the mNeonGreen fluorescent protein with the insertion of troponin C, has higher brightness as compared to EGFP-based GECIs, but shows a limited inverted response with an ΔF/F of 1.
By insertion of a calmodulin/M13-peptide pair into the mNeonGreen protein, we developed a green GECI called NCaMP7. In vitro, NCaMP7 showed positive response with an ΔF/F of 27 and high affinity (Kd of 125 nM) to calcium ions. NCaMP7 demonstrated a 1.7-fold higher brightness and similar calcium-association/dissociation dynamics compared to the standard GCaMP6s GECI in vitro.
According to fluorescence recovery after photobleaching (FRAP) experiments, the NCaMP7 design partially prevented interactions of NCaMP7 with the intracellular environment. The NCaMP7 crystal structure was obtained at 1.75Å resolution to uncover the molecular basis of its calcium ions sensitivity.
The NCaMP7 indicator retained a high and fast response when expressed in cultured HeLa and neuronal cells. Finally, we successfully utilized the NCaMP7 indicator for in vivo visualization of grating-evoked and place-dependent neuronal activity in the visual cortex and the hippocampus of mice using a two-photon microscope and an NVista miniscope, respectively.
1. Development of Bright Green Fluorescent Positive Calcium Indicators Based on the mNeonGreen Protein
To develop a bright green calcium indicator, we inserted a CaM/M13-peptide Ca2+-binding domain into the mNeonGreen fluorescent protein and performed several rounds of optimization using directed molecular evolution in a bacterial system [1]. We selected the mNeonGreen protein as the fluorescent moiety because of its high molecular brightness that was preserved in the NTnC calcium indicator [2]. As a Ca2+-binding motif, we used the CaM and M13-peptide excised from the GCaMP6s GECI and fused together via the flexible GGSGGGSSS linker in a similar way as in ncpGCaMP6s [3]. We started with the generation of two libraries with the insertion of the M13/CaM or CaM/M13 Ca2+-binding parts in a different order between residues 145 and 146 of the mNeonGreen protein in the same way as in the NTnC indicator (Figure 1) [2], and randomized both of the 3-amino-acid-long linkers between the fluorescent mNeonGreen and Ca2+-binding domains (Figure S1). These libraries were further analyzed using a two-step screening strategy, including screening on the bacterial colonies under a fluorescent stereomicroscope and in the solution in a 96-well plate format as described earlier [4]. As a result of screening, we found fluorescent variants with positive responses to calcium ions, demonstrating the maximal fluorescence contrasts of 1.3- and 2.1-fold for the M13/CaM- and CaM/M13-based libraries, respectively. The variant with the highest calcium sensitivity was chosen as a template for further optimization.
The chosen clone was subjected to ten sequential rounds of random mutagenesis, followed by screening. During each round, we screened approximately 20,000 colonies to identify variants with the largest response to the calcium ions and the highest brightness, following the previously described protocol [4]. After ten rounds of random mutagenesis and selection, we chose the four variants with the best performance in terms of fluorescence contrast and brightness, but with different affinity to calcium ions, and named them NCaMP4, NCaMP7, NCaMP9, and NCaMP10 (mNeonGreen-derived CaM/M13-Peptide-based calcium indicator). The NCaMP indicators had 25–26 mutations relative to the original template-library (Figure S1).
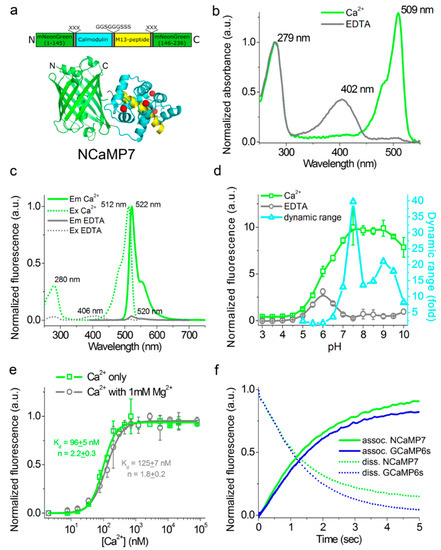
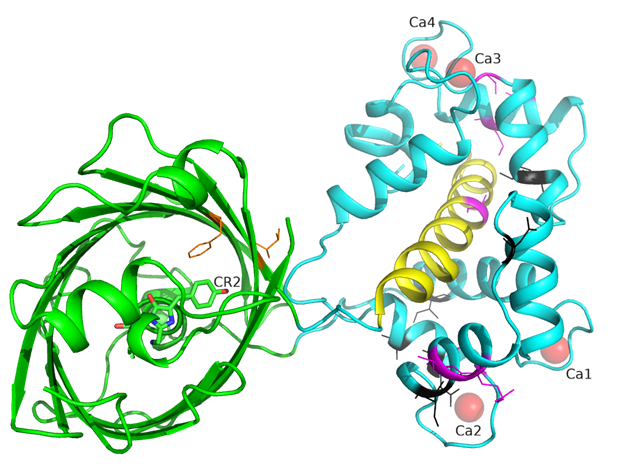
Figure 1. In vitro properties of the purified NCaMP7 indicator. (a) A scheme of the original library for optimization of linkers in the NCaMP7 indicator and a cartoon representation of its crystal structure (PDB ID—6XW2). (b) Absorbance spectra for NCaMP7 in Ca2+-bound (10 mM Ca2+) and Ca2+-free (10 mM EDTA) state at pH 7.2. (c) Excitation and emission spectra for NCaMP7 in Ca2+-bound (10 mM Ca2+) and Ca2+-free (10 mM EDTA) states, pH 7.2. (d) Fluorescence intensity for NCaMP7 in Ca2+-bound (10 µM Ca2+) and Ca2+-free (10 µM EDTA) states as a function of pH. Error bars represent the standard deviation. (e) Ca2+ titration curves for NCaMP7 in the absence and in the presence of 1 mM MgCl2, pH 7.2. Error bars represent the standard deviation. (f) Calcium-association and -dissociation kinetics for the NCaMP7 and control GCaMP6s indicators investigated using stopped-flow fluorimetry. Calcium-association and -dissociation kinetics curves were acquired at 300 nM final and at 1000 nM starting Ca2+-free concentrations, respectively. (d–f) Three replicates were averaged for analysis.
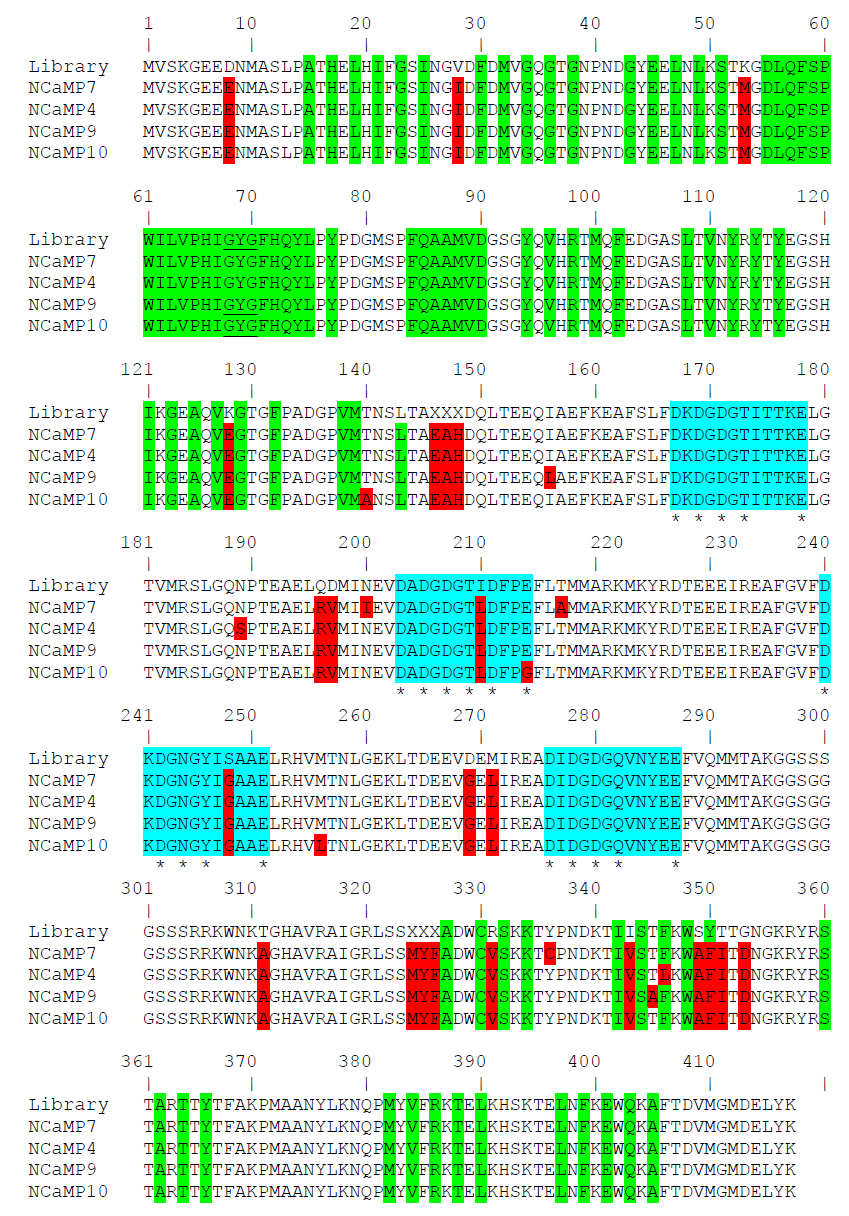
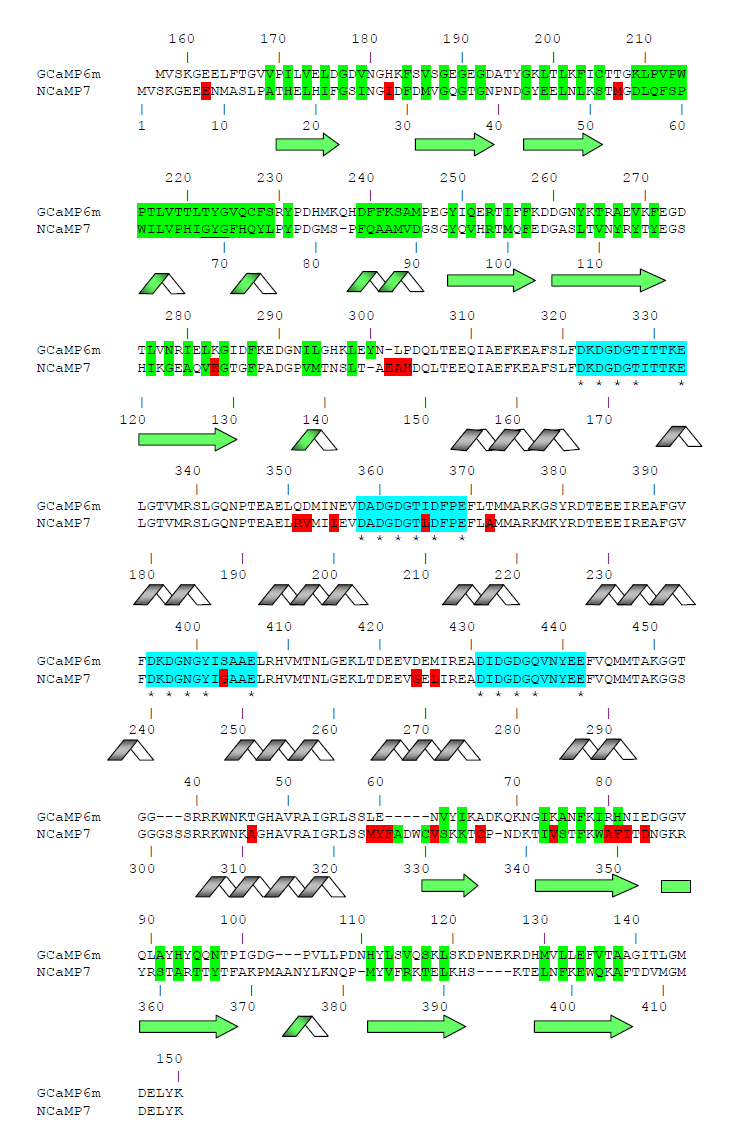
Figure S1. Alignment of the amino acid sequences for the original library and NCaMP calcium indicators. Alignment numbering follows that of NCaMPs. Residues from fluorescent part buried in β-can are highlighted with green. Residues that are forming chromophore are underlined. Mutations in NCaMPs related to the original library including linkers between fluorescent and calcium-binding parts are highlighted in red. Residues that are forming Ca2+-binding loops are highlighted in cyan. Calcium-coordinating residues are selected with asterisks.
2. Crystal Structure of the NCaMP7 Indicator in Its Calcium-Saturated State
The structural study of NCaMP7 was carried out to shed light on the molecular basis of the sensitivity of NCaMPs to calcium ions, to describe the impacts of mutations found during the engineering of the NCaMP indicators, and thus to help future research improve fluorescent sensors’ properties. We chose the NCaMP7 indicator for structural studies because it outperformed other NCaMPs in neuronal cultures and in in vivo experiments, as described below. We successfully crystallized the NCaMP7 indicator in the Ca2+-bound state and determined its spatial structure at 1.75 Å resolution.
There is one NCaMP7 molecule in the asymmetric unit, and contact analysis revealed that the protein has a monomeric state in the crystal. The overall structure of the NCaMP7 consists of two linked domains—the mNeonGreen fluorescent domain and the CaM/M13-peptide Ca2+-binding domain (Figures 1a and 2a). Both domains are clearly visible in the electron density map. The mNeonGreen domain has a typical β-barrel fold with the chromophore formed by 68GYG70 amino acids and positioned on the central helix of the barrel. The chromophore orientation is additionally fixed by hydrogen bonds (H-bonds) to P65, R98, Y114, and E401, and water-mediated H-bonds to Y225, Y366, R386, and T388 (Figure 2b). The phenolic group of the chromophore points to the β-barrel surface towards the Y225, C330, and W348 residues. The Ca2+-binding domain is tightly bound to the fluorescent domain via a network of H-bonds and salt bridges. The M13-peptide of the Ca2+-binding domain is folded into α-helix and disposed of in the central part of this domain. Comparison of NCaMP7 (protein data bank identifier, PDB ID—6XW2) and GCaMP6m (PDB ID—3WLD) [20] structures being superposed by their calcium-binding parts (root-mean-square deviation, RMSD—1.6 Å2) revealed a different mutual orientation of both domains, despite a canonical overall architecture of the molecules (Figure S2). This difference may be attributed to the different NTnC- and GCaMP-like types of design for the indicators that implies different contact interfaces between the fluorescent domain and the CaM/M13-peptide calcium-binding domain.
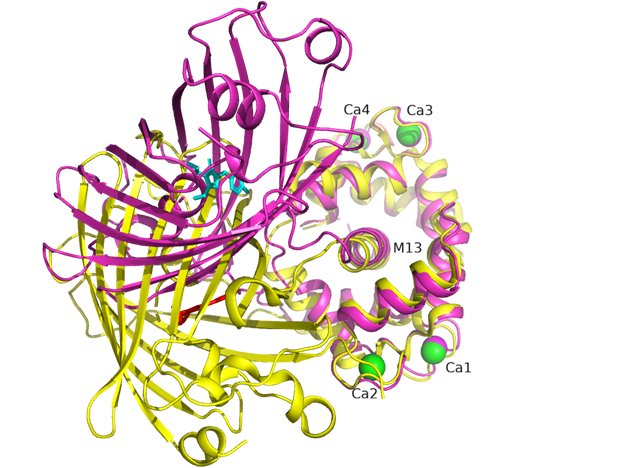
Figure S2. Superposition of NCaMP7 (PDB ID - 6XW2, in magenta) and GCaMP6m (PDB ID 3WLD, in yellow) structures. Chromophores for NCaMP7 and GCaMP6m are shown in cyan and red colors, respectively. Calcium ions for NCaMP7 and GCaMP6m are in magenta and green. M13 peptide is labeled as well as calcium ions. Structures are superposed by their calmodulin domains.
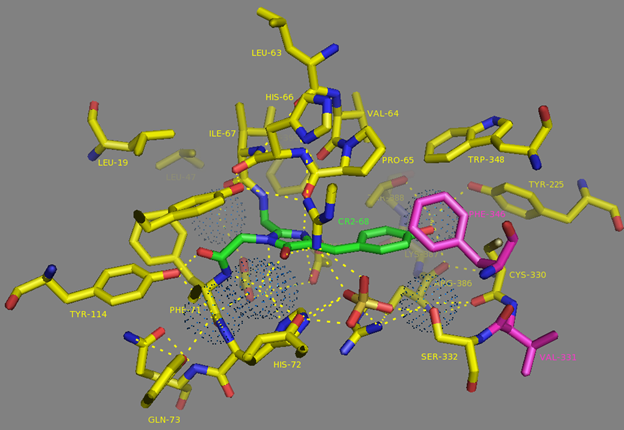
To understand the molecular bases of the Ca2+-dependent fluorescence changes for the NCaMP7 indicator, we first analyzed the direct contacts between the chromophore moiety and the Ca2+-binding domain. The deprotonated phenolic group of the chromophore forms three water-mediated H-bonds with the OH group of T388, the main chain C=O of R386, and the OH group of Y225 (Figure 2b). Notably, Y225 is located at the end of α4 in CaM and protrudes towards the surface “hole” of the NCaMP7 fluorescent part to stabilize the deprotonated phenolic group of the chromophore. Therefore, residues from both the fluorescent and Ca2+-binding domains stabilize the deprotonated state of the NCaMP7 chromophore. The deprotonated phenolic group of the chromophore in the parental mNeonGreen, in addition to two water-mediated H-bonds with R195 (corresponding to R386 in NCaMP7), forms also two water-mediated H-bonds with the main chain C=O of C139 and with the OH group of S141 (corresponding to C330 and S332 in NCaMP7) [5]. According to the GCaMP6m structure, two amino acid residues from α4 of CaM, R376, and Y380 (corresponding to the respective R221 and Y225 in NCaMP7; Figure S3), protrude towards the surface entrance of cpEGFP [6]. The former in GCaMP6m stabilizes the deprotonated phenolic group of the chromophore through a water-mediated H-bond; the corresponding R221 in NCaMP7 is located far away from the chromophore. The Y380 residue in GCaMP6m does not form an H-bond with the chromophore (like Y225 in NCaMP7), but provides a bulk phenolic group that blocks solvent access to the chromophore [6]. Hence, we speculate that Y225 in NCaMP7 (similar to Y380 in GCaMP6m [20]) plays a crucial role in the translation of the Ca2+-dependent conformational change in the CaM/M13-peptide domain to the chromophore’s environment, modulating indicator fluorescence.
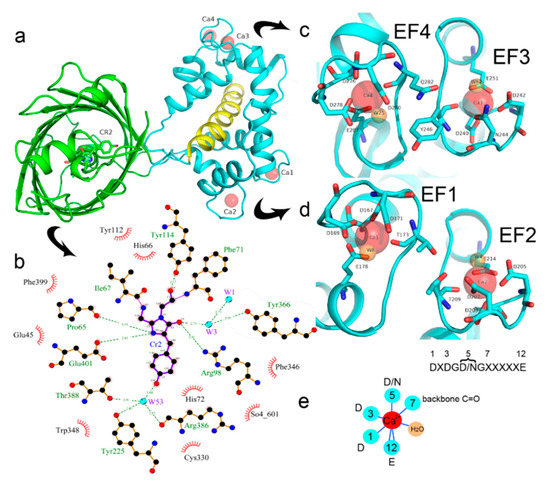
Figure 2. Overview of the crystal structure for the NCaMP7 indicator (PDB ID—6XW2). (a) Cartoon representation of NCaMP7 crystal structure (90 degrees rotated as compared to Figure 1a). The immediate surroundings of the chromophore (b) and calcium ions (c,d). (e) The coordination sphere of the calcium ion (in red) and positions for the calcium-coordinating residues in the sequence of EF1-4-hands loops (X means different residues observed in the same position among the four EF1-4-hands of NCaMP7). Hydrogen bonds and water molecule are shown as blue lines and orange circle, respectively.
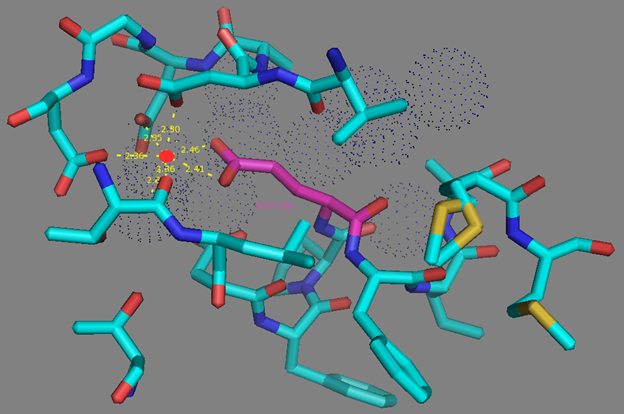
We next describe NCaMP7 calcium coordinating centers, which determined the affinity and specificity to calcium ions, and compare their structure to that in the other Ca2+-binding proteins. Calcium ions in each of the four EF hands of the Ca2+-binding domain form one H-bond with a water molecule and six H-bonds with five amino acids (enumeration of amino acid positions starts from the first in the EF hand): D1 (one H-bond with carboxyl), D3 (one H-bond with carboxyl), D/N5 (one H-bond with carboxyl or amide), T/Y/Q7 (one H-bond with backbone C=O), and E12 (two H-bonds with carboxyl) (Figure 2c–e). Ca2+-bound water molecules in the EF hands form from two to four additional H-bonds with D3, D/N5, D9, and/or E12. Therefore, the EF hands in NCaMP7 have a canonical structure consisting of two short α-helices connected by a loop region, which, together with a single water molecule, provide seven ligands coordinating a single Ca2+ ion in a pentagonal bi-pyramidal coordination sphere. The calcium coordination centers in the other calcium indicators and the Ca2+-binding proteins have a similar composition and 3D structure [7][8]. Hence, NCaMP7 calcium coordinating centers share compositions and structures typical to the calcium-binding proteins, and the calcium-binding centers were not affected by insertion of the CaM/M13 domain into mNeonGreen.
Next, we related the impacts of the mutations found during mutagenesis of the NCaMPs to the X-ray data. The NCaMP indicators revealed 25–26 mutations relative to the original template library (Figures S1 and S4). Among these mutations, 11, 8-9, and 6 mutations were located in the fluorescent domain, the CaM/M13-peptide calcium-binding domain, and the linkers between these domains, respectively. According to the crystal structure of NCaMP7, the R331V and F346L mutations in the fluorescent domain were located about 6.0 Å from the GYG chromophore tripeptide, and all other mutations were more than 6.0 Å away from the chromophore. We speculate that the F346L mutation may be responsible for the slightly decreased brightness of the NCaMP4 indicator (Table S1) because it reduced the hydrophobic pocket composed of side rings of F346 and W348 residues (Figure S5). Since the side group of the V331 residue is directed away from the chromophore, an effect of the R331V mutation on the chromophore’s properties is unlikely (Figure S5). Hence, except for the F346L mutation, all other mutations in the fluorescent domain that appeared during NCaMP’s development seem not to affect the fluorescent properties of the chromophore.
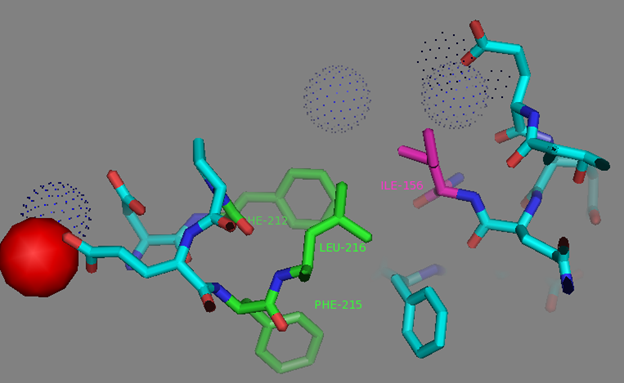
Mutations in CaM and the M13-peptide of NCaMPs may presumably affect the dynamic range and calcium affinities of the indicators. All NCaMPs share six identical mutations in the CaM domain and one identical mutation in the M13-peptide (Figure S1). The I210L and S248G mutations are located in the EF2 and EF3 Ca2+-binding hands, respectively (Figure S4). According to NCaMP7’s crystal structure, the main chain C=O and NH groups of L210 in EF2 form H-bonds with the main chain NH and C=O groups of I174 located in EF1 (Figure S6a). The side chain of L210 is buried into a bulk hydrophobic pocket formed by the hydrophobic amino acids from EF1 and EF2 (F163, F166, I174, L179, M198, I199, L210, F215, M218, and M219) and from the M13-peptide (A317, I318, and L321) (Figure S6b). Therefore, the I210L mutation might influence EF1–EF2 and CaM–M13-peptide interactions. According to NCaMP7’s crystal structure, the main chain NH group of G248 from EF3 forms an H-bond with the carboxyl of E251 (that forms two H-bonds with Ca2+ in EF3) and the C=O group of G248 forms H-bonds with main chain NH groups of E251 and L252 (Figure S7). The S248G mutation in NCaMPs results in a loss of the –CH2–OH group and a possible water-mediated H-bond with Q282 from EF4 or with water, which coordinates Ca2+ in EF3. Hence, the S248G mutation may impact the tuning of the EF3–EF4 interaction and contacts inside EF3. Of the rest of the four identical mutations in CaM of NCaMPs—Q196R, D197V, D269G, and M271L—the first three are located on the surface of CaM and lead to the addition of a positive charge (Q196R) and the removal of two negative charges (D197V and D269G). The main chain carbonyl group of L271 forms an H-bond with NH of the side chain indole of W308 from the M13-peptide (Figure S8). The side chain of L271 is buried into the hydrophobic pocket formed by L252, V255, M256, and L263 from CaM, as well as W308 and A311 from the M13-peptide. The identical T311A mutation in the M13-peptide for all NCaMPs results in the removal of the OH group from the same hydrophobic cluster. This mutation in the M13-peptide might adjust the affinity of NCaMP indicators to calcium ions in a similar way as for the FGCaMP indicator [9]. Thus, seven common mutations in all calcium indicators of the NCaMP series may be responsible for the tuning of the intramolecular interactions inside CaM or between CaM and the M13-peptide.
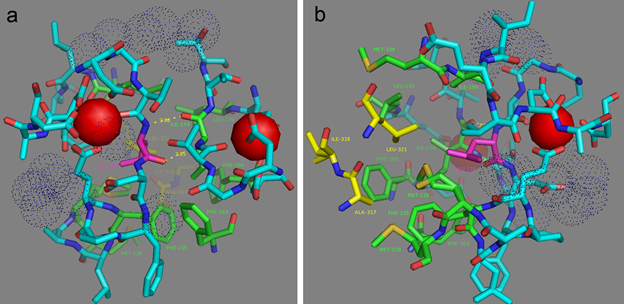
Figure S6. L210 residue hydrogen (a) and hydrophobic (b) contacts according to NCaMP7 X-ray structure (PDB ID - 6XW2). (a) Two H-bonds between L210 (in magenta) and I174 residues are shown as dash lines. (b) Side group of L210 residue (in magenta) is exposed to the hydrophobic pocket which is formed by residues from M13-peptide (A317, I318, and L321, in yellow) and CaM (EF1 and EF2 hands and adjacent to them amino acids) (F163, F166, I174, L179, I199, L210, F215, M218, and M219, in green).
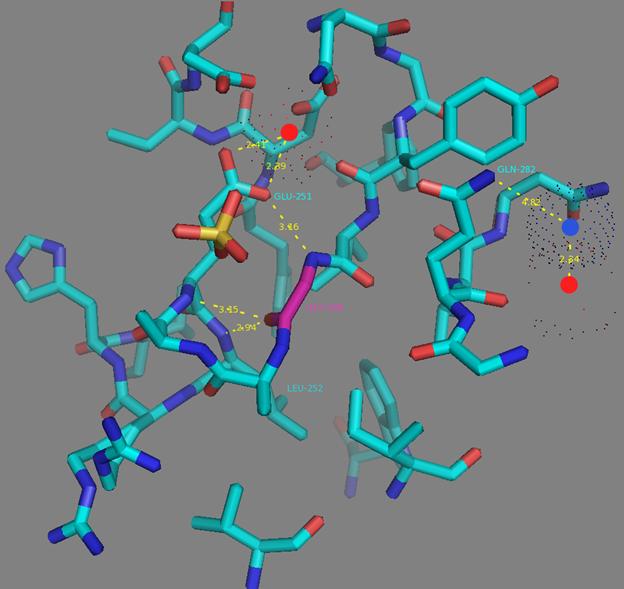
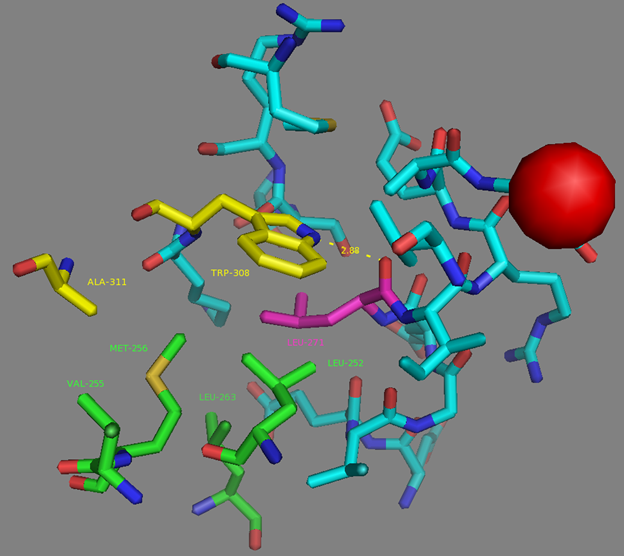
Table 1. In vitro properties of purified NCaMP7 indicator compared to GCaMP6s.
|
Properties |
Proteins |
||||||
|
NCaMP7 |
GCaMP6s |
||||||
|
apo |
sat |
apo |
sat |
||||
|
Abs/Exc maximum (nm) |
402/406 |
509/512 |
402/ND |
500/ND |
|||
|
Emission maximum (nm) |
520 |
522 |
518 |
515 |
|||
|
Quantum yield a |
0.048 ± 0.003 |
0.52 ± 0.03 |
0.11 ± 0.01 |
0.61 |
|||
|
ε (mM−1 cm−1) b |
46.6 ± 2.7 |
110.0 ± 7.3 |
33.3 ± 0.6 |
77 ± 3 |
|||
|
Brightness (%) c |
6.5 |
179 |
8.3 |
107 |
|||
|
ΔF/F (fold) |
0 mM Mg2+ |
89 ± 27 |
43 ± 6 |
||||
|
1 mM Mg2+ |
27 ± 3 |
46 ± 24 |
|||||
|
pKa |
5.43 ± 0.09 6.62 ± 0.09 |
6.18 ± 0.21 |
9.6 ± 0.3 |
6.16 ± 0.08 |
|||
|
Kd (nM) d |
0 mM Mg2+ |
96 ± 5 (n = 2.2 ± 0.3) |
144±3 (n = 3.5 ± 0.2) |
||||
|
1 mM Mg2+ |
125 ± 7 (n = 1.8 ± 0.2) |
227.3 ± 0.2 |
|||||
|
kobs (s-1) e |
0.54 ± 0.02 |
0.49 ± 0.05 |
|||||
|
koff (s−1) f |
k1 (contrib., %) |
0.89 ± 0.01 (78 ± 1) |
0.69 ± 0.01 |
||||
|
k2 (contrib., %) |
0.11 ± 0.01 (22 ± 1) |
||||||
|
t1/2, s g |
1.1 ± 0.1 |
1.01 ± 0.04 |
|||||
a mEGFP (quantum yield, QY = 0.60 ref. [25]) and mTagBFP2 (QY = 0.64 ref. [26]) were used as reference standards for 500–509- and 402-nm absorbing states, respectively. b Extinction coefficient was determined by alkaline denaturation. c Brightness was normalized to mEGFP, with a QY of 0.60 and an extinction coefficient of 53.3 ± 3.6 mM−1cm−1. d Hill coefficient is shown in brackets. e The observed association rates were determined at 300 nM Ca2+ concentration from association kinetics curves (Figure 1f). GCaMP6f had kobs value of 1.28 ± 0.03 sec−1. f koff values were estimated from calcium dissociation curves (Figure 1f) using mono or double exponential decay fitting with individual exponent contributions shown in the brackets. GCaMP6f had a koff value of 1.89 ± 0.01 s−1. g GCaMP6f had a toff value of 0.37 ± 0.04 s. ND, not determined.
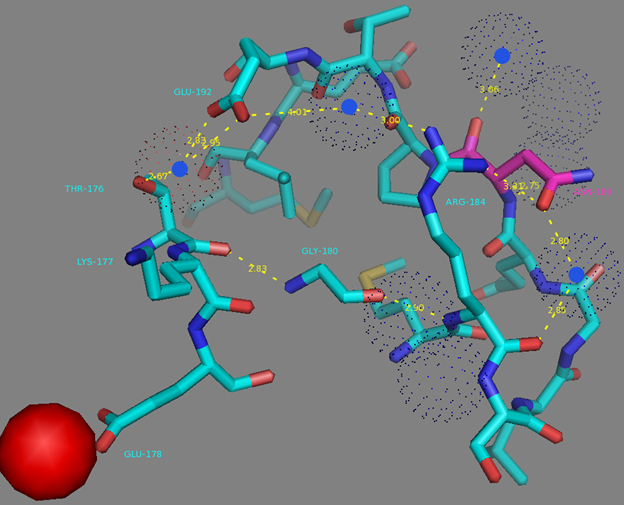
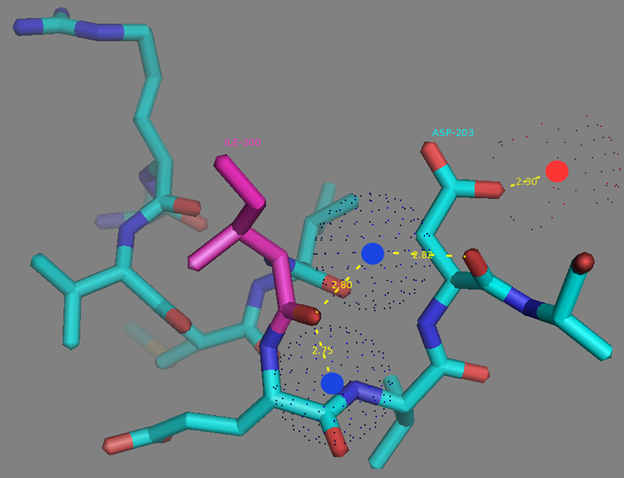
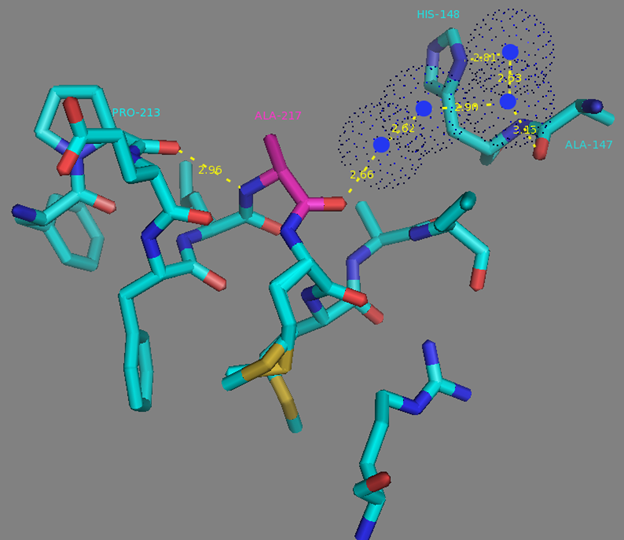
In addition to common mutations, each of the NCaMP indicators contain additional individual mutations in the CaM domain (Figures S1 and S4), which may be responsible for the observed differences in their calcium affinities. According to the Kd values, NCaMP4 has the highest affinity to Ca2+ (Table 1 and Table S1). The N189S mutation in NCaMP4 is located before the Ca2+-binding EF2 hand. According to NCaMP7’s structure, N189 forms H-bonds with two water molecules on the surface of the indicator through its main chain and two H-bonds with R184, one water-mediated bond via side chain atom with main chain of R184 and another one with side chain of R184 (Figure S9). There is an H-bond network from R184 to T176 in the EF1 hand through G180, and water-mediated contact with E192 (all of these residues lay on one α-helix). Therefore, the N189S mutation in NCaMP4 may indirectly influence the position of amino acids in the EF1 hand and result in higher affinity to Ca2+ ions. NCaMP7 contains two mutations around the EF2 hand, N200I and T217A. According to NCaMP7’s structure, I200 is located on the surface of the indicator, and its main chain C=O forms two H-bonds with two water molecules and one water-mediated H-bond with the main chain C=O of D203 in the EF2 hand coordinating Ca2+ ion (Figure S10). The N200I mutation in NCaMP7 may result in a loss of an anticipated additional water-mediated H-bond between the side chains of N200 and D203. According to NCaMP7’s structure, the main chain NH group of A217 forms an H-bond with the main chain C=O of P213 in the EF2 hand, and the main chain C=O group of A217 forms water-mediated H-bonds with the main chain C=O group of A147 and the side chain NH of His148 imidazole in the first linker between the fluorescent and Ca2+-binding domains of NCaMP7 (Figure S11). Hence, the N200I and T217A mutations in NCaMP7 may affect the positions of amino acids in the EF2 hand and in the first linker between the fluorescent and Ca2+-binding domains. The side chains of amino acids in positions 156 and 256 mutated in NCaMP9 and NCaMP10, respectively (Figure S1), are part of the hydrophobic clusters. The mutation I156L in NCaMP9 may influence the location of the calcium-coordinating amino acids in the EF2 hand because, according to NCaMP7’s structure, the side chain of I156 makes hydrophobic interactions with F212, F215, and L216 from the EF2 hand or adjacent to it (Figure S12). Therefore, the mutation I156L in NCaMP9 may result in a decrease of its calcium affinity through the suggested mechanism. The impact from the M256L mutation in NCaMP10 may be similar to the impact from the M271L mutation discussed above, because the side chains of both amino acids are buried in the same hydrophobic pocket formed by the amino acids of CaM and the M13-peptide (Figure S8). The E214G mutation in NCaMP10 is the key mutation responsible for decreasing calcium affinity of the sensor due to a loss of two H-bonds between E214 and Ca2+ ion in the EF2 hand (Figure S13). Thus, the main impacts of additional mutations in the CaM domain of NCaMPs on their properties are ensured by indirect changes of the positions of calcium-coordinating amino acids in the EF1 and EF2 hands or by direct loss of H-bonds with Ca2+ in the EF2 hand.
3. In Vitro Characterization of the Purified NCaMP Indicators
First, we characterized the spectral and biochemical properties of the purified NCaMP7 calcium indicator in the Ca2+-free (apo) and Ca2+-saturated (sat) states (Figure 1b-f and Table 1). In parallel, we characterized the properties of its derivatives, NCaMP4, NCaMP9, and NCaMP10, having higher or lower affinity to calcium ions (Table S1). Later, when we carried out a side-by-side comparison of NCaMPs using stopped-flow fluorimetry, in cultured neurons and in vivo in mice, NCaMP7 showed superior performance; thus, we focused on NCaMP7.
At pH 7.2, NCaMPsapo and NCaMPssat had absorption peaks at 400–403 and 505–509 nm, respectively (Figure 1b, Table 1, and Table S1). The excitation maxima in apo- and sat-states were at 400-408 and 508-512 nm, respectively. When excited at 390 and 470 nm, NCaMPsapo and NCaMPssat fluoresced with emission peaks at 520 and 520–522 nm, respectively (Figure 1c, Table 1, and Table S1). Hence, the NCaMP variants exhibited almost identical spectral properties. The brightness of the NCaMPssat indicators in terms of the product of the extinction coefficient and quantum yield was 1.66–1.82-fold larger than that of the EGFP protein. In the absence of calcium ions, the brightness of NCaMPsapo dropped as a result of a decrease of both quantum yield and extinction coefficient. The fluorescence ΔF/F dynamic range of the NCaMP indicators varied in the range of 32–99. The addition of 1 mM (physiological) concentration of Mg2+ ions decreased the ΔF/F dynamic range of NCaMPs down to 8.9–29 (Table 1 and Table S1); however, in the latter conditions, the high ΔF/F dynamic range of the NCaMP7 indicator was preserved over 27 and was only 1.7-fold lower than that of GCaMPs or 27-fold larger compared to the NTnC indicator.
As the intracellular pH varies from 5.0 in lysosomes to 7.5 in the cytosol [10], we studied the dependence of the fluorescence and dynamic range of the NCaMP indicators on pH. In the presence of 100 µM calcium ions, NCaMPssat exhibited a pH dependence of their fluorescence with pKa values of 5.88–6.18, which were similar to the pKa values of GCaMP6ssat (Figure 1d, Table 1, and Table S1). The fluorescence of NCaMPsapo had a bell-shaped pH dependence with pKa1 = 5.38–5.44 and pKa2 = 6.58–6.84. The different pH stability of NCaMPs in the Ca2+-bound and Ca2+-free states resulted in a dependence of its dynamic range on pH. The fluorescence and dynamic range of the control GCaMP6s calcium indicator with pKa = 6.16 and 9.6 in sat- and apo-states, respectively, were also sensitive to pH variations. Thus, pH variations can contribute to the NCaMPs Ca2+ response.
We further assessed the affinity of the NCaMP indicators to Ca2+ ions in the absence and presence of 1 mM Mg2+ (equivalent to 0.58–1 mM free Mg2+ ions concentration), a concentration that mimics that of 0.5–1–5 mM in the cytosol of mammalian cells [11][12]. According to the equilibrium binding titration experiments, NCaMPs demonstrated a Kd value of 66–204 nM (Figure 1e, Table 1, and Table S1). These affinities match the Ca2+-free concentration changes from 50–100 nM up to 250–10,000 nM in the cytosol of mammalian cells [30,31]. The equilibrium Hill coefficients for the NCaMP indicators varied in the range of 1.7–2.2. They were slightly lower as compared to the Hill coefficient (n = 3.5) for the GCaMP6s indicator. The decreased cooperativity of Ca2+ binding by NCaMPs, as compared to GCaPM6s, could be explained by the different topology of these indicators. The addition of 1 mM Mg2+ ions increased their Kd values up to 82–306 nM or in 1.24–1.66-fold. The lowering of NCaMPs’ affinity in the presence of Mg2+ ions was similar to the 1.58-fold increase of the Kd value for the GCaMP6s indicator. The addition of 1 mM Mg2+ ions also lowered the Hill coefficient values by 1.22–1.36-fold, decreasing the cooperativity of NCaMPs’ interaction with calcium ions (Table 1 and Table S1). Hence, the physiological concentrations of Mg2+ ions decreased the dynamic range and Ca2+ affinity of the NCaMP indicators, but in these conditions, NCaMP7 preserved a high dynamic range of 27 and a calcium affinity of 125 nM, which were 1.7- and 1.8-fold lower, respectively, relative to the same values for GCaMP6s indicator.
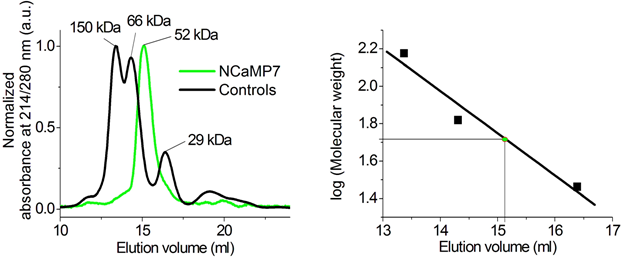
In size-exclusion chromatography, in the presence of Ca2+ ions, NCaMP7 eluted as a monomer at a concentration of 1.7 mg/mL (Figure S14), similar to NTnC and GCaMP6s [2]. NCaMP7 preserved its monomeric state, even at higher concentrations, because it crystallized as a monomer (Figure 1a). Monomeric proteins are less prone to cytotoxicity in mammalian cells [13] and allow labeling of individual proteins [14]. The latter possibility may ensure the direction of NCaMP7 to different places inside the cells, such as organelles, and spines and synapsis in neurons, by fusing NCaMP7 with various signal peptides and proteins.
Overall, the in vitro characterization revealed that NCaMPs had 1.66–1.82-fold improved brightness as compared to the EGFP protein, were sensitive to pH variations, and demonstrated a positive ΔF/F response to calcium ions of 8.9–29 with an affinity of 82–306 nM in the presence of physiological Mg2+ concentration. The main advantages of the NCaMP7 indicator demonstrating the best performance in vivo are a 1.7-fold higher brightness over the GCaMP6s indicator and a positive response and significant 27-fold enhanced dynamic range as compared to the inverted NTnC, the first mNeonGreen-based calcium indicator.
4. Characterization of the Kinetics for the NCaMP Calcium Indicators Using Stopped-Flow Fluorimetry
Since neuronal activity occurs with high rates, it was important to assess the Ca2+-association and -dissociation kinetics for the NCaMP indicators in tight comparison with fast GCaMP6s and GCaMP6f GECIs. The kinetic curves obtained for the control GECIs and NCaMP4 were mono-exponential (Figure S15 and Table S2). Other NCaMP indicators exhibited bi-exponential calcium dissociation kinetics, mono-exponential association kinetics at a low (300 nM) Ca2+ concentration, and bi-exponential association kinetics at Ca2+ concentrations of 700–1000 nM (Figure 1f, Figure S6, Table 1, Table S1, and Table S2). The two exponents and the respective rate constants (k1 and k2) corresponded to rapid and slow binding processes. The rapid processes dominated and accounted for the major fluorescence changes in all cases.
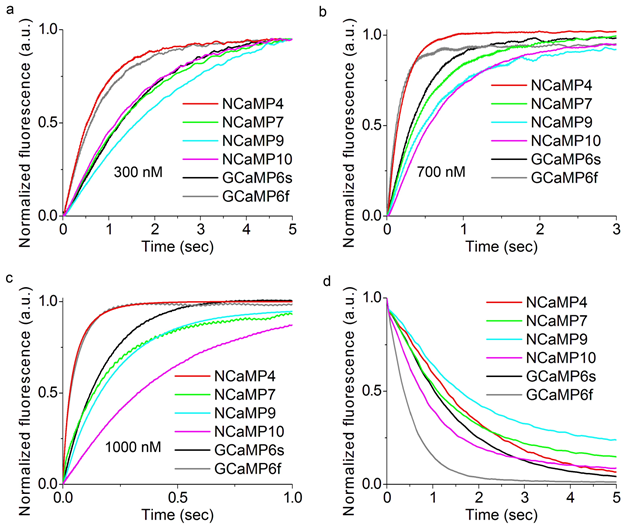
Figure S15. Calcium-association and -dissociation kinetics for the NCaMP7 indicator, its variants, GCaMP6s and GCaMP6f investigated using stopped-flow fluorimetry. (a)-(c) Calcium-association kinetics curves for given GECIs were recorded at 300, 700 and 1000 nM Ca2+-free final concentration. (d) Calcium-dissociation kinetics for respective GECIs was recorded at 1000 nM Ca2+-free starting concentration. Three replicates were averaged for analysis.
The Ca2+ dissociation half-times of 1.1 ± 0.1 and 1.3 ± 0.1 s for NCaMP7 and NCaMP4 were close to that for GCaMP6s (1.01 ± 0.04 s) (Figure 1f, Table 1, and Table S1). Of all NCaMPs, NCaMP10 showed the fastest Ca2+ dissociation, with a half-time of 0.75 ± 0.04 s. This was 2.0-fold slower than the dissociation kinetics of GCaMP6f, which showed a half-time of 0.37 ± 0.04 s (Table S1). Despite the relatively low affinity to calcium ions, NCaMP9 had the slowest dissociation kinetics (half-time of 1.6 ± 0.1 s), 1.6-fold slower as compared to GCaMP6s. Hence, according to the dissociation kinetics data, NCaMP4, NCaMP7, and NCaMP10 resembled GCaMP6s and GCaMP6m [15], while NCaMP9 was not optimal in this regard.
At calcium concentrations of 300–1000 nM, the association rates for NCaMP7 were similar to the respective rates for the control GCaMP6s GECI (Figure 1f and Table S2). NCaMP4 demonstrated the highest association rates among all NCaMPs, 2.3–3.3-fold higher than those for GCaMP6s, which was in line with its largest affinity to calcium ions (Table S1 and Table S2). As compared to GCaMP6s, NCaMP9 and NCaMP10 bound to calcium ions with 1.2–2.6-fold different rates depending on calcium concentration. Hence, according to the stopped-flow experiments, NCaMP indicators demonstrated fast dissociation–association kinetics, similar to that for the fast indicators from the GCaMPs family, and can be applied for further characterization in HeLa and neuronal cells. Calcium dissociation–association kinetics for the best NCaMP7 indicator were very close to the respective kinetics of GCaMP6s in spite of the 1.8-fold larger calcium affinity for NCaMP7.
5. Calcium-Dependent Response of the NCaMP Calcium Indicators in HeLa Mammalian Cells
To compare the performance of the green NCaMP indicators with the GCaMP6s GECI in mammalian cells, we co-expressed them with the red jRGECO1a GECI [16] in HeLa cells and characterized their localization, brightness, and response to the Ca2+ transients. We generated the NES-jRGECO1a-P2A-NCaMPs/GCaMP6s fusions with self-cleavable P2A peptide and transiently expressed them in HeLa cells (Figure 3a and Table S4). The NCaMP variants revealed green fluorescence evenly distributed in the cells and co-localized with red fluorescence of the jRGECO1a indicator (Figure 3a).
The addition of 2.5 µM ionomycin to the cell cultures resulted in an increase of NCaMPs’ green fluorescence (Figure 3a) with an average ΔF/F response of 2.0–22.5 (Table S4). The ΔF/F response of 10.0 ± 2.4 for the NCaMP7 indicator was similar (p = 0.8015) to the response of 12.2 ± 3.1 for the control GCaMP6s. The ΔF/F responses of NCaMPs were equal (NCaMP4, p = 0.6032) or 3.2–7.3-fold larger (NCaMP7-10, p = 0.0079) as compared to the response of the jRGECO1a indicator (Table S4). Except for NCaMP10, the ΔF/F responses for the NCaMP7, NCaMP9, and NCaMP4 GECIs in HeLa cells were 1.3–4.5-fold lower as compared to their dynamic ranges for the purified proteins (Table 1, Table S1, and Table S4); the decrease of the NCaMPs’ dynamic range in HeLa cells correlated with their calcium affinity in vitro. We speculate that only NCaMP10 with a Kd of 306 nM was not bound to calcium ions at physiological concentrations of calcium ions in resting HeLa cells, and all other NCaMPs with lower Kd values of 82–173 nM were, to different extents, bound to the calcium ions. Hence, except for NCaMP4, all NCaMPs demonstrated high ΔF/F values of 10–23 in response to ionomycin-induced calcium concentration elevation in HeLa cells, which were similar (NCaMP7, p = 0.8015) or 1.6- (NCaMP10, p = 0.0159) and 1.8-fold (NCaMP9, p = 0.079) larger as compared to the GCaMP6s indicator.
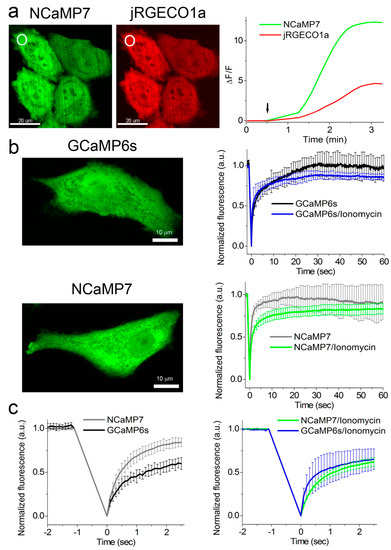
Figure 3. Response of the NCaMP7 indicator to Ca2+ variations in HeLa cells. (a) Confocal images of HeLa cells co-expressing green NCaMP7 (left) and red jRGECO1a (right) calcium indicators. The graph illustrates changes in green or red fluorescence of the NCaMP7 and reference co-expressed jR-GECO1a genetically encoded calcium indicators (GECIs) in response to the addition of 2.5 µM of ionomycin. The changes on the graph correspond to the area indicated with white circles. One example of five is shown. (b) Example of confocal images of HeLa cells expressing GCaMP6s and NCaMP7 calcium indicators used for the fluorescence recovery after photobleaching (FRAP) experiments. The graphs illustrate FRAP induced changes in green fluorescence of NCaMP7 and control GCaMP6s GECIs at physiological Ca2+ concentrations and in response to the 5 µM ionomycin addition for a 60 s time scale. (c) FRAP changes for 2.5 s time scale. (b,c) Error bars are standard deviations across five cells.
To estimate the brightness of NCaMPs and GCaMP6s in HeLa cells, we normalized the maximally achievable green fluorescence of the NCaMPs and the GCaMP6s GECI to the maximal red fluorescence of jRGECO1a expressed in the same cells upon ionomycin administration (Table S4). The brightnesses of NCaMP4 (p = 0.4127), NCaMP7 (p = 0.6667), and NCaMP9 (p = 0.8889) were similar to the brightness of GCaMP6s. Only the brightness of NCaMP10 was slightly higher (p = 0.0238), by 1.4-fold, than that for GCaMP6s. Hence, in HeLa cells, most NCaMPs had brightnesses similar to the brightness of GCaMP6s.
It was earlier suggested that the CaM/M13-peptide pair in the ncpGCaMP6s indicator may be less accessible for interaction with endogenous proteins as compared to the GCaMP6s GECI as a consequence of their different designs [3]. Because the NCaMP7 indicator has the same NTnC-like design as ncpGCaMP, we assessed the suggested reduction of interactions of the NCaMP7 indicator with the intracellular environment using fluorescence recovery after photobleaching (FRAP) of the NCaMP7 study in the cytosol of HeLa cells. FRAP experiments were performed on HeLa cells transiently transfected with NCaMP7 and the control GCaMP6s GECI. In a 60 s time scale, NCaMP7 and the GCaMP6s GECI showed the same (p = 0.9444) percent of immobile fractions at low physiological Ca2+ concentrations (NCaMP7, 8 ± 19%, vs. GCaMP6s, 3 ± 15%) (Fig 3b), which were not statistically different (p = 0.6825) from 0%. In a 60 s time scale, ionomycin-induced elevated Ca2+ concentrations resulted in similar (p = 0.2222) increases of immobile fraction until 18 ± 6% and 13 ± 4% for NCaMP7 and the GCaMP6s GECI, respectively; these percent values were statistically different (p = 0.0079) from 0%. In a 2.5 s time scale under low calcium concentration, NCaMP7 revealed a significantly 2.5-fold (p = 0.0079) less percent of immobile fraction of 16 ± 5% as compared to 40 ± 7% for GCaMP6s (Figure 3c, left). In the same time scale at elevated Ca2+ concentrations, NCaMP7 and GCaMP6 had similar (p = 0.9444) mobility (38 ± 5% vs. 35 ± 12% of immobile fractions for NCaMP7 and GCaMP6s, respectively) (Figure 3c, right). Hence, depending on the time scale and calcium concentrations, NCaMP7 demonstrated a similar or 2.5-fold higher mobility than the GCaMP6s GECI. These results support the idea that the insertion design or topology of the NCaMP7 indicator prevents its interactions with its intracellular surroundings to some extent.
As compared to GCaMP6s, the FGCaMP calcium indicator based on fungal Ca2+-binding proteins demonstrated higher mobility at physiological calcium concentrations in a 0.6 s time scale [9]. A novel design for the GCaMP-X calcium indicator was used to overcome the calcium channel perturbations induced by the calmodulin in GCaMP6m [17]. Thus, GCaMP-X design, the NTnC-like topology of the NCaMP7 indicator, and the application of CaM from fungus in the FGCaMP indicator are alternative strategies to reduce intracellular environment perturbations by GECIs.
6. Visualization of Spontaneous and Induced Neuronal Activity in Dissociated Culture Using NCaMP Indicators and Confocal Imaging
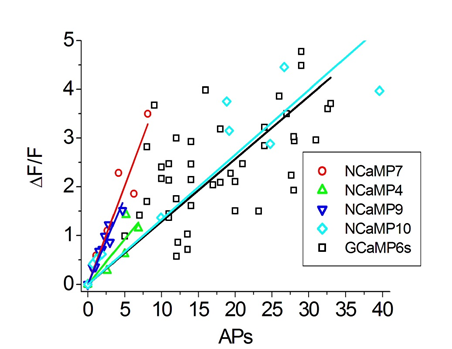
To estimate the ΔF/F responses of NCaMPs compared to GCaMP6s GECI, we used an external electric field for stimulation of dissociated neuronal cultures co-expressing green NCaMPs or the control GCaMP6s GECI, together with the red R-GECO1 indicator (Figure S16 and Table S5). The ΔF/F responses per 1 action potential (AP) for NCaMP4 (19 ± 13%) and NCaMP10 (13 ± 18%) were similar (p = 0.2494 and 0.0953, respectively) to the same characteristic for GCaMP6s (13 ± 8%). The ΔF/F responses per 1 AP for NCaMP7 (40 ± 9%) and NCaMP9 (36 ± 9%) were significantly 3-fold (p < 0.0001) larger than the respective response for GCaMP6s. Hence, on neuronal cultures, all NCaMPs robustly detected neuronal activity, although NCaMP7 was the best in this respect. Thus, we selected NCaMP7 for further validation in neuronal culture.
To validate the functionality of the best NCaMP7 indicator in neurons in more detail, we characterized its localization and fluorescence changes during spontaneous activity in primary mouse neuronal cultures. Accordingly, for localization imaging, we transiently transfected neuronal cultures with plasmids carrying the NCaMP7 green indicator together with the reference of near-infrared mIRFP [18] under the control of the CAG and Syn promoters, respectively. NCaMP7 demonstrated even distribution in neurons and their branches and was excluded from the nucleus (Figure 4a).
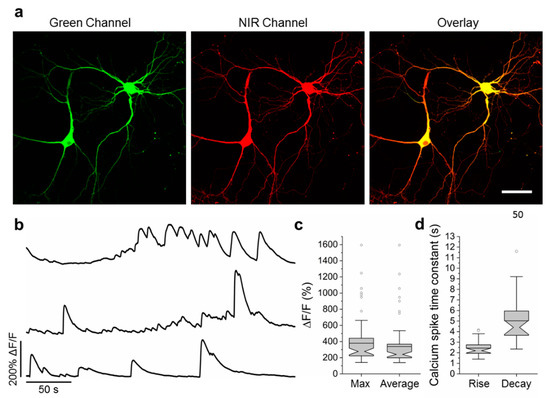
Figure 4. Calcium imaging of primary mouse neurons expressing NCaMP7. (a) Representative confocal images of neurons co-expressing NCaMP7 and miRFP. (b) Representative single cell recording of NCaMP7 green fluorescence responses during spontaneous neuronal activity. (c) Maximal (left) and average (right) ΔF/F for the experiment of b. (d) Time constant for the rise (left) and decay (right) of the NCaMP7 fluorescence during the calcium spikes for the experiment of b. Scale bar, 50 µm.
For functional imaging, we transduced neuronal cultures with rAAVs carrying CAG-NES-NCaMP7 and recorded the spontaneous activity of neurons between 12–19 days in vitro (DIVs). The maximal and averaged ΔF/F responses for the NCaMP7 indicator were about 3.8 and 3.4, respectively (Figure 4b,c). The averaged rise and decay half-times for NCaMP7 were 2.4 ± 0.7 and 5 ± 2 s, respectively. The kinetics and response of NCaMP7 during neuronal spontaneous activity were slightly different from those for GCaMP6s, which demonstrated average rise and decay half-times of 0.6 ± 0.2 and 2.5 ± 1.7 s [2], respectively, and an average ΔF/F of 1.28 ± 1.83 [4]. Overall, these data indicate that the NCaMP7 indicator was well localized in cultured neurons and reliably visualized the spontaneous and electrical field-evoked activity of neuronal cultures.
7. In Vivo Imaging of Neuronal Activity in the Hippocampus of Freely Moving Mice Using NCaMPs and an nVista Miniscope
To finally choose the best variant among the NCaMP indicators, we performed in vivo imaging with an nVista head-mounted miniscope, and compared kinetics, ΔF/F responses, and signal-to-noise ratios (SNRs) of NCaMPs during the visualization of spontaneous neuronal calcium activity in the CA1 field of the hippocampus of freely moving mice during the exploration of a circular track (Figure 5a). NCaMPs were delivered into the mouse hippocampus using rAAVs carrying NES-NCaMPs under the control of the CAG promoter. Based on the spike detection routine described earlier [9], we calculated characteristics averaged across all recorded neuronal activity during the exploration of the O-shaped track by mice. Except for NCaMP9, all NCaMPs demonstrated similar average rise and decay half-times of 0.8–0.9 and 2.0–2.3 s, respectively (Table S6). NCaMP9 had the slowest kinetics with rise and decay half-times of 1.2 ± 0.8 and 2.5 ± 1.2 s, respectively. The longest decay half-time for NCaMP9 in vivo correlated with its slowest dissociation kinetics measured using stopped-flow fluorimetry in vitro (Table S1). Among all NCaMPs, NCaMP7 revealed the best in vivo performance with respect to peak ΔF/F and SNR values (Table S6). Overall, because, among all NCaMPs tested, NCaMP7 showed similar fast dynamics but higher ΔF/F and SNR values, we considered it as the indicator of choice for in vivo applications and further characterized it more carefully.
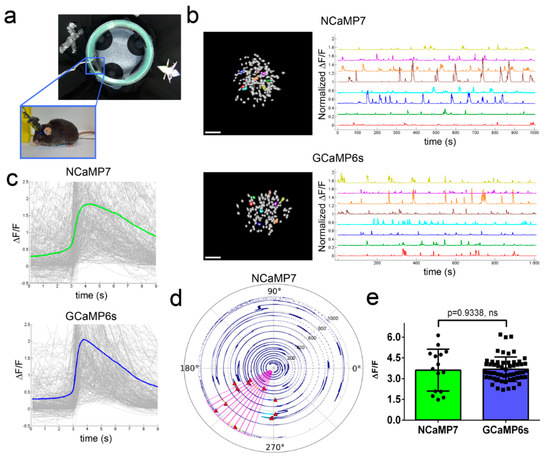
Figure 5. In vivo neuronal Ca2+ activity in the hippocampus of freely behaving mice visualized using NCaMP7 and GCaMP6s calcium indicators and a one-photon nVista HD miniscope. (a) Photo of O-shaped track with landmarks and mouse which explores it with an nVista HD miniscope mounted on its head. (b) Spatial filters and sample traces obtained from a 15-min imaging session of freely behaving mice expressing NCaMP7 and GCaMP6s GECIs. Scale bar, 100 µm. (c) Mean spikes for NCaMP7 and GCaMP6s calcium indicators; spikes above the 4 median absolute deviation (MAD) threshold, and not less than 50% of the maximal trace value, were aligned at the start of the peak (3 s). (d) Example of a circular plot for NCaMP7 mouse trajectory during the exploration of the circular track, synchronized with the spikes of a place cell (red triangles). (e) Averaged ΔF/F responses for space-evoked activity across place neuronal cells (n = 3, NCaMP7; n = 5, GCaMP6s) in the CA1 area of the hippocampus for the NCaMP7 and GCaMP6s indicators. The NCaMP7 and GCaMP6s indicators were delivered to the hippocampus with rAAVs carrying AAV-CAG-NES-NCaMP7/GCaMP6s. Ns, not significant.
Then, we compared the performance of the NCaMP7 and GCaMP6s indicators during the recording of total (specific and nonspecific) neuronal activity in the CA1 field of the hippocampus using the same model and NVista miniscope as described above, but obtaining more data for better statistical comparison. We recorded the green fluorescence in the CA1 area of hippocampus with a head-mounted miniscope (Figure 5a) when mice were exploring the O-shaped track with landmarks (examples of recordings are shown in Figure 5b). Using MIN1PIPE procedure pipeline [19] and manual inspection, we successfully identified active cells and extracted respective calcium activity ΔF/F traces (Figure 5b). The ΔF/F response averaged across all recorded neuronal activity for NCaMP7 was 1.9 ± 1.6; it was similar (p = 0.0615) to the average ΔF/F response of 2.1 ± 1.8 for GCaMP6s (Figure 5c and Table S7). The average rise and decay half-times for NCaMP7 (0.95 ± 0.52 and 3.0 ± 0.9 s, respectively) were 1.25- and 1.2-fold (p < 0.0001) longer as compared to the same half-times for GCaMP6s (0.76 ± 0.49 and 2.5 ± 0.9 s, respectively). Hence, according to in vivo NVista imaging data, NCaMP7 visualized the total (specific and nonspecific) neuronal activity in the hippocampus of mice with efficiency practically identical to GCaMP6s.
We next compared the ability of the NCaMP7 and GCaMP6s indicators to visualize the place-specific activity of CA1 cells using an nVista miniscope [4]. With this aim, using the NCaMP7 and GCaMP6s indicators, we correlated the neuronal calcium activity in the CA1 area of the hippocampus with the mouse movement in the O-shaped track with landmarks (Figure 5a). As a result, using both indicators, we identified the neurons that were specifically activated in certain parts of the track (one example of an NCaMP7-labeled place cell is shown in Figure 5d). The ΔF/F responses of NCaMP7 (3.6 ± 1.5) averaged across space-specific activity of neuronal place cells were similar (p = 0.9338) to the respective responses for the GCaMP6s indicator (3.7 ± 0.9) (Figure 5e). Overall, among all NCaMPs, the NCaMP7 indicator demonstrated the best performance in visualization of total hippocampal neuronal activity, which was similar to the performance of GCaMP6s; NCaMP7 identified hippocampal place cells with a similar efficiency as the GCaMP6s indicator.
8. In Vivo Two-Photon Imaging of Neuronal Activity in the Visual Cortex of Awake Mice Using the NCaMP7 Indicator
To assess the best NCaMP7 indicator in standard two-photon in vivo application, we next carried out two-photon calcium imaging of the NCaMP7 indicator in the 2/3 layer (L2/3) of the primary visual cortex (V1) of awake head-fixed mice during the presentation of drifting grating as a visual stimulus. The NCaMP7 indicator was delivered into the brain of the P0 pups using an injection of rAAV particles. In the 5–7 weeks post-infection, we implanted cranial windows above the V1 brain area of the mice and identified cytosolic nuclei-excluded expression of the NCaMP7 indicator in neuronal bodies (15-25 µm in diameter) according to the green fluorescence in the L2/3 at up to 450 µm in depth (Figure 6a). A wavelength of 960 nm was optimal for two-photon excitation of the NCaMP7-expressing neurons. We further imaged the calcium neuronal activity during the presentation of a black PC monitor, and the same monitor with black–white gratings moving in eight different directions, as a visual stimulus for the NCaMP7-expressing mice. We found neurons demonstrating grating-evoked activity in three mice at depths of 100–230 µm (Figure 6b).
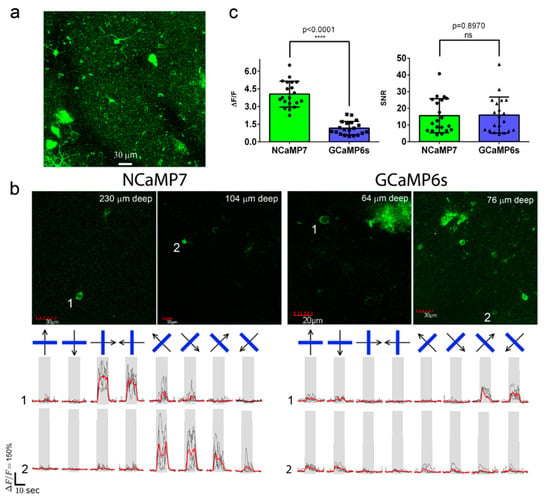
Figure 6. In vivo drifting grating-evoked neuronal activity in the mouse cortex visualized using NCaMP7, GCaMP6s calcium indicators, and two-photon microscopy. (a) The three-dimensional (3D) reconstruction of NCaMP7-positive cells in the V1 visual cortex area excited with 960 nm light. Block size, 360 × 360 × 470 µm. (b) Two-photon images of the V1 layer 2/3 neurons acquired during the presentation of drifting grating to the mice expressing NCaMP7 and GCaMP6s indicators. Raw (in black) and averaged (in red, averaged across five repetitions) ΔF/F responses during the presentation of drifting gratings (eight directions, five repetitions) are shown for the marked neurons. The directions of the drifting gratings (blue lines) are shown with arrows (in black). Grey vertical boxes correspond to the time of the grating presentation. (c) Averaged ΔF/F responses and SNR for grating-evoked activity across neurons (n = 2, NCaMP7; n = 2, GCaMP6s) in the V1 area for the NCaMP7 and GCaMP6s indicators.
According to the analysis among neurons with the largest grating-evoked responses, NCaMP7 showed a 3.4-fold higher (p < 0.0001) average ΔF/F response of 4.1 ± 1.1 compared to the ΔF/F value of 1.2 ± 0.6 for the GCaMP6s indicator (Figure 6c). As compared to GCaMP6s, the increased response of NCaMP7 during stimulus-evoked neuronal activity in the mouse cortex correlated with its 3-fold higher ΔF/F values during electrical stimulation of cultured neurons (Figure S16). NCaMP7 and GCaMP6s demonstrated similar SNR values of 16 ± 12 and 16 ± 14 (p = 0.8970), respectively (Figure 6c). Overall, these data show that the NCaMP7 indicator is appropriate for in vivo two-photon calcium imaging in the mouse cortex and enables the detection of stimulus-evoked calcium transients in neurons.
References
- Benjamien Moeyaert; Graham Holt; Rajtarun Madangopal; Alberto Perez-Alvarez; Brenna Fearey; Nicholas Trojanowski; Julia Ledderose; Timothy A. Zolnik; Aniruddha Das; Davina Patel; Timothy A. Brown; Robert N. S. Sachdev; Britta J. Eickholt; Matthew E. Larkum; Gina G. Turrigiano; Hod Dana; Christine E. Gee; Thomas Oertner; Bruce T. Hope; Eric R. Schreiter; Improved methods for marking active neuron populations. Nature Communications 2018, 9, 4440, 10.1038/s41467-018-06935-2.
- Kazushi Suzuki; Taichi Kimura; Hajime Shinoda; Guirong Bai; Matthew Daniels; Yoshiyuki Arai; Masahiro Nakano; Takeharu Nagai; Five colour variants of bright luminescent protein for real-time multicolour bioimaging. Nature Communications 2016, 7, 13718, 10.1038/ncomms13718.
- Oksana M. Subach; Natalia V. Barykina; Konstantin Anokhin; Kiryl D. Piatkevich; Fedor Subach; Near-Infrared Genetically Encoded Positive Calcium Indicator Based on GAF-FP Bacterial Phytochrome.. International Journal of Molecular Sciences 2019, 20, 3488, 10.3390/ijms20143488.
- Natalia V. Barykina; Oksana M. Subach; Danila A. Doronin; Vladimir P. Sotskov; Marina A. Roshchina; Tatiana A. Kunitsyna; Alexey Malyshev; Ivan Smirnov; Asya Azieva; Ilya S. Sokolov; Kiryl D. Piatkevich; Mikhail S. Burtsev; Anna Varizhuk; Galina E. Pozmogova; Konstantin V. Anokhin; Fedor V. Subach; Grigori N. Enikolopov; A new design for a green calcium indicator with a smaller size and a reduced number of calcium-binding sites. Scientific Reports 2016, 6, 34447, 10.1038/srep34447.
- JingJin Ding; Andrew F. Luo; Liyan Hu; Dacheng Wang; Feng Shao; Structural basis of the ultrasensitive calcium indicator GCaMP6. Science China Life Sciences 2014, 57, 269-274, 10.1007/s11427-013-4599-5.
- Fedor V Subach; Kiryl D Piatkevich; Vladislav V. Verkhusha; Directed molecular evolution to design advanced red fluorescent proteins.. Nature Methods 2011, 8, 1019-26, 10.1038/nmeth.1776.
- Damien Clavel; Guillaume Gotthard; David Von Stetten; Daniele De Sanctis; Hélène Pasquier; Gerard G. Lambert; Nathan C. Shaner; Antoine Royant; Structural analysis of the bright monomeric yellow-green fluorescent protein mNeonGreen obtained by directed evolution.. Acta Crystallographica Section D Structural Biology 2016, 72, 1298-1307, 10.1107/S2059798316018623.
- N C J Strynadka; M N G James; Crystal Structures of the Helix-Loop-Helix Calcium-Binding Proteins. Annual Review of Biochemistry 1989, 58, 951-999, 10.1146/annurev.biochem.58.1.951.
- Jessica L. Gifford; Michael P. Walsh; Hans J. Vogel; Structures and metal-ion-binding properties of the Ca2+-binding helix–loop–helix EF-hand motifs. Biochemical Journal 2007, 405, 199-221, 10.1042/bj20070255.
- Oksana M. Subach; Paula J. Cranfill; Michael W. Davidson; Vladislav V. Verkhusha; An Enhanced Monomeric Blue Fluorescent Protein with the High Chemical Stability of the Chromophore. PLOS ONE 2011, 6, e28674, 10.1371/journal.pone.0028674.
- Jeffrey W. Priest; Stephen L. Hajduk; Developmental regulation of mitochondrial biogenesis inTrypanosoma brucei. Journal of Bioenergetics and Biomembranes 1994, 26, 179-191, 10.1007/bf00763067.
- Jacques Brocard; Sunita Rajdev; Ian J. Reynolds; Glutamate-induced increases in intracellular free Mg2+ in cultured cortical neurons. Neuron 1993, 11, 751-757, 10.1016/0896-6273(93)90084-5.
- Miguel Maravall; Zachary F Mainen; B.L. Sabatini; K. Svoboda; Estimating intracellular calcium concentrations and buffering without wavelength ratioing.. Biophysical Journal 2000, 78, 2655-2667, 10.1016/s0006-3495(00)76809-3.
- Nathan C Shaner; Paul A Steinbach; Roger Y Tsien; A guide to choosing fluorescent proteins. Nature Methods 2005, 2, 905-909, 10.1038/nmeth819.
- Nathan C Shaner; Robert E. Campbell; Paul A Steinbach; Ben N G Giepmans; Amy E Palmer; Roger Y Tsien; Improved monomeric red, orange and yellow fluorescent proteins derived from Discosoma sp. red fluorescent protein. Nature Biotechnology 2004, 22, 1567-1572, 10.1038/nbt1037.
- Tsai-Wen Chen; Trevor J. Wardill; Yi Sun; Stefan R. Pulver; Sabine Renninger; Amy Baohan; Eric R. Schreiter; Rex A. Kerr; Michael B. Orger; Vivek Jayaraman; Loren L. Looger; Karel Svoboda; Douglas Kim; Ultrasensitive fluorescent proteins for imaging neuronal activity. Nature 2013, 499, 295-300, 10.1038/nature12354.
- Julien Vermot; Dana H; Mohar B; Sun Y; Narayan S; Gordus A; Hasseman JP; Tsegaye G; Holt Gt; Hu A; Walpita D; Patel R; Macklin Jj; Bargmann Ci; Ahrens Mb; Jayaraman V; Looger Ll; Svoboda K; Kim Ds; Faculty of 1000 evaluation for Sensitive red protein calcium indicators for imaging neural activity.. F1000 - Post-publication peer review of the biomedical literature 2017, 5, , 10.3410/f.726233264.793530262.
- Yaxiong Yang; Nan Liu; Yuanyuan He; Yuxia Liu; Lin Ge; Linzhi Zou; Sen Song; Wei Xiong; Xiaodong Liu; Improved calcium sensor GCaMP-X overcomes the calcium channel perturbations induced by the calmodulin in GCaMP. Nature Communications 2018, 9, 1504, 10.1038/s41467-018-03719-6.
- Kiryl D. Piatkevich; Erica E. Jung; Christoph Straub; Changyang Linghu; Demian Park; Ho-Jun Suk; Daniel Hochbaum; Daniel Goodwin; Eftychios A. Pnevmatikakis; Nikita Pak; Takashi Kawashima; Chao-Tsung Yang; Jeff Rhoades; Or Shemesh; Shoh Asano; Young-Gyu Yoon; Limor Freifeld; Jessica L. Saulnier; Clemens Riegler; Florian Engert; Thomas Hughes; Mikhail Drobizhev; Bálint Szabó; Misha B. Ahrens; Steven W. Flavell; Bernardo L Sabatini; Edward S. Boyden; Publisher Correction: A robotic multidimensional directed evolution approach applied to fluorescent voltage reporters.. Nature Methods 2018, 14, 901-901, 10.1038/s41589-018-0023-6.


