 +1 credit
| Version | Summary | Created by | Modification | Content Size | Created at | Operation |
|---|---|---|---|---|---|---|
| 1 | Huichen Jiang | + 1874 word(s) | 1874 | 2019-05-01 10:14:16 | | | |
| 2 | Huichen Jiang | + 1877 word(s) | 1877 | 2019-05-01 10:22:27 | | | | |
| 3 | Huichen Jiang | + 1877 word(s) | 1877 | 2019-05-01 10:28:26 | | | | |
| 4 | Huichen Jiang | + 1873 word(s) | 1873 | 2019-05-01 10:33:21 | | | | |
| 5 | Huichen Jiang | + 1877 word(s) | 1877 | 2019-05-01 10:34:25 | | | | |
| 6 | Huichen Jiang | + 1112 word(s) | 1112 | 2019-05-01 10:36:25 | | | | |
| 7 | Huichen Jiang | + 1112 word(s) | 1112 | 2019-05-01 10:38:26 | | | | |
| 8 | Bruce Ren | -15 word(s) | 1097 | 2020-10-30 07:19:06 | | | | |
| 9 | Bruce Ren | -15 word(s) | 1097 | 2020-10-30 07:19:41 | | | | |
| 10 | Bruce Ren | Meta information modification | 1097 | 2020-10-30 07:20:45 | | | | |
| 11 | Huichen Jiang | + 2062 word(s) | 3159 | 2020-10-30 07:20:54 | | | | |
| 12 | Huichen Jiang | + 4 word(s) | 3163 | 2020-10-31 10:06:00 | | | | |
| 13 | Huichen Jiang | -1 word(s) | 3162 | 2020-10-31 10:06:48 | | | | |
| 14 | Bruce Ren | + 3 word(s) | 3165 | 2020-11-02 02:25:16 | | | | |
| 15 | Bruce Ren | Meta information modification | 3165 | 2020-11-02 02:41:52 | | | | |
| 16 | Thyago Celso Cavalcante Nepomuceno | Meta information modification | 3165 | 2021-03-06 11:11:56 | | |
Video Upload Options
DEA (Data Envelopment Analysis), as a methodology for the efficiency evaluation of Decision-Making Units (DMUs) with multiple inputs and outputs, is widely used in various areas. The basic idea of DEA is to fit a non-parametric efficient production frontier with DMUs and measure the efficiency relative to the best-performance observations in the sample. In this paper, the China’s listed firms in the automotive industry are seen as the DMUs, and our goal is to measure the efficiency of each DMU and identity the ones that use the inputs more efficiently than the others that have resources over-utilized, namely, the firms can reduce the inputs while the outputs remains constant (input-oriented) rather than the firms can increase the outputs while their inputs remains constant (output-oriented). Therefore, the input-oriented model of DEA is appropriate for our research.
1. Introduction
As one of the important pillar industries in China, the automotive industry plays a significant role in the national economy and in social development. According to the latest statistics released by the China Association of Automobile Manufactures (CAAM), the total production and sales volume of Chinese cars reached a new high with 28.119 million vehicles produced and 28.028 million vehicles sold. The production and sales showed relatively rapid growth, and have ranked first among world economies since 2009 [1].
Along with the rapid development of the automotive industry, the existing energy and environmental problems cannot be ignored. First, massive car ownership accelerates the very large demand for crude oil. In 2016, Chinese car ownership reached 295 million. According to the report of the China Energy News, the dependence on foreign oil rose to 65.4% for the year [2]. Second, there is an urgent demand of preventing and controlling the pollution of motor vehicle emissions. Currently, the automobiles in China are mainly fueled by gasoline and diesel refined from crude oil [3], and, according to the report of the Ministry of Environmental Protection of the People’s Republic of China (MEPPRC), the vehicle emissions of China in 2016 were estimated to be around 44.725 million tons, becoming a significant source of air pollution in China, resulting in Particulate Matter 2.5 (PM2.5) pollution and photochemical smog [4].
Nowadays, the Chinese economy has entered into an era of “New Normal”, the vision of green development has been gradually absorbed into the vehicle industry in the background of the “low-carbon economy”. Moreover, it is an important measure for cultivating new momentum and accelerating the transformation and upgrading of the automotive industry to develop the new energy vehicle (NEV) industry. According to the Energy-Saving and New Energy Automobile Industry Development Plan 2012–2020, new energy vehicle (NEV) refers to automobiles that use a new type of power system (driven completely, or mainly relying on new energy sources). Currently, there are mainly three kinds of NEVs: battery electric vehicles, plug-in hybrid electric vehicles, and fuel cell vehicles [5]. During the inspection in Shanghai, Chinese President Xi Jinping pointed out that the automobile market was very large, the automotive industry was full of advanced technology and detailed management, and the development of new energy vehicles was the only road for China to transform from a large automobile-manufacturing country to a powerful one [6]. Premier Li Keqiang also pointed out the green development of China needed green products (i.e., NEVs), and Chinese firms should endeavor to build up global brands with innovation [7]. To facilitate the healthy development of the NEV industry, the Chinese government has formulated many policies and regulations (e.g., tax incentives, subsidy policies, and national and industrial standards). The policy support has sped up the development of NEVs in China. For enterprises, more and more automotive firms turn to, and concentrate on, the research and development (R&D) of NEVs and their spare parts, and hope to seize the opportunities as soon as possible, e.g., BYD and SAIC [8][9]. Some of them have achieved performance improvements and cost reductions. For customers, there has been an increase in choosing NEVs as one of the travel tools for Green Travel, the NEV ownership has exceeded one million in China, which is equivalent to 50% of the world NEV ownership [10]. Taking Beijing as an example, according to the communique of the Management Office subordinated to Beijing Traffic Management Bureau, the data show that the total quota of personal new energy vehicles of Beijing in 2017 was 51,000. However, city residents had divided up the quota in April. As of 12:00 p.m. on 8 December 2017, there were still 120,376 users wishing to buy a new energy vehicle waiting in line [11]. Overall, the NEV industry has been in the spotlight.
It has been more than 60 years since the construction of the First Automobile Manufactory in 1953, which was the beginning of the Chinese automotive industry. Based on the data manually collected by the authors, there were 3030 firms listed in China’s A-share stock market by the end of 31 December 2016, and 121 of them were focused on the R&D of vehicles, including automobiles and their spare parts. The number of automotive firms accounted for 3.7% of the number of A-share firms. The research and development of new energy vehicles rose in the early 2000s. In February 2009, the Ministry of Finance of the People’s Republic of China (MFPRC), the Ministry of Science and Technology of the People’s Republic of China (MSTPRC), the National Development and Reform Commission (NDRC), and the Ministry of Industry and Information of the People’s Republic of China (MIITPRC) convened a meeting to discuss the demonstration, promotion, and pilot schemes of NEVs and the cities including Beijing and Shanghai play an active part in that activity [12]. During the “two sessions” (the National People’s Congress and the National Committee of the Chinese People’s Political Consultative Conference), officers of the MFPRC and MIITPRC said that the pilot schemes produced good results as thousands of NEVs had been promoted. Moreover, people who wish to buy a NEV will get a purchase subsidy up to tens of thousands Renminbi (RMB) [13]. In 2014, because of the explosive growth of production and sales of the NEV industry, 2014 was called “the first year of new energy vehicle consumption” by the research institute of Ministry of Commerce of the People’s Republic of China (MCPRC) [14]. The data released by CAAM show that the production and sales volume were 51.7 million and 50.7 million in 2016, respectively [15].
To sum up, the automotive industry in China has been rapidly growing. However, whether the firms efficiently operated and the efficiency gap between new energy and traditional vehicle sub-industries are vital for the sustainable development of the automotive industry. Thus, we need to find an appropriate model to measure the efficiency of the automotive firms, and the previous studies on the efficiency evaluation are useful guidelines for our research. Some of them are based on the financial ratios, using traditional statistical methods including principal analysis (see [16][17]) and factor analysis (see [18][19][20][21][22]). However, when it comes to evaluating the performance of firms with multiple inputs and outputs, Data Envelopment Analysis (DEA) is more appropriate to be used in the situation. Moreover, we do not need to predetermine the weights of inputs and outputs in the DEA [23]. Additionally, the efficiency evaluation based on DEA has no needs of the setting of a production function, which measures the relative efficiency with the efficient frontier built by the sample (see [24]).
DEA has been applied to the comparative analysis of the efficiency of productive units in various economic sectors, including the automotive industry. González, Cárcaba, and Ventura used DEA to measure the product efficiency of the vehicles in Spain [25]. By using the DEA and Malmquist model Voltes-Dorta, Perdiguero, and Jiménez made a detailed analysis on the emission efficiency of Spanish cars [26]. Choi and Oh evaluated the product efficiency of traditional vehicles and hybrid vehicles using DEA[27].
The studies related to China’s automotive industry were as follows. Jiang and Zhang introduced Charnes Cooper Rhodes (CCR) and Charnes Cooper Golany Seiford Stutz (C2GS2) DEA models to measure the research and development (R&D) efficiency of a Chinese automotive firm [28]. Tan researched the investment effectiveness of automotive firms with DEA, the study showed that most firms were at the stage of increasing returns to scale in 2003, which meant the sizes of firms were smaller than the optimal scales [29]. Liu and Wu made an efficiency analysis of the listed automotive firms and found that the low level of technical efficiency resulted from the low level of scale efficiency, their results showing that the scale efficiency gap was continuously large in 2005 [30]. Based on the sample of automotive firms from 2005 to 2007, Huang pointed out the overall technical efficiency decreased over time and some firms in a state of constant returns to scale turned out to be firms with increasing returns to scale [31]. The study of Wang et al. suggested that there was rapid growth in the scales of inputs and outputs of China’s automobile industry from 2006 to 2010. However, the growth rate of sales and production decreased in 2011, and the scale expansion of the industry should be carefully treated in case of the potential decline of the demand [32]. Zhou and Liu pointed out that because of the decline of air quality and the demand of achieving carbon reduction targets, NEVs drew public attention. Meanwhile, because there was a long way for people to change consumption habits, the market for NEVs was not mature and the consumption custom needed to be cultivated [33].
As these DEA models are mainly used in analyzing the efficiency of Decision-Making Units (DMUs) in a static way, the combination of DEA and Malmquist models can measure the growth of the total factor productivity of each DMU year by year [34]. Moreover, the application of Malmquist models can provide detailed decomposition, which is useful for the dynamic analysis. Therefore, we built DEA and Malmquist models for the efficiency evaluations of the automotive industry and the detailed setting of the models and results are shown in the following section. Gonzalez et al. pointed out that the combination of technology, useful models, and analysis is beneficial to the decision-maker [35].
The rest of paper is structured as follows: Section 2 presents the concept of Data Envelopment Analysis (DEA) and Malmquist model, and shows our model setting and data sources. In Section 3, the descriptive statistics are given in the beginning of the section. By using our DEA and Malmquist models, we make an overall and further analysis of the automotive industry. Based on the data manually collected from the publicly-disclosed financial statement, we present an efficiency comparison in terms of the sub-industry level. Based on the descriptive statistics, we find that the size of each firm is quite different. Further research is presented by dividing the firms into five groups depending on their sizes. Additionally, the robustness based on prior research is given. The discussions and conclusions based on the industry development and the efficiency evaluations are given in Section 4.
2. Development
Our major contributions were as follows: First, we make an efficiency evaluation based on DEA and Malmquist models, statically and dynamically measuring the efficiency of listed automotive firms. Second, as previous studies concentrated on the firms’ performance before 2012, our research, based on the panel data of 77 listed A-share firms and the period between 2012 and 2016, contributes to the existing literature. Third, we manually collect the data of main businesses from the publicly-disclosed financial statements, and subdivide the automotive industry into the traditional vehicle industry and the NEV industry, the results showing that the characteristics of the whole industry and the sub-industries changed with the development of the industry.
3. Findings
Our research using the DEA model and Malmquist index approach makes a static and dynamic efficiency measurement of China’s listed automotive industry consisting of traditional and NEV firms. The summary and implications of the results are shown below.
First, the year-by-year Malmquist analysis shows that the influences of the factors on the Malmquist index are different. During the periods of 2012–2013 and 2013–2014, with the increasing concerns of air quality, PM2.5, haze, and traffic congestion, “the restriction policy of car purchase” have been implemented in Beijing since 23 December 2010. Guangzhou issued the policy on 30 June 2012. Tianjin announced the policy on 15 December 2013. Hangzhou implemented a similar policy on 26 March 2014. Shenzhen implemented a car purchase restriction policy on 18 December 2014. Therefore, the sales and production is influenced by the government policy to some extent, which could partly explain the reason the overall technical regress of the automotive industry during the periods. In the background of the increasing demand of NEVs, the improving of charging infrastructures, the expansion of product lines, and government support of NEV purchases, including tax incentives and government subsidies, (See Full Text: https://doi.org/10.3390/su10010184), there is a rapid growth of the NEV sales in China based on the publicly-disclosed data from CAAM (see [36-44]), which facilitates the growth of revenue of the whole industry, i.e., the growth of technical change during the periods of 2014–2015 and 2015–2016. The technical change reached a peak from 2015 to 2016. Additionally, the change of technical efficiency from 2014 to 2016 suggested there was room for the improvement of efficiency in the automotive industry.
Second, the average total factor productivity of different firms during the period of 2012–2016 considerably varies and the Malmquist analysis at the firm level proves the point. Therefore, we further discuss the technical efficiency of the firms in 2016. In this paper, the firms are subdivided into two groups: the traditional vehicle and the NEV. From the perspective of technical efficiency, four NEV firms and five traditional vehicle firms were running at the efficient frontier in 2016. In terms of the pure technical efficiency and scale efficiency, our research, based on 77 firms spanning from 2012 to 2016, shows, firstly, that the scale efficiency gap was not as large as in Liu and Wu . Additionally, the scale efficiency for most firms was higher than 0.9 in 2016. Secondly, the finding that there was a certain number of firms in a state of decreasing returns to scale in both industries was different from , especially the NEV firms, and the characteristics of two sub-industries on returns to scale was the same in 2012 but different in 2016, which indicates that the development stage of China’s automotive firms changed and the firms should pursue for the efficient growth based on the development of the sub-industry, rather than the simple scale expansion. Third, we should notice that the scale efficiency and the pure technical efficiency of the NEV industry was relatively higher than that of the traditional vehicle industry during the sample period, which resulted in the higher efficiency of NEV industry. Besides, during the past two years, the efficiency gap turned out to be wider than before, due to the higher pure technical efficiency, which showed there was a bright future for the NEV industry, while the traditional firms should actively optimize the allocations of inputs and achieve the efficiency improvements.
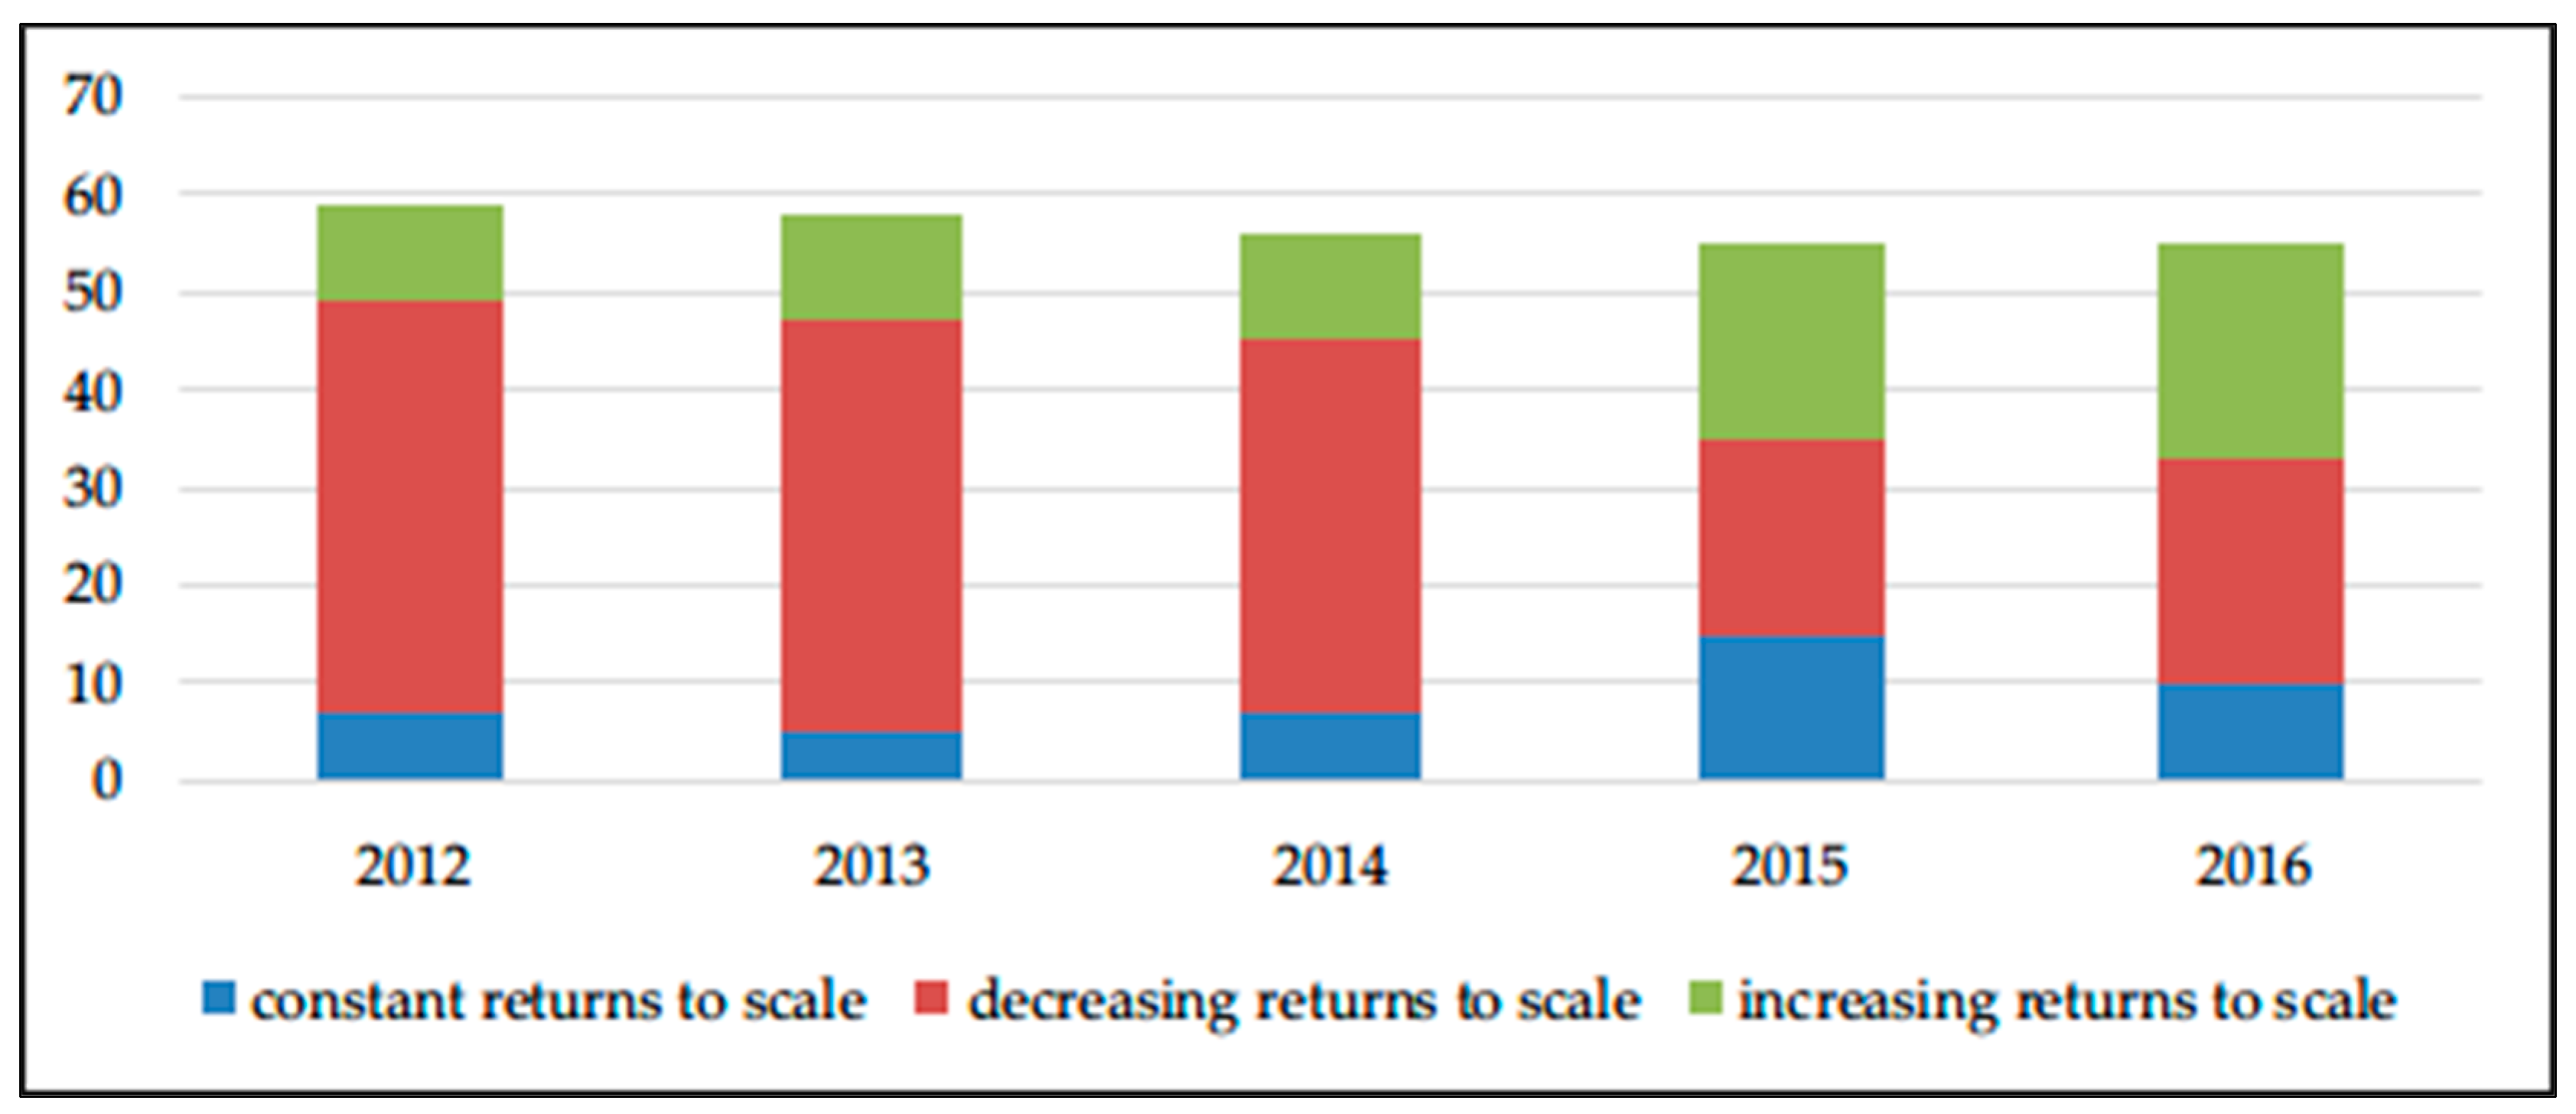
Figure 1. Returns of scale (Rts) of the traditional vehicle industry.
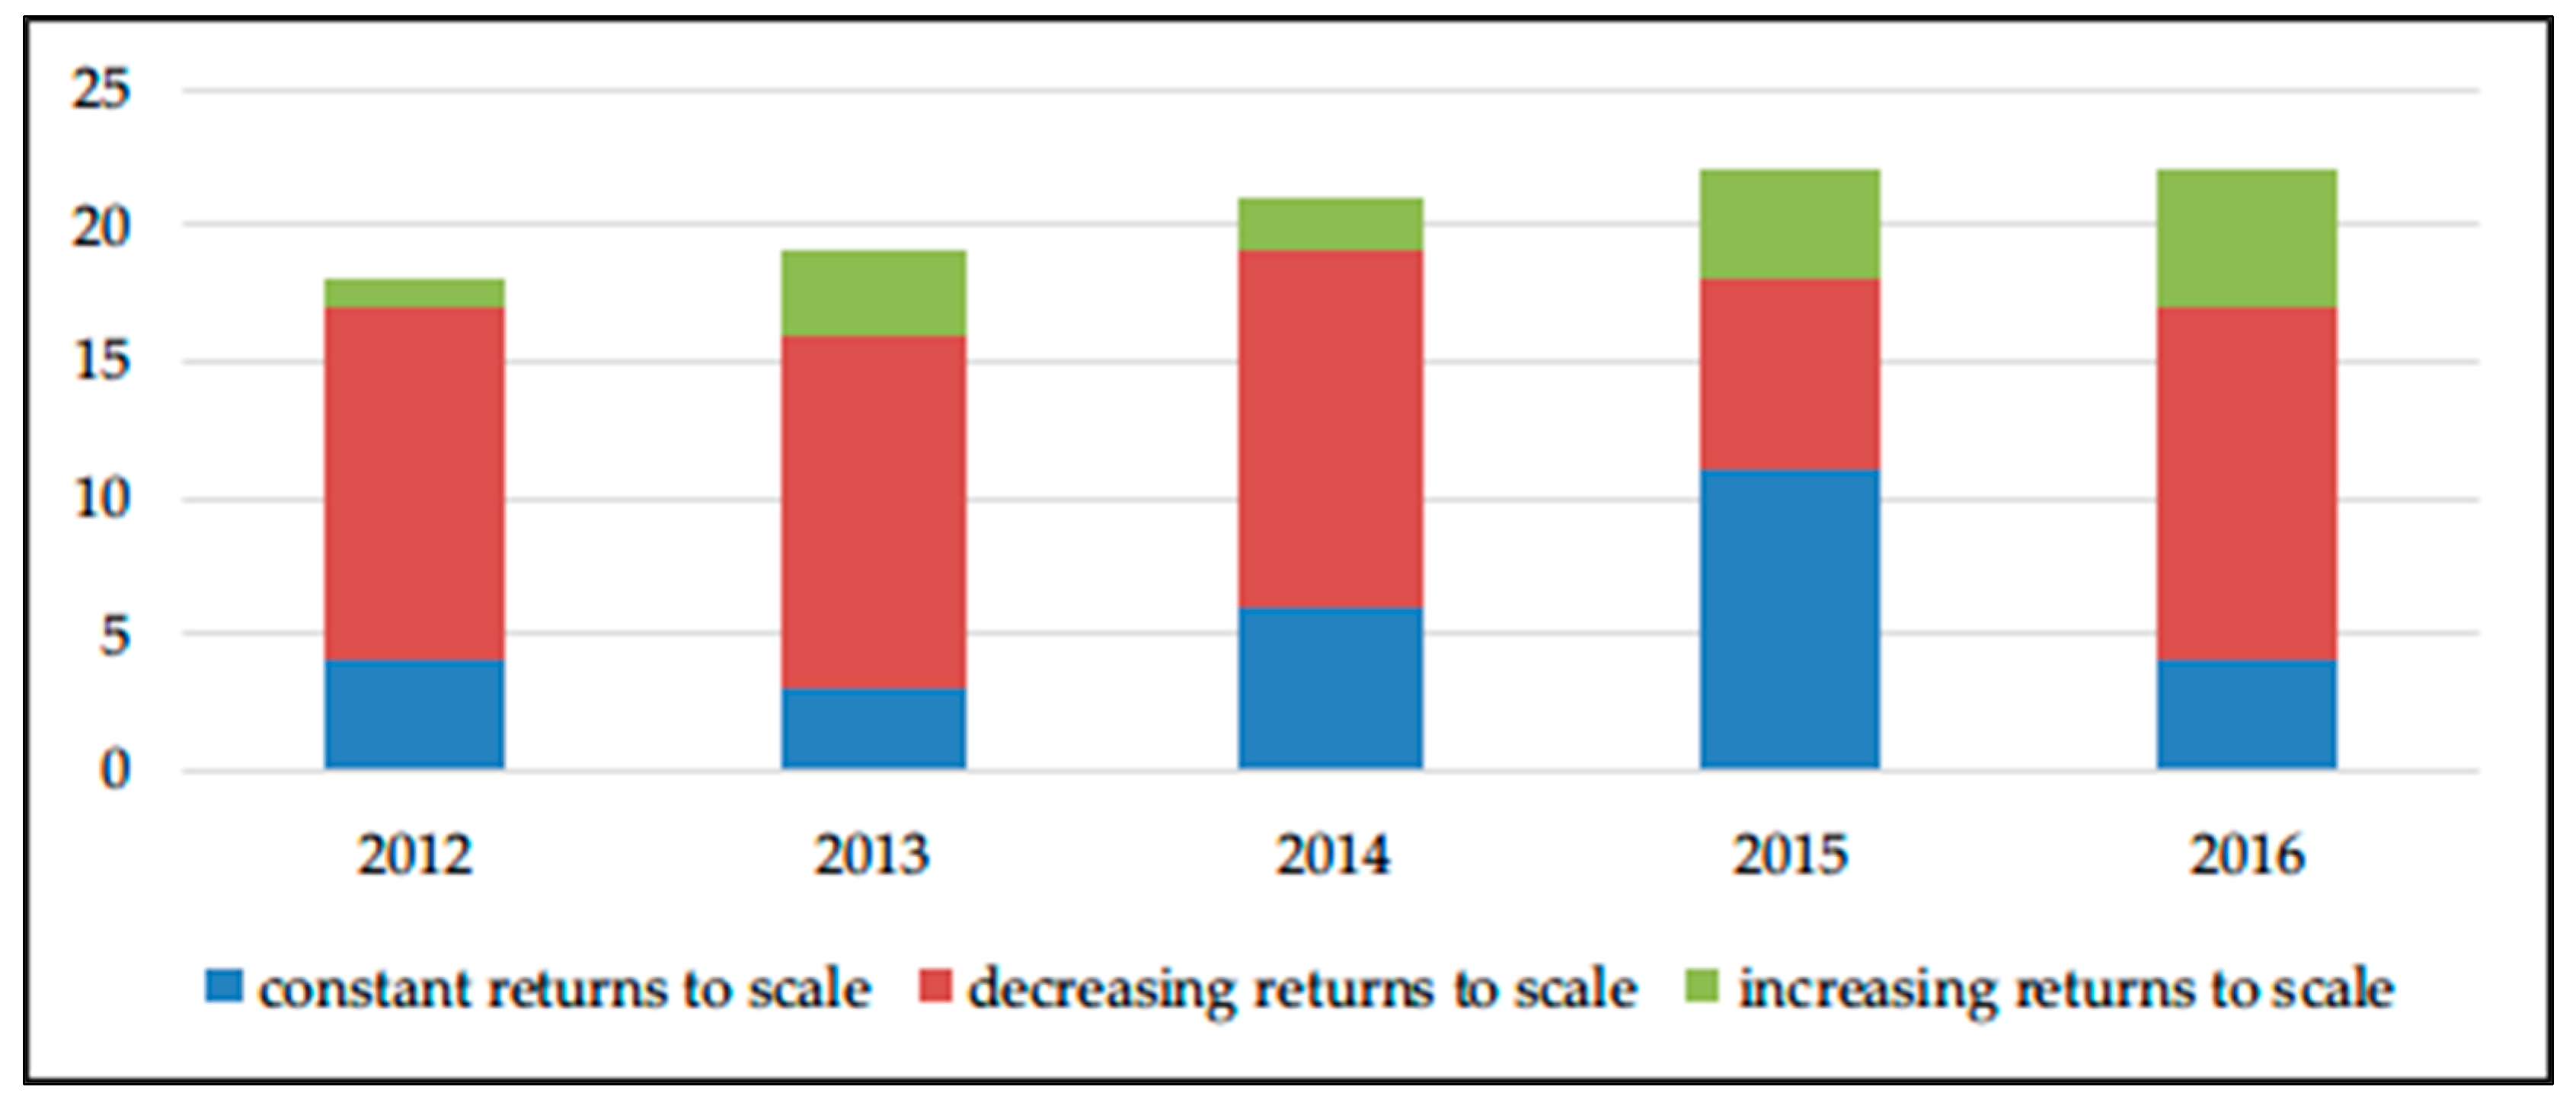
Figure 2. Returns of scale (Rts) of the NEV industry.
Third, we find the high skew phenomenon in the distributions of automotive firms in Section 3. By classifying the firms into five groups according to size, the result clearly shows that the technical efficiency of NEV firms in the Extra Small group stands out among all groups. For instance, YXKC and YYDQ in the Extra Small group performed well in 2016. YXKC has a strong team of experts from the United States, Australia and Europe. They have advanced design concepts, which forms the core technical force. The quality of their products (NEV bus) has been recognized by the market. YXKC seizes the opportunity of the NEV policy from Chinese government. The technical efficiency of YXKC was 0.992 in 2016, and YXKC ranked number 11 in 77 automotive firms for the technical efficiency. YYDQ is a National High-Tech Enterprise in China, which have the ability of independent research, development and innovation. According to the publicly-disclosed information of YYDQ, the cost of research and development accounts for more than 5% of the operating income every year. YYDQ is one of the leading enterprises in terms of the intelligent power controller of the automobiles, and the technical efficiency of YYDQ was 0.998 in 2016, which ranked 10th in the automotive industry for the technical efficiency. Though the sizes of two firms are relatively small, YXKC ranked number 71st of 77 automotive firms and YYDQ ranked 64th in 77 automotive firms in 2016. However, they are outstanding firms with high technical efficiency. Compared with the production of traditional vehicles, which is more routinized and fixed, the production of new energy vehicle is more of an innovative and expansive mode that facilitates efficiency of the small firms.
Currently, there were only 22 China NEV firms in 2016, and we believe that with the increasing concerns of the energy and the environment, there will be more and more firms turn to be NEV firms. Additionally, the market competition will be fiercer. Nowadays, world famous companies such as the Amazon.com Incorporated (Amazon.com Inc., Seattle, Washington State, the United States), the Apple Incorporated (Apple Inc., Cupertino, State of California, the United States), etc. were small at startup; then, being superpowers in innovation, grew from small firms to large firms and even giant firms gradually. Our result shows that, no matter the size of a firm, only the firm which seizes the development opportunity and makes fully use of the resources can succeed, and we believe a few of them (especially the NEV firms) will become leading enterprises similar to Amazon.com Inc. and Apple Inc.
According to the 2016 Annual Report on the National Economy and Social Development, China’s private car ownership reached 165.59 million [45]. With the increase of car ownership, the automotive market tends toward saturation. In addition, with the support of government and the advantage of NEVs in terms of technical progress, the NEV industry is likely to be a new driving force of the economy, therefore, the competition between NEV firms and traditional firms will be more and more competitive. Thus, the improvement of efficiency is the key for firms to succeed.
Our major contributions were as follows: First, we make an efficiency evaluation based on DEA and Malmquist models, statically and dynamically measuring the efficiency of listed automotive firms. Second, as previous studies concentrated on the firms’ performance before 2012, our research, based on the panel data of 77 listed A-share firms and the period between 2012 and 2016, contributes to the existing literature. Third, we manually collect the data of main businesses from the publicly-disclosed financial statements, and subdivide the automotive industry into the traditional vehicle industry and the NEV industry, the results showing that the characteristics of the whole industry and the sub-industries changed with the development of the industry.
With the rapid development of NEV industry, NEV is likely to be the mainstream and gain more and more profit in the automotive market. Additionally, the development of NEVs will contribute to the reduction of carbon emissions. Further research may include the estimated carbon emission reduction of the automobiles produced by a firm as an output, so the green efficiency of the automotive firm can be measured.
References
- China Association of Automobile Manufactures (CAAM). In 2016, the growth rate of automobile productions and sales increased month by month. China Inf. 2017, 220, 7.
- Zhang, L. China’s dependence on foreign oil rose to 65.4 percent. China Energy News 2017, 327, 14.
- Chen, W.C.; Ji, Z.; Xiao, H.; Wang, H.L. Analysis of motor vehicle ownership in China. Environ. Prot. 2017, 45, 33–34.
- Du, X.Y. Annual report on the environmental management of China motor vehicles (2017) released by Ministry of Environmental Protection of the People’s Republic of China. China Environ. News 2017, 605, 3.
- The Energy-Saving and New Energy Automobile Industry Development Plan 2012–2020. Available online: http://www.miit.gov.cn/n1146295/n1146557/n1146619/c3072778/content.html (accessed on 25 October 2017).
- Xi Jinping: Technical Innovation Is the Pillar in Improving a Country’s Strength. Available online: http://www.fmprc.gov.cn/ce/cepl/chn/xwdt/t1159354.htm (accessed on 20 October 2017).
- Li Keqiang Encouraged Chinese Automotive Firms to Build up Global Brands. Available online: http://www.gov.cn/premier/2017-11/25/content_5242119.htm (accessed on 25 October 2017).
- Ren, M.J. More and more firms plan to the R&D of NEV industry. China Secur. J. 2015, 620, 4.
- Zhang, M. SAIC raised 15 billion for NEV. Secur. Daily 2015, 1106, A04.
- The NEV Ownership Exceeded One Million, Which Is the Equivalent of Fifty Percent of World NEV Ownership. Available online: http://tech.sina.com.cn/it/2017-06-07/doc-ifyfuzmy2391022.shtml (accessed on 20 October 2017).
- The Warm Prompt of Automotive Quota. Available online: https://www.bjhjyd.gov.cn/jggb/2017129/1512778813449_1.html (accessed on 9 December 2017).
- Four Ministries and Commissions Convened the Meeting to Discuss the Demonstration, Promotion and Pilot Schemes of the NEV in Beijing. Available online: http://www.gov.cn/gzdt/2009-02/17/content_1234290.htm (accessed on 20 October 2017).
- The Policy that Personal Purchase Subsidy over Tens of Thousands Are Being Discussed. Available online: http://news.china.com/zh_cn/news100/11038989/20100309/15845559.html (accessed on 20 October 2017).
- The Year 2014 Will Be the First Year of New Energy Vehicle Consumption. Available online: http://www.chinanews.com/auto/2014/04-22/6092133.shtml (accessed on 20 October 2017).
- The Big Change Era of NEV Is Coming. Available online: http://finance.qq.com/a/20171105/006762.htm (accessed on 20 October 2017).
- He, J. Financial performance evaluation of listed vehicle firms based on principal analysis. Prod. Res. 2010, 1, 145–146.
- Jia, Y.Z. Performance evaluate of China car manufacturing firms. Commun. Financ. Account. 2011, 23, 26–28.
- Song, J.Y. Applying factor analysis in China listed vehicle firms. Ind. Tech. Econ. 2008, 5, 147–151.
- Liu, K.Y. Empirical evaluation of China listed vehicle industry. Auto Ind. Res. 2011, 7, 7–11.
- Dou, X. The overall performance of China new energy car. Res. Financ. Account. 2012, 23, 51–54.
- You, Y. Operating performance evaluation of listed car manufacturing firms. Commun. Financ. Account. 2013, 35, 23–26.
- Song, G.H.; Li, B. Operating performance of listed parts manufacturer companies. Friends Account. 2015, 2, 79–83.
- Lee, P.; Park, Y.J. Eco-efficiency evaluation considering environmental stringency. Sustainability 2017, 9, 661.
- Wei, Q.L. Data envelopment analysis (DEA). Sci. Bull. 2000, 17, 1793–1808.
- González, E.; Cárcaba, A.; Ventura, J. How car dealers adjust prices to reach the product efficiency frontier in the Spanish automobile market. Omega 2015, 51, 38–48.
- Voltes-Dorta, A.; Perdiguero, J.; Jiménez, J.L. Are car manufacturers on the way to reduce CO2 emissions: A DEA approach? Energy Econ. 2013, 38, 77–86. [Green Version]
- Choi, H.; Oh, I. Analysis of product efficiency of hybrid vehicles and promotion policies. Energy Policy 2010, 38, 2262–2271.
- Jiang, B.; Zhang, C.Q. Data envelopment analysis and empirical research on technical progress of firms. Syst. Eng. Theory Pract. 2002, 7, 65–70.
- Tan, Z.G. DEA-based investment effectiveness of vehicle industry. Ind. Eng. Manag. 2004, 6, 107–112.
- Liu, X.; Wu, H.H. DEA model analysis of the operating efficiency of listed vehicle firms. J. Liaoning Tech. Univ. Soc. Sci. Ed. 2007, 3, 264–266.
- Huang, Y.L. Performance evaluation of listed vehicle firms. Econ. Prob. 2009, 11, 60–64.
- Wang, W.Q.; Liu, L.L.; Wu, W.L.; Sun, D.W. An empirical study on the relationship between scale-efficient and operating efficiency of China’s automobile industry. Ind. Eng. Manag. 2012, 17, 59–65.
- Zhou, A.; Liu, J.L. The recent exploration of the influence of NEV on energy conservation and emission reduction. Acad. Exch. 2012, 7, 101–105.
- Le, T.N.; Wang, C.N. The integrated approach for sustainable performance evaluation in value chain of Vietnam textile and apparel industry. Sustainability 2017, 9, 477.
- Gonzalez, E.D.; Sarkis, J.; Huisingh, D.; Huatuco, L.H.; Maculan, N.; Montoya-Torres, J.R.; de Almeida, C.M. Making real progress toward more sustainable societies using decision support models and tools. J. Clean. Prod. 2015, 105, 1–13.


