 +1 credit
| Version | Summary | Created by | Modification | Content Size | Created at | Operation |
|---|---|---|---|---|---|---|
| 1 | Masakatsu Tsurusaki | + 1528 word(s) | 1528 | 2021-01-25 10:05:28 | | | |
| 2 | Vivi Li | Meta information modification | 1528 | 2021-02-04 04:26:52 | | | | |
| 3 | Conner Chen | Meta information modification | 1528 | 2021-10-12 05:35:34 | | |
Video Upload Options
Dual-energy computed tomography (DECT) is an imaging technique based on data acquisition at two different energy settings. Recent advances in CT have allowed data acquisitions and simultaneous analyses of X-rays at two energy levels, and have resulted in novel developments in the field of abdominal imaging. The use of low and high X-ray tube voltages in DECT provide fused images that improve the detection of liver tumors owing to the higher contrast-to-noise ratio (CNR) of the tumor compared with the liver. The use of contrast agents in CT scanning improves image quality by enhancing the CNR and signal-to-noise ratio while reducing beam-hardening artifacts. DECT can improve detection and characterization of hepatic abnormalities, including mass lesions. The technique can also be used for the diagnosis of steatosis and iron overload.
1. Introduction
Computed tomography (CT) is one of the most important diagnostic imaging modalities for the liver. Technical advances such as faster scan times, thinner slices, multiplanar reformatting, and three-dimensional (3D) rendering have revolutionized the utility of CT. DECT is an exciting recent development that promises to increase the modality’s potential [1][2]. This improvement derives from the exploitation of the energy-dependent attenuation of X-rays at two different energies, hence, justifying the term dual energy. Conventional X-ray CT produces images based on the detection of the energy-dependent attenuation of X-rays as they pass through scanned objects. DECT extends this core concept based on the use of X-rays generated at two different energies. This resolves X-ray attenuation ambiguities and therefore allows for superior material discrimination and characterization. DECT refers to the acquisition of CT datasets at two different energy spectra. Paramount among the challenges of early DECT systems was the fact that the dual-energy data had to be obtained with two separate scans that resulted in multiple complications, such as the misregistration of the two datasets [3][4][5][6][7][8]. The technical advancements in software and hardware ion mid- to late 2000s allowed the simultaneous generation and acquisition of spectral X-rays. The recent development of dual-energy scanning increased the diagnostic value and clinical applications of CT and made DECT feasible for routine clinical use.
2. Evaluation of Hepatic Steatosis Using DECT
Conventionally available methods include MR spectroscopy (MRS), the dual-echo MRI method, CT measurements, and visual evaluation via ultrasonic tests. Among these, MRS (magnetic resonance spectroscopy) has yielded the highest fat content [9]. Conversely, new quantitative methods have been developed for ultrasound tests, MRI, and CT. According to a meta-analysis [10], the detectability of moderate/severe (20–30%) fatty liver using B-mode ultrasound-based qualitative assessment had a sensitivity of 84.8% (95% CI: 79.5 to 88.9) and a specificity of 93.6% (87.2 to 97.0). Chemical shift imaging is said to improve quantitativeness by correcting the influence of T1 value, T2* attenuation, variation in precession frequency of fat protons, etc. [11][12]. A few studies have measured the amount of fat obtained through T1-independent, T2*-corrected chemical shift imaging with multi-peak fat spectral modeling relative to the MRS-proton density fat fraction (MRS-PDFF) measured using MRS, as MRI-PDFF [12]. Although it is recognized that the MR test is the most accurate for fat determination among each of the imaging modalities, there are variations in the method and it is difficult to construct coherent evidence at the present time [13]. As fibrosis occurs due to hepatic injury, the amount of fat decreases; thus, low fat quantity detected on imaging does not guarantee a milder case and this is applicable for not only MRI, but also CT and ultrasound tests. In CT, the semiquantitative evaluation using X-ray absorption values (HUs) has been extensively known. Although it is convenient to conduct these evaluations based on the CT value of the liver parenchyma, the CT value may not necessarily be consistent among various CT scanners. Therefore, the evaluation with the use of a ratio or difference in CT values between liver and spleen should be preferred. Park et al. [14] argued that the difference in liver to spleen CT values in conventional CT had a reference range between 1–18 HU in nonfatty livers, where 1 HU (or less) is indicative of a fatty liver. A few recent reports have suggested that with DECT imaging—that is becoming widespread in recent years—it is possible to quantify the amount of liver fat in contrast CT based on material decomposition that helps distinguish two or more substances [15][16][17][18][19] (Figure 6).
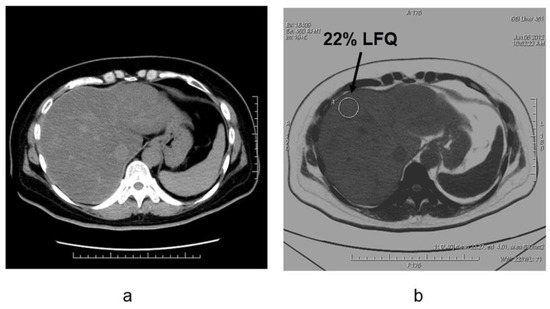
Figure 6. Liver fat measurements by using dual-energy CT in the patient with NAFLD (non-alcoholic fatty liver disease)(a) Noncontrast CT image and (b) fat density image in patients with nonalcoholic fatty liver disease. The degree of fat deposition was quantifiable on the fat density images, and the quantitative assessment of liver tissue and fat in this case was 22% liver-fat quantification.
Hyodo et al. reported that the area under the receiver operating characteristic (ROC) curve of DECT was 0.88 (95% confidence interval 0.74–0.98) in the detection of fatty liver with more than 5% fat in needle biopsy tissue. This was equivalent to MRS (area under the ROC curve 0.89) (95% confidence interval 0.724–1) [15]. This study also suggested that high-precision fat quantification is possible in postcontrast images. Hyodo et al. also reported that fat was underestimated by the presence of iron deposited in the liver parenchyma [16], while the phantom study conducted by Fishcer et al. showed that accurate fat quantitation was possible even in the presence of iron [17].
Evaluation of active inflammation in addition to fat is crucial for the early diagnosis and staging of NASH. Because it is difficult to evaluate inflammation with imaging studies with CT alone, the future challenge will involve accurate assessments in conjunction with other examinations.
3. Estimation of Hepatic Fibrosis Using DECT
Given the degree of hepatic fibrosis correlates with carcinogenesis and prognosis, accurate evaluation is important in determining the clinical course and in predicting the prognosis. Non-invasive diagnosis and staging of hepatic fibrosis are important for evaluating disease progression in patients with chronic liver diseases. Serum markers of liver fibrosis are widely available, but their results are variable. Ultrasound elastography is used for grading hepatic fibrosis, but it is operator dependent [20][21][22]. Several magnetic resonance (MR) imaging sequences, such as perfusion-weighted MR imaging, MR spectroscopy, MR elastography, and dynamic contrast-enhanced MR have the potential to provide quantitative information with variable diagnostic accuracy in the staging of liver fibrosis. DWI provides noninvasive quantification of water diffusion and can be used for in vivo quantification of the combined effects of capillary perfusion and diffusion. There are limited data on correlation between ADC and degree of fibrosis and other histopathological findings (inflammation, steatosis, iron content, necrosis, cholestasis) in the liver [23]. Besheer et al. reported that the ADC value was decreased from controls (F0) to patients with early fibrosis and those with late fibrosis. Combined ADC and miR-200b revealed the best result for differentiating early from late fibrosis and offer an alternative surrogate non-invasive diagnostic tool for diagnosis and staging of hepatic fibrosis in patients with chronic hepatitis C [24].
There are insufficient differences in the mass attenuation coefficients between fibrous and normal liver tissue, and it is difficult to quantify hepatic fibrosis by SECT. However, it is possible to indirectly estimate the degree of fibrosis with contrast media as a marker. When fibrosis occurs in liver tissue, deposition of collagen fibers expands the extracellular space. Histologically, the degree of hepatic fibrosis is strongly correlated with the volume of the extracellular space (ECV), and the quantification of ECV can be used to estimate the degree of hepatic fibrosis [25]. The equilibrium phase of contrast-enhanced CT is used for the determination of ECV in liver tissue. Given that the administered contrast medium diffuses from the intravascular space into the extravascular space and equilibrates over time, the concentration of contrast medium in the intravascular and extravascular spaces is considered to be equal during the equilibrium phase of contrast-enhanced CT. Therefore, by normalizing the contrast enhancement in the liver parenchyma in the equilibrium phase by the contrast enhancement in the blood pool, such as in the aorta, the percentage of ECV fraction in the liver tissue (ECV fraction) can be measured, and the ECV fraction can thus be calculated using the formula: (enhancement in the liver)/(enhancement in the aorta) × (1 − hematocrit).
In SECT, the difference between pre- and postcontrast CT values is used to quantify the ECV fraction or to estimate hepatic fibrosis. The time from the injection of contrast medium to the imaging of the equilibrium phase varied between 3 and 30 min [26][27][28][29]. Yoon et al. and Guo et al. reported that the ECV fraction calculated using the equilibrium phase 3 min after contrast was significantly correlated with the METAVIR score (correlation coefficient ρ = 0.493 and ρ = 0.468, respectively) [28][29]. In addition, the ECV fraction calculated using nonlinear nonrigid alignment (SURE subtraction) from the equilibrium phase 4 min after contrast enhancement, and the pre-contrast images, showed a strong correlation with the METAVIR score (ρ = 0.71) [30]. In DECT, a more quantitative ECV fraction can be estimated based on the use of the difference in iodine density between pre- and postcontrast images. Sofue et al. reported that the ECV fraction measured using iodine density images in the equilibrium phase 3 min after contrast was significantly correlated with the METAVIR score (ρ = 0.67) [31]. The effect of hepatic active inflammation and edema on the quantitation of ECV is also unclear. These verifications and further improvements in the quantitative accuracy seem to be future problems.
References
- Flohr, T.G.; McCollough, C.H.; Bruder, H.; Petersilka, M.; Gruber, K.; Süss, C.; Grasruck, M.; Stierstorfer, K.; Krauss, B.; Raupach, R.; et al. First performance evaluation of a dual-source CT (DSCT) system. Eur. Radiol. 2006, 16, 256–268.
- Schmidt, B.; McCollough, C. Dual-energy computed tomography. In Computed Tomography of the Cardiovascular System; Gerber, T.C., Kantor, B., Williamson, E.E., Eds.; Informa Healthcare: London, UK, 2007; pp. 451–462.
- Roos, B.O. Dual photon absorptiometry in lumbar vertebrae: One theory and method. Acta. Radiol. Ther. Phys. Biol. 1974, 13, 266–280.
- Barnes, G.T.; Sones, R.A.; Tesic, M.M.; Morgan, D.R.; Sanders, J.N. Detector for Dual-Energy Digital Radiography. Radiology 1985, 156, 537–540.
- Hickey, N.M.; Niklason, L.T.; Sabbagh, E.; Fraser, R.G.; Barnes, G.T. Dual-Energy Digital Radiographic Quantification of Calcium in Simulated Pulmonary Nodules Radiology. Am. J. Reontgenol. 1987, 148, 19–24.
- Friedman, S.E.; Dubovsky, E.V.; Dubovsky, J.; Alexander, C.B.; Robinson, C.A.; Sabbagh, E.A.; Barnes, G.T.; Fraser, R.G. Mineral Content of Bone Measurement by Energy Subtraction Digital Chest Radiography. Am. J. Reontgenol. 1987, 149, 1119–1202.
- Sartoris, D.J.; Resnick, D. Dual-Energy Radiographic Absorptiometry for Bone Densitometry; Current Status and Perspective. Am. J. Reontgenol. 1989, 152, 241–246.
- Gundry, C.R.; Miller, C.W.; Ramos, E.; Moscona, A.; Stein, J.A.; Mazess, R.B.; Sartoris, D.J.; Resnick, D. Dual-Energy Radiographic Absorptiometry of the Lumbar Spine: Clinical Experience with Two Different Systems. Radiology 1990, 174, 539–541.
- Mahmood, U.; Horvat, N.; Horvat, J.V.; Ryan, D.; Gao, Y.; Carollo, G.; DeOcampo, R.; Do, R.K.; Katz, S.; Gerst, S.; et al. Rapid switching kVp dual energy CT: Value of reconstructed dual energy CT images and organ dose assessment in multiphasic liver CT exams. Eur. J. Radiol. 2018, 102, 102–108.
- Bohte, A.E.; van Werven, J.R.; Bipat, S.; Stoker, J. The diagnostic accuracy of US, CT, MRI and 1H-MRS for the evaluation of hepatic steatosis compared with liver biopsy: A meta-analysis. Eur. Radiol. 2011, 21, 87–97.
- Hernaez, R.; Lazo, M.; Bonekamp, S.; Kamel, I.; Brancati, F.L.; Guallar, E.; Clark, J.M. Diagnostic accuracy and reliability of ultrasonography for the detection of fatty liver: A meta-analysis. Hepatology 2011, 54, 1082–1090.
- Kühn, J.P.; Hernando, D.; Mensel, B.; Krüger, P.C.; Ittermann, T.; Mayerle, J.; Hosten, N.; Reeder, S.B. Quantitative chemical shift-encoded MRI is an accurate method to quantify hepatic steatosis. J. Magn. Reson. Imaging 2014, 39, 1494–1501.
- Kühn, J.P.; Hernando, D.; Muñoz del Rio, A.; Evert, M.; Kannengiesser, S.; Völzke, H.; Mensel, B.; Puls, R.; Hosten, N.; Reeder, S.B. Effect of multipeak spectral modeling of fat for liver iron and fat quantification: Correlation of biopsy with MR imaging results. Radiology 2012, 265, 133–142.
- Awai, H.I.; Newton, K.P.; Sirlin, C.B.; Behling, C.; Schwimmer, J.B. Evidence and recommendations for imaging liver fat in children, based on systematic review. Clin. Gastroenterol. Hepatol. 2014, 12, 765–773.
- Park, Y.S.; Park, S.H.; Lee, S.S.; Kim, D.Y.; Shin, Y.M.; Lee, W.; Lee, S.G.; Yu, E.S. Biopsy-proven nonsteatotic liver in adults: Estimation of reference range for difference in attenuation between the liver and the spleen at nonenhanced CT. Radiology 2011, 258, 760–766.
- Hyodo, T.; Yada, N.; Hori, M.; Maenishi, O.; Lamb, P.; Sasaki, K.; Onoda, M.; Kudo, M.; Mochizuki, T.; Murakami, T. Multimaterial Decomposition Algorithm for the Quantification of Liver Fat Content by Using Fast-Kilovolt-Peak Switching Dual-Energy CT: Clinical Evaluation. Radiology 2017, 283, 108–118.
- Hyodo, T.; Hori, M.; Lamb, P.; Sasaki, K.; Wakayama, T.; Chiba, Y.; Mochizuki, T.; Murakami, T. Multimaterial Decomposition Algorithm for the Quantification of Liver Fat Content by Using Fast-Kilovolt-Peak Switching Dual-Energy CT: Experimental Validation. Radiology 2017, 282, 381–389.
- Fischer, M.A.; Gnannt, R.; Raptis, D.; Reiner, C.S.; Clavien, P.A.; Schmidt, B.; Leschka, S.; Alkadhi, H.; Goetti, R. Quantification of liver fat in the presence of iron and iodine: An ex-vivo dual-energy CT study. Investig. Radiol. 2011, 46, 351–358.
- Hur, B.Y.; Lee, J.M.; Hyunsik, W.; Lee, K.B.; Joo, I.; Han, J.K.; Choi, B.I. Quantification of the fat fraction in the liver using dual-energy computed tomography and multimaterial decomposition. J. Comput. Assist Tomogr. 2014, 38, 845–852.
- Mendonca, P.R.; Lamb, P.; Sahani, D.V. A Flexible Method for Multi-Material Decomposition of Dual-Energy CT Images. IEEE Trans. Med. Imaging 2014, 33, 99–116.
- Horowitz, J.M.; Venkatesh, S.K.; Ehman, R.L.; Jhaveri, K.; Kamath, P.; Ohliger, M.A.; Samir, A.E.; Silva, A.C.; Taouli, B.; Torbenson, M.S.; et al. Evaluation of hepatic fibrosis: A review from the society of abdominal radiology disease focus panel. Abdom. Radiol. 2017, 42, 2037–2053.
- Barr, R.G. Shear wave liver elastography. Abdom. Radiol. 2018, 43, 800–807.
- Kennedy, P.; Wagner, M.; Castéra, L.; Hong, C.W.; Johnson, C.L.; Sirlin, C.B.; Taouli, B. Quantitative Elastography Methods in Liver Disease: Current Evidence and Future Directions. Radiology 2018, 286, 738–763.
- Razek, A.A.; Khashaba, M.; Abdalla, A.; Bayomy, M.; Barakat, T. Apparent diffusion coefficient value of hepatic fibrosis and inflammation in children with chronic hepatitis. Radiol. Med. 2014, 119, 903–909.
- Besheer, T.; Elalfy, H.; Abd El-Maksoud, M.; Abd El-Razek, A.; Taman, S.; Zalata, K.; Elkashef, W.; Zaghloul, H.; Elshahawy, H.; Raafat, D.; et al. Diffusion-weighted magnetic resonance imaging and micro-RNA in the diagnosis of hepatic fibrosis in chronic hepatitis C virus. World J. Gastroenterol. 2019, 25, 1366–1377.
- Varenika, V.; Fu, Y.; Maher, J.J.; Gao, D.; Kakar, S.; Cabarrus, M.C.; Yeh, B.M. Hepatic fibrosis: Evaluation with semiquantitative contrast-enhanced CT. Radiology 2013, 266, 151–158.
- Zissen, M.H.; Wang, Z.J.; Yee, J.; Aslam, R.; Monto, A.; Yeh, B.M. Contrast-enhanced CT quantification of the hepatic fractional extracellular space: Correlation with diffuse liver disease severity. Am. J. Reontgenol. 2013, 201, 1204–1210.
- Bandula, S.; Punwani, S.; Rosenberg, W.M.; Jalan, R.; Hall, A.R.; Dhillon, A.; Moon, J.C.; Taylor, S.A. Equilibrium contrast-enhanced CT imaging to evaluate hepatic fibrosis: Initial validation by comparison with histopathologic sampling. Radiology 2015, 275, 136–143.
- Yoon, J.H.; Lee, J.M.; Klotz, E.; Jeon, J.H.; Lee, K.B.; Han, J.K.; Choi, B.I. Estimation of hepatic extracellular volume fraction using multiphasic liver computed tomography for hepatic fibrosis grading. Investig. Radiol. 2015, 50, 290–296.
- Guo, S.L.; Su, L.N.; Zhai, Y.N.; Chirume, W.M.; Lei, J.Q.; Zhang, H.; Yang, L.; Shen, X.P.; Wen, X.X.; Guo, Y.M. The clinical value of hepatic extracellular volume fraction using routine multiphasic contrast-enhanced liver CT for staging liver fibrosis. Clin. Radiol. 2017, 72, 242–246.
- Shinagawa, Y.; Sakamoto, K.; Sato, K.; Ito, E.; Urakawa, H.; Yoshimitsu, K. Usefulness of new subtraction algorithm in estimating degree of liver fibrosis by calculating extracellular volume fraction obtained from routine liver CT protocol equilibrium phase data: Preliminary experience. Eur. J. Radiol. 2018, 103, 99–104.


