 +1 credit
| Version | Summary | Created by | Modification | Content Size | Created at | Operation |
|---|---|---|---|---|---|---|
| 1 | Fuyuki Ito | + 4257 word(s) | 4257 | 2020-11-04 04:27:33 | | | |
| 2 | Bruce Ren | Meta information modification | 4257 | 2020-11-11 03:41:52 | | |
Video Upload Options
We have used the fluorescence detection of phase transformation dynamics of organic compounds by photochemical methods to observe a real-time symmetry breaking process. The organic fluorescent molecules vary the fluorescence spectra depending on molecular aggregated states, implying fluorescence spectroscopy can be applied to probe the evolution of the molecular-assembling process. As an example, the amorphous-to-crystal phase transformation and crystallization with symmetry breaking at droplet during the solvent evaporation of mechanofluorochromic molecules are represented in this review.
1. Introduction
The phenomena of phase transformation with structural changes are important as both basic findings and applications for materials science. Studies have been focused on thermodynamics for the macroscopic phase or phase transition dynamics based on computer simulations. Based on the molecular science of chemistry, various phase transformation dynamics are needed to understand the variety depending on the molecular individuality and to develop smart materials. We have been utilizing fluorescence spectroscopy to clarify phase transformation dynamics of organic fluorescent molecules, which relies on the molecular aggregated state. Therefore, fluorescence spectroscopy can be applied to probe the process of molecular assembly. As an example, Yu et al. [1] demonstrated the fluorescence visualization of an amorphous-to-crystalline transformation in situ microscopic observation of the crystallization of molecules in microparticles through fluorescence color changes. Heterogeneous crystallization of amorphous microparticles was clearly observed by this method. This study can provide a picture based on real-time detection of the crystallization kinetics that occur spontaneously by external stimuli, such as mechanochromic behavior and solid–solid transitions.
Based on this research report on the phase transition phenomenon evaluation by fluorescence detection, we utilized mechanofluorochromic molecules to evaluate the transition state dynamics during the amorphous-to-crystal phase transition process. In addition, by utilizing this knowledge, we have started research on the solvent evaporative crystallization process of organic fluorescent molecules, which will be reviewed.
2. Thermodynamic Evaluation of Amorphous-to-Crystal Phase Transformation Process by Fluorescence Spectral Changes
A number of molecules have been reported that exhibit emission color changes due to the mechanical stimulation of organic solids, namely mechanofluorochromism effects, over the past decade. [2][3] Mechanochromic phenomena are generally based on the electronic state modulation caused by the change of the intermolecular interaction due to the change of the intermolecular distance by the mechanical stimulation of the solid. In particular, the fluorescence color changes are ascribed to the amorphous-to-crystal phase transformation. The dibenzoylmethane boron difluoride complex (BF2DBM) exhibits a fluorescence spectral change by smearing in the solid state, depending on its concentration of the doped in the polymer films [4][5][6][7]. Fraser et al. first reported the reversible mechanofluorochromic behavior of the 4-tert-butyl-4′-methoxydibenzoylmethane (trade name: avobenzone) boron difluoride complex solid based on the amorphous-to-crystal phase transformation [8]. The emission color significantly shifts to the longer wavelength (red) region upon smearing the samples. The samples then spontaneously return back to the original fluorescence with the elapse of time under ambient temperature. In this section, we review the quantitative evaluation of the thermodynamic parameters for a thermally backward reaction after smearing to probe the fluorescence change.
The molecular structures of BF2DBM derivatives are shown in Figure 1. These compounds were synthesized according to a previous report [8]. The sample used for mechanochromic studies was prepared by dropping a 2.0 × 10⁻³ mol∙dm−3 dichloromethane solution onto a paraffin-coated weighing paper with a pipette, and then the solvent-evaporated BF2DBM derivatives on the weighing papers were rubbed with a spatula to apply a mechanical perturbation. The fluorescence spectra and their spectral changes were monitored on a Shimadzu RF-5300PC fluorescence spectrophotometer. The temperature controller was home-made and was combined with a rubber heater (Hakko Co. Ltd., Nagano, Japan) and a digital temperature controller (Omron E5CN-QT).
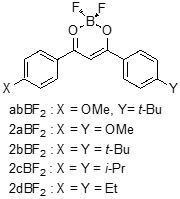
Figure 1. Molecular structures of BF2DBM derivatives.
Figure 2 shows fluorescence spectra of powder abBF2 on weighing paper at 303 K, the spectra of which were normalized at the maximum value. The fluorescence of abBF2 showed a blue emission and the peak was located at 460 nm. The fluorescence spectrum originated from a dendric solid as previously reported [8]. A new fluorescence band built up around 500 nm with a shoulder at 550 nm after smearing with a spatula, suggesting the generation of the amorphous phase of abBF2 [8]. The intensity around 550 nm was increased with increasing smearing time and applied force [9]. With the elapse of time, the intensity over 530 nm was decreased. After 1030 min, the emissive color appeared green under the UV lamp and the fluorescence peaks were around 460 nm and 500 nm. These observations indicated that the yellow fluorescent amorphous state was changed to green emission at room temperature, demonstrating that abBF2 has a mechanofluorochromic property due to the thermally backward reaction.
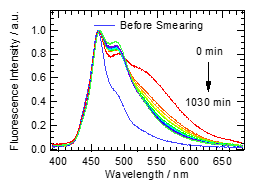
Figure 2. Fluorescence spectra of abBF2 excited with 370 nm at 303 K before and time evolution after the smearing.
In order to quantify the thermally backward reaction kinetics after smearing, we measured the intensity change of abBF2 fluorescence as a function of time. Figure 3 shows a kinetic trace of fluorescence intensity at 550 nm excited with 370 nm by temperature. The fluorescence intensity steeply decreased with elapsed time, obeying first-order kinetics with a double-exponential decay function. The rate constants were determined by least-squares fitting, assuming exponential decay of two components (faster (kF) and slower (kS)) based on first-order kinetics of the thermally backward reaction. Both rate constants increased with increasing temperature.
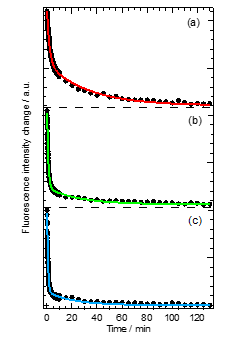
Figure 3. Changes in fluorescence intensity of abBF2 as a function of time after smearing at (a) 296 K, (b) 303 K, and (c) 313 K monitored at 550 nm. The best-fitting curves based on a double-exponential decay function are indicated by solid lines.
From the temperature dependence of the rate constant, the activation parameter of the amorphous–crystal phase transition of the BF2DBM derivatives can be determined [10]. First, the activation parameters of the reaction can be estimated by Arrhenius plots, which are based on the rate law of the reaction: k = Aexp(−Ea/RT) can be calculated and the activation parameters estimated, where A, Ea, R, and T are the pre-exponential factor, activation energy, gas constant, and temperature, respectively. Figure 4a is the Arrhenius plot of rate constants of abBF2, with the line determined by least-squares fitting. The activation energies of enthalpy (ΔH‡) and entropy (ΔS‡) for the thermally backward reaction of abBF2 were also evaluated by the Eyring plot as shown in Figure 4b, the equation of which is k = (kBT/h)exp(ΔS‡/R)exp(−ΔH‡/RT), where kB is the Boltzmann constant. The calculated results are listed in Table 1. The thermodynamic parameters relate to the thermally backward reaction of abBF2 originating from the amorphous–crystal phase transformation.
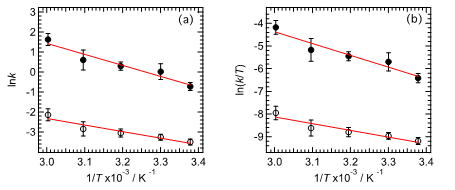
Figure 4. Arrhenius (a) and Eyring (b) plots for thermally backward reaction for abBF2 as a function of temperature (T). The rate constants (k) values for faster (kF) and slower (kS) components are indicated by closed and open circles.
Table 1. Thermodynamic parameters of BF2DBM derivatives at the transition state. A, Ea, ΔH‡, and ΔS‡ are the pre-exponential factor, activation energy, activation energies of enthalpy, and activation energies of entropy, respectively.
|
|
Component |
Ea/kJ×mol−1 |
A/s −1 |
ΔH‡/kJ×mol−1 |
ΔS‡/J×K−1×mol−1 |
|
abBF2 |
Faster |
45.8 |
1.05 ´ 106 |
43.2 |
−104 |
|
|
Slower |
27.2 |
3.00 ´ 101 |
24.6 |
−191 |
|
2aBF2 |
Faster |
44.1 |
2.36 ´ 105 |
41.6 |
−116 |
|
|
Slower |
33.6 |
2.82 ´ 102 |
31.1 |
−172 |
|
2bBF2 |
Faster |
23.1 |
2.65 ´ 101 |
20.5 |
−192 |
|
|
Slower |
33.6 |
2.70 ´ 10−1 |
14.5 |
−230 |
|
2cBF2 |
Faster |
25.8 |
3.44 ´ 101 |
23.2 |
−190 |
|
|
Slower |
23.5 |
8.62 ´ 10−1 |
21.9 |
−221 |
|
2dBF2 |
Faster |
21.6 |
2.06 ´ 101 |
19.0 |
−194 |
|
|
Slower |
23.5 |
7.37 ´ 100 |
20.9 |
−203 |
Next, thermodynamic parameters for the substituent effects were investigated. Based on the Ea values for kF, the backward reaction for BF2DBM derivatives could be classified into two categories: category a (abBF2 and 2aBF2), and category b (2bBF2, 2cBF2, and 2dBF2). The kF values for category a compounds are larger than those of category b. These results suggest that the methoxy group, which is a common substituent in category a, influences the thermally backward reaction. The pre-exponential factor (A values) of kF is much larger than that of kS, suggesting that the reaction frequency of kS is small. Therefore, only the kF values will be discussed here. The estimated activation energies of entropy ΔS‡ values are negative, therefore suggesting that the order of the transition state (activated) complex is higher than that of the amorphous state just after mechanical perturbation. The thermodynamic parameters are derived from the phase transition from amorphous to crystalline with symmetry breaking by the thermally backward reaction, which is described below. Transition state formation is influenced by any substituent and controls activation energies of enthalpy (ΔH‡) and ΔS‡. The ΔH‡ values for kF (ΔHF‡) and activation energy (Ea) are similar to category a species. These values are then found to be twice those estimated from category b. All ΔH‡ values are greater than the energy from van der Waals interactions (generally 1 kJ×mol−1), and comparable to hydrogen bond interactions (about 17–63 kJ×mol−1). It is indicated that hydrogen-bonding is dominant for intermolecular interactions to form transition states (activated complex) [11]. These estimates indicate that the existence of a methoxy group in category a correlates with the ΔHF‡ values, which is likely to correspond to the excess energy produced by the cleavage of the C(arene)–H···O(methoxy) bond [12]. The S‡ values for kF (ΔS‡F) of categories a and b are about −110 J×K−1×mol−1 and −190 J×K−1×mol−1, respectively, suggesting that the activation complexes of category b are a higher barrier than in category a. The Gibbs energy barriers (ΔG‡) of BF2DBM at 303 K were within the range of 74.8–80.8 kJ×mol−1. Although similar for all BF2DBM series reported here in this study, ΔH‡ and ΔS‡ around room temperature depended strongly on the substituents. Furthermore, there is no significant effect on of ΔH‡ on ΔG‡ in the room temperature range. According to these findings, the important driving force of the activation complex formation is not only ΔH‡ but also ΔS‡, therefore we concluded that the substituents exert entropic control in the solid-phase reaction because of the excess energy from the breakage of the C(arene)–H⋯O(methoxy) bond in category a [12]. Therefore, we propose that the substituent-dependent change in ΔS‡ is also common to the mechanofluorochromic behavior of BF2DBM derivatives based on the amorphous–crystalline phase transition and it is one of the important parameters in molecular design.
Next, we acquired differential scanning calorimetry (DSC) curves to clarify the thermodynamic parameters for the crystallization process. The melting points (Tm) estimated from endothermic peaks of 2aBF2, 2bBF2, 2cBF2, and 2dBF2 are 508 K, 545 K, 486 K, and 477 K, respectively. Exothermic peaks correspond to the crystallization temperature (Tc) as listed in Table 2 We estimated the enthalpy (ΔHc) and entropy (ΔSc) of crystallization by using ΔHc = TΔSc from the peak area of the DSC curves. The ΔHc value is related to intermolecular interactions. In order to evaluate the intermolecular interaction, we compared the existence of short contact regions smaller than the sum of van der Waals radii of neighboring molecules from the results of X-ray structure analysis of BF2DBM crystals [13][14][15]. Difluoride interacts with two phenyl rings of other molecules. Short contact with the boron difluoride coordinate does not only occur with the two phenyl rings, but also with the methoxy group in the case of abBF2 and 2aBF2. Notably, ΔSc is strongly affected by the intermolecular interaction with the methoxy group; we concluded this interaction priority promotes crystal reformation and enables it to contribute to rotational motion around the C−O group in addition to the C(arene)−H···F interaction [16]. Sket et al. reported that a BF2DBM derivative with a methoxy group has two crystal polymorphisms because the rotational energy of the C−O bond of the methoxy group is a relatively low energy barrier [17]. The degree of freedom of molecular motion of the BF2DBM derivative is enhanced by the methoxy group, suggesting that the entropy values become large. The intermolecular interaction, depending on the substituents, is consistent with thermodynamic parameters. External stimuli may promote the entropic term and the activation of rotational motion around the C−O bonds will enable control of the crystal formation process.
Table 2. Thermodynamic parameters concerning the crystallization. Tc, ΔHc, and ΔSc are crystallization temperature, the enthalpy of crystallization, and entropy of crystallization, respectively
|
|
Tc/K |
ΔHc/kJ×mol−1 |
ΔSc/J×K−1×mol−1 |
|
abBF2 |
445 |
−33.8 |
−76.0 |
|
2aBF2 |
495 |
−33.5 |
−67.7 |
|
2bBF2 |
519 |
−25.8 |
−49.8 |
|
2cBF2 |
437 |
−13.6 |
−31.1 |
|
2dBF2 |
461 |
−11.6 |
−25.2 |
Crystallization Gibbs energy (ΔGc) of the BF2DBM derivative was then estimated by ΔGc = ΔHc − TΔSc. The ΔGc values at 303 K are −10.8, −13.0, −10.7, −4.2, and −4.0 kJ×mol−1 for abBF2, 2aBF2, 2bBF2, 2cBF2, and 2dBF2, respectively, and it can be placed in the following order: 2cBF2 ≈ 2dBF2 > 2bBF2 ≈ abBF2 ≈ 2aBF2. This order is different from the order of ΔHc and ΔSc. To discuss this order, the stacking properties of BF2DBM derivatives were compared . On the basis of X-ray crystallography, the overlap between adjacent molecules with plane–plane orientation in the crystal can be classified into two groups: the overlap between benzene (B) and dihydrodioxaborinine (D) rings (B-on-D overlap) or two benzene rings (B-on-B overlap), depending on the substituents . As shown in the inset of Figure 5, abBF2, 2aBF2, and 2bBF2 are packed in the B-on-D type, while those in 2cBF2 and 2dBF2 are packed in the B-on-B type in the crystal. These findings suggest that ΔGc depends on the molecular packing form in the crystal and is regulated by a balance between the ΔHc and ΔSc values. Higher degrees of overlap are proposed to result in stronger intermolecular interactions (π–π interaction), which enables us to interpret the fluorescence properties of BF2DBM derivatives in the solid state.
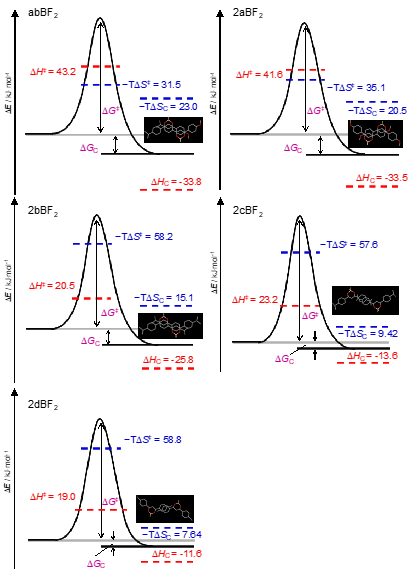
Figure 5. The reaction coordinate diagrams and thermodynamic parameters at 303 K of thermally backward reaction coordinates of BF2DBM derivatives and the molecular packing obtained by X-ray crystallography. ΔE,, ΔH‡, ΔS‡, ΔG‡, ΔHc, ΔSc, ΔGc and T are the energy of the system, activation energies of enthalpy, activation energies of entropy, Gibbs energy of the transition state, the enthalpy of crystallization, entropy of crystallization, and crystallization Gibbs energy, respectively
Based on these findings, Figure 5 presents a scheme of the reaction coordinates of the amorphous-to-crystal transformation of BF2DBM derivatives. These values of thermodynamic parameters are estimated at 303 K. Although the values of ΔG‡ were similar for all BF2DBM derivatives at 303 K, ΔH‡ and ΔS‡ differ depending on the substituents. We show that the substituents of the BF2DBM derivatives not only change the energy barrier of the system but also affect the rate of the thermally backward reaction by compensating between enthalpy and entropy terms. The formation of the transition state is governed by the entropy term associated with C(arene)–H⋯O(methoxy).
In summary, the thermodynamic parameters for the thermally backward reaction in the amorphous-to-crystal phase transformation of BF2DBM derivatives were strongly dependent on the substituents which affect not only the mode of molecular packing or stacking in the crystals, but also the thermodynamic parameters in the transition states. Thermodynamic studies based on the fluorescence changes will be significant to design organic molecules. We also think that the amorphous-to-crystal transformation correlates with the crystal growth process from the melt states.
3. Fluorescence Visualization of the Solvent Evaporative Crystallization Process via the Mutual State
Based on the findings from the amorphous-crystal phase transition observed by fluorescence change, we have probed the crystallization process from solution, particularly evaporative crystallization, which will be summarized in this section. We have utilized 2bBF2 (Figure 4a) solution for the fluorescence observation during solvent evaporation. The detection of the amorphous-like state before crystallization based on the fluorescence color change means that visualization of the two-step nucleation model can be achieved. Yu et al. recently reported that monitored amorphous-to-crystalline phase transition processes were observed in real-time based on fluorescence color changes.
The fluorescence images of 2bBF2 in dilute solution, crystalline and amorphous states is purple, blue and green-orange, respectively, which are shown in Figure 6b–d. The fluorescence spectra previously reported showed sharp peaks at 413 nm, 430 nm, and 460 nm, which are attributed to the vibrational structure of the monomer fluorescence. The emission of the crystal was observed at 445 nm and 470 nm, and in the amorphous state at around 550 nm. The two phases (crystal and amorphous) can be characterized by X-ray diffraction measurements, meaning that molecular forms and the aggregation states can be distinguished by the fluorescence color.
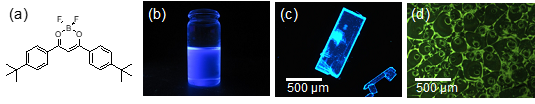
Figure 6. (a) Molecular structure of 2bBF2. Fluorescence images of 2bBF2 in (b) 1,2-dichloromethane, (c) crystalline state, and (d) amorphous state under 365 nm UV irradiation.
Next, we attempted to measure the fluorescence color and spectral changes during evaporative crystallization from solution. The observation of the molecular assembly state by fluorescence change can be used to identify liquid clusters proposed in the two-step nucleation mechanism. Figure 7a shows captured images from a video taken under UV irradiation during the solvent evaporation from 3.1 × 10⁻² mol·dm−3 2bBF2 in a 1,2-dichloroethane droplet. This video was uploaded in the supporting information of a previous report. The fluorescence color of the droplet is purple just after dropping. The emission color changes to orange from the edge of the droplet, and at about 32 s, the entire droplet turns orange. A doughnut-shaped droplet with orange emission formed with a decreasing purple emission region. When evaporation of the solvent was completed, the entire region turned to blue emission, and some of the region showed orange emission. This orange emission was not observed even in a highly concentrated solution of 2bBF2; it is exhibited only in a supersaturated droplet during the evaporation. We measured fluorescence spectral changes as a function of time as shown in Figure 7b. The fluorescence spectrum acquired just after dropping corresponds to the monomer emission. The peak around 550 nm monotonically increased with decreasing monomer peaks. Finally, the peaks at 445 nm and 470 nm appeared due to the crystalline state. The series of fluorescence spectral changes correspond to the fluorescence color change observed in the images taken under UV irradiation. Based on the fluorescence properties of 2bBF2, we can explain the molecular assembly by evaporative crystallization from solution. The crystal of 2bBF2 generated from solution by way of the amorphous-like state was found.
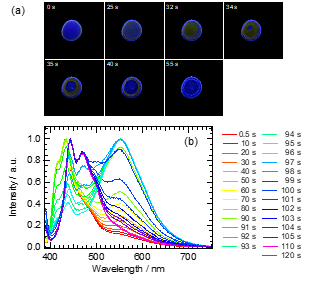
Figure 7. (a) Fluorescence images of 2bBF2 in 1,2-dichloroethane droplet (diameter is approximately 5 mm) during evaporation under 365 nm UV irradiation. (b) Fluorescence spectral changes of 2bBF2 during solvent evaporation.
In order to analyze the fluorescence change, we simulated the fluorescence spectra by non-linear least-squares fitting based on six Gaussians. Figure 8a shows the relative abundances by the spectral fitting as a function of time. The initial monomer fraction (0.9) monotonically decreased during the solvent evaporation, whereas the amorphous fraction was increased up to 95 s. The abundance was about 0.6 at 95 s, which then decreased dramatically. After 95 s, the fraction of the crystal suddenly increased with the decreasing amorphous state. It is indicated that the crystal can be formed from the isolated monomer state via the amorphous-like state, showing a hierarchical change such as a consecutive reaction. We have proposed the scheme of evaporative crystallization of molecular-assembling process, shown in Figure 8b.
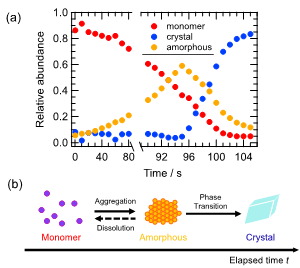
Figure 8. (a) Temporal changes in the relative abundance of monomers, amorphous-like, and crystalline states, which was calculated from fluorescence spectral analysis assuming six Gaussians. (b) Scheme of molecular assembly process based on fluorescence spectral changes.
According to the observation of fluorescence changes during the solvent evaporative crystallization of 2bBF2, it was confirmed that the fluorescence color changed from purple to blue via orange, corresponding to the formation of crystals from monomers through amorphous-like states in the crystallization process. These findings suggested that the amorphous-like state is transiently formed prior to the crystal formation. Observation of the amorphous-like aggregates in the mutual step suggests the existence of a mutual state prior to the crystallization existing in the supersaturated region during the solvent evaporation. In the present case, the orange emission from the amorphous-like species implies the presence of liquid-like clusters with highly-dense aggregates, which was proposed in the two-step nucleation model for the crystallization. The existence of the liquid-like cluster before nucleation is a key factor for the two-step nucleation model, which has been established based on NMR spectroscopy [18][19], electron microscopy [20], induction time of crystal formation [21], and non-photochemical laser-induced crystallization [22]. The relative abundance changes over time of the molecular form of 2bBF2 with solvent evaporation clearly reveal that the formation of the amorphous-like states works as a precursor to nucleation. We have verified that the fluorescence visualization during solvent evaporative crystallization agrees with the previously known two-step model for crystal formation [23][24]. In conclusion, we have achieved fluorescence visualization of the existence of the nucleation precursor (highly dense liquid-like cluster state) proposed by the two-step nucleation model.
4. Optical and Viscoelastic Properties of the Mutual State during the Phase Transformation
Many reports support the two-step nucleation model, in which the intermediate phase plays an important role in the crystal formation process[25][26]. Tsarfati et al. mentioned that the crystallization pathway involves three main steps. The three steps are i: initial densification from the solvent-rich precursor, ii: early ordering, and iii: concurrent evolution of order and morphology [27]. This finding implies that the liquid-like cluster state contains the solvent in the solution. However, it is not clear whether the orange emission of BF2DBM is in a state containing a solvent as a highly dense aggregate or in an amorphous state as a solid aggregate. Therefore, in order to clarify the state of orange emission as an intermediate phase before nucleation, we focused on the real-time change of optical and viscoelastic properties of the droplet during evaporation crystallization [28].
The fluorescence images and polarized optical images were simultaneously observed during the solvent evaporation with (upper side) and without (lower side) UV irradiation as shown in Figure 9. The droplet was put in the two polarizers arranged by the cross-Nicol condition. The upper images of the droplet correspond to the fluorescence color, which is purple just after the dropping. No transparency in the image without UV irradiation indicates that the crystalline region in the droplet of 2bBF2 solution is absent. The fluorescence color changed from purple to orange over time. After 60 s, birefringence was observed in the polarized optical image without UV irradiation. The texture in the image indicates the formation of a crystalline state. Compared with both images with and without UV irradiation, particularly at 85 s, no birefringence was observed in the orange emission region, suggesting the optically isotropic phase, which can be identical to the liquid-like cluster state, as an intermediate proposed in the two-step nucleation model.
We adapted the quartz crystal microbalance (QCM) in order to evaluate the mass and the viscoelastic changes based on the changes of the resonance frequency of quartz (Δf) and resistance (ΔR) from the adsorption onto the quartz substrate in real-time [29]. QCM was also adapted to the monitoring of the deposited film thickness in the vacuum deposition process. We attempted to use it to investigate the dynamic viscoelastic property changes for the evaporative crystallization of the 2bBF2 droplet. Figure 10a shows the results of the QCM measurement (Δf and ΔR changes) after the dropping of the 2bBF2 solution on the Au electrode as functions of time. As an overall tendency, the Δf and ΔR values changed in two steps during the evaporative crystallization. It is possible to identify the three main stages concerning the fluorescence changes of 2bBF2: purple to blue via orange emission.
We estimated the mass change (Δm) of the 2bBF2 droplet during the solvent evaporation on the Au electrode by the Sauerbrey equation [30]. Δm evolution during solvent evaporation is shown in Figure 10b. Just after dropping, Δm was 2 μg until 80 s, a value comparable with that for the 1,2-dichroloethane solvent only. Δm temporarily decreased to 7.3 μg and then reached 15 μg at 95 s from 80 to 86 s. The increase in Δm is ascribed to the adsorption and precipitation of 2bBF2 onto the Au electrode.
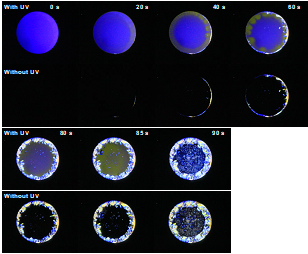
Figure 9. Images of the 2bBF2 in 1,2-dichroloethane droplet under the cross-Nicol condition with and without UV irradiation during the solvent evaporation. From [31]; reprinted with permission from the Chemical Society of Japan.
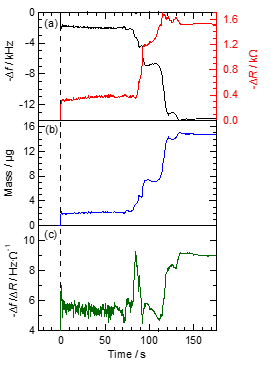
Figure 10. Time courses of (a) the resonance frequency of quartz (Δf) and resistance (ΔR) monitored by quartz crystal microbalance (QCM), (b) the mass change calculated by the Sauerbrey equation, and (c) −Δf/ΔR during the solvent evaporation of 2bBF2. The background color indicates the corresponding fluorescence changes during the solvent evaporation of the droplet. From [31]; reprinted with permission from the Chemical Society of Japan.
The QCM results can be used to evaluate not only the Δm, but also the viscoelastic properties of the adsorbed materials. Kanazawa et al. [31] and Muramatsu et al. [32] reported that the viscosity coefficient can be estimated based on the Δf and ΔR. However, it is complicated to evaluate both the viscosity and elasticity separately in the viscoelastic medium, because Δf depends on both the Δm and viscosity. The ratio -Δf/ΔR was proposed by Kubono et al. to semi-quantitatively separate the viscosity and elasticity [33]. The −Δf/ΔR value of only solvent is about 5.5. Figure 10c shows the time evolution of the −Δf/ΔR value after the dropping of 2bBF2 solution. From just after dropping until 70 s, the −Δf/ΔR value was maintained at 5.5. From 70 to 86 s, −Δf/ΔR temporarily increased to 9.2 at 84 s, which most probably originated from the artifact due to the adhesion of the aggregates. It then recovered to 5.5 until 112 s, suggesting that the amorphous-like state as an intermediate has a similar viscosity to the solution. Finally, the −Δf/ΔR value increased to 9.2, which is ascribed to the transformation to elastic crystals. The condensed monomer molecules in the solution form an amorphous-like state with an optically isotropic and viscous fluid. Then it adsorbs onto the substrate as a liquid-like cluster. The Δm continually increases with time, which can be explained by the dissolved monomer molecules being further adsorbed onto the amorphous-like aggregates with increasing solution concentration. The polarized optical images and QCM measurements reveal that the intermediate liquid-like cluster state has high viscosity through solvent evaporation, but nevertheless the emission color is similar to that of the amorphous solid.
References
- Ye, X.; Liu, Y.; Lv, Y.; Liu, G.; Zheng, X.; Han, Q.; Jackson, K.A.; Tao, X. In Situ Microscopic Observation of the Crystallization Process of Molecular Microparticles by Fluorescence Switching. Angew. Chem. Int. Ed. 2015, 54, 7976–7980, doi:10.1002/anie.201503052.
- Sagara, Y.; Kato, T. Mechanically induced luminescence changes in molecular assemblies. Nat. Chem. 2009, 1, 605–610, doi:10.1038/nchem.411.
- Chi, Z.; Zhang, X.; Xu, B.; Zhou, X.; Ma, C.; Zhang, Y.; Liu, S.; Xu, J. Recent advances in organic mechanofluorochromic materials. Chem. Soc. Rev. 2012, 41, 3878–3896, doi:10.1039/c2cs35016e.
- Мирочник, А.; Fedorenko, E.; Kaidalova, T.; Merkulov, E.; Kuryavyi, V.; Galkin, K.N.; Karasev, V. Reversible luminescence thermochromism and phase transition in crystals of thiophenylacetylacetonatoboron difluoride. J. Lumin. 2008, 128, 1799–1802, doi:10.1016/j.jlumin.2008.04.016.
- Sakai, A.; Tanaka, M.; Ohta, E.; Yoshimoto, Y.; Mizuno, K.; Ikeda, H. White light emission from a single component system: Remarkable concentration effects on the fluorescence of 1,3-diaroylmethanatoboron difluoride. Tetrahedron Lett. 2012, 53, 4138–4141, doi:10.1016/j.tetlet.2012.05.122.
- Zhang, G.; Singer, J.P.; Kooi, S.E.; Evans, R.E.; Thomas, E.L.; Fraser, C.L. Reversible solid-state mechanochromic fluorescence from a boron lipid dye. J. Mater. Chem. 2011, 21, 8295–8299, doi:10.1039/c0jm03871g.
- Liu, T.; Chien, A.D.; Lu, J.; Zhang, G.; Fraser, C.L. Arene effects on difluoroboron β-diketonate mechanochromic luminescence. J. Mater. Chem. 2011, 21, 8401–8408, doi:10.1039/c0jm04326e.
- Zhang, G.; Lu, J.; Sabat, M.; Fraser, C.L. Polymorphism and Reversible Mechanochromic Luminescence for Solid-State Difluoroboron Avobenzone. J. Am. Chem. Soc. 2010, 132, 2160–2162, doi:10.1021/ja9097719.
- Sagawa, T.; Ito, F.; Sakai, A.; Ogata, Y.; Tanaka, K.; Ikeda, H. Substituent-dependent backward reaction in mechanofluorochromism of dibenzoylmethanatoboron difluoride derivatives. Photochem. Photobiol. Sci. 2016, 15, 420–430, doi:10.1039/C5PP00453E.
- Ito, F.; Sagawa, T. Quantitative evaluation of thermodynamic parameters for thermal back-reaction after mechanically induced fluorescence change. RSC Adv. 2013, 3, 19785, doi:10.1039/c3ra43321h.
- Steiner, T. The hydrogen bond in the solid state. Angew. Chem. Int. Ed. 2002, 41, 48–76, doi:10.1002/1521-3773(20020104)41:13.0.co;2-u.
- Sun, X.; Zhang, X.; Li, X.; Liu, S.; Zhang, G. A mechanistic investigation of mechanochromic luminescent organoboron materials. J. Mater. Chem. 2012, 22, 17332, doi:10.1039/c2jm32809g.
- Ito, F.; Suzuki, Y.; Fujimori, J.-I.; Sagawa, T.; Hara, M.; Seki, T.; Yasukuni, R.; De La Chapelle, M.L. Direct Visualization of the Two-step Nucleation Model by Fluorescence Color Changes during Evaporative Crystallization from Solution. Sci. Rep. 2016, 6, 22918, doi:10.1038/srep22918.
- Tanaka, M.; Ohta, E.; Sakai, A.; Yoshimoto, Y.; Mizuno, K.; Ikeda, H. Remarkable difference in fluorescence lifetimes of the crystalline states of dibenzoylmethanatoboron difluoride and its diisopropyl derivative. Tetrahedron Lett. 2013, 54, 4380–4384, doi:10.1016/j.tetlet.2013.05.120.
- Sakai, A.; Ohta, E.; Yoshimoto, Y.; Tanaka, M.; Matsui, Y.; Mizuno, K.; Ikeda, H. New Fluorescence Domain “Excited Multimer” Formed upon Photoexcitation of Continuously Stacked Diaroylmethanatoboron Difluoride Molecules with Fused π-Orbitals in Crystals. Chem. Eur. J. 2015, 21, 18128–18137, doi:10.1002/chem.201503132.
- Zhang, X.; Yan, C.-J.; Pan, G.-B.; Zhang, R.-Q.; Wan, L.-J. Effect of C−H•••F and O−H•••O Hydrogen Bonding in Forming Self-Assembled Monolayers of BF2-Substituted β-Dicarbonyl Derivatives on HOPG: STM Investigation. J. Phys. Chem. C 2007, 111, 13851–13854, doi:10.1021/jp072552a.
- Galer, P.; Korošec, R.C.; Vidmar, M.; Šket, B. Crystal Structures and Emission Properties of the BF2 Complex 1-Phenyl-3-(3,5-dimethoxyphenyl)-propane-1,3-dione: Multiple Chromisms, Aggregation or Crystallization-Induced Emission, and the Self-Assembly Effect. J. Am. Chem. Soc. 2014, 136, 7383–7394, doi:10.1021/ja501977a.
- Hughes, C.E.; Harris, K.D. A Technique for In Situ Monitoring of Crystallization from Solution by Solid-State13C CPMAS NMR Spectroscopy. J. Phys. Chem. A 2008, 112, 6808–6810, doi:10.1021/jp805182v.
- Hughes, C.E.; Williams, P.A.; Keast, V.L.; Charalampopoulos, V.G.; Edwards-Gau, G.R.; Harris, K.D. New In Situ solid-state NMR techniques for probing the evolution of crystallization processes: Pre-nucleation, nucleation and growth. Faraday Discuss. 2015, 179, 115–140, doi:10.1039/C4FD00215F.
- Harano, K.; Homma, T.; Niimi, Y.; Koshino, M.; Suenaga, K.; Leibler, L.; Nakamura, E. Heterogeneous nucleation of organic crystals mediated by single-molecule templates. Nat. Mater. 2012, 11, 877–881, doi:10.1038/nmat3408.
- Knezic, D.; Zaccaro, J.; Myerson, A.S. Nucleation Induction Time in Levitated Droplets. J. Phys. Chem. B 2004, 108, 10672–10677, doi:10.1021/jp049586s.
- Garetz, B.A.; Matić, J.; Myerson, A.S. Polarization Switching of Crystal Structure in the Nonphotochemical Light-Induced Nucleation of Supersaturated Aqueous Glycine Solutions. Phys. Rev. Lett. 2002, 89, 175501, doi:10.1103/physrevlett.89.175501.
- Erdemir, D.; Lee, A.Y.; Myerson, A.S. Nucleation of Crystals from Solution: Classical and Two-Step Models. Acc. Chem. Res. 2009, 42, 621–629, doi:10.1021/ar800217x.
- Vekilov, P.G. Nucleation. Cryst. Growth Des. 2010, 10, 5007–5019, doi:10.1021/cg1011633.
- Guo, C.; Wang, J.; Li, J.; Wang, Z.; Tang, S. Kinetic Pathways and Mechanisms of Two-Step Nucleation in Crystallization. J. Phys. Chem. Lett. 2016, 7, 5008–5014, doi:10.1021/acs.jpclett.6b02276.
- Zhang, T.H.; Liu, X.Y. How Does a Transient Amorphous Precursor Template Crystallization. J. Am. Chem. Soc. 2007, 129, 13520–13526, doi:10.1021/ja073598k.
- Tsarfati, Y.; Rosenne, S.; Weissman, H.; Shimon, L.J.W.; Gur, D.; Palmer, B.A.; Rybtchinski, B. Crystallization of Organic Molecules: Nonclassical Mechanism Revealed by Direct Imaging. ACS Central Sci. 2018, 4, 1031–1036, doi:10.1021/acscentsci.8b00289.
- Ito, F.; Saigusa, M.; Kanayama, N. Evaporative Crystallization of Dibenzoylmethanato Boron Difluoride Probed by Time-resolved Quartz Crystal Microbalance Responses with Fluorescence Changes. Chem. Lett. 2019, in press.
- Ariga, K.; Endo, K.; Aoyama, Y.; Okahata, Y. QCM analyses on adsorption of gaseous guests to cast films of porphyrin-resorcinol derivatives. Colloids Surfaces A Physicochem. Eng. Asp. 2000, 169, 177–186, doi:10.1016/s0927–7757(00)00434-9.
- Sauerbrey, G. Verwendung von Schwingquarzen zur Wägung dünner Schichten und zur Mikrowägung. Eur. Phys. J. A 1959, 155, 206–222, doi:10.1007/bf01337937.
- Kanazawa, K.K.; Gordon, J.G. Frequency of a quartz microbalance in contact with liquid. Anal. Chem. 1985, 57, 1770–1771, doi:10.1021/ac00285a062.
- Muramatsu, H.; Tamiya, E.; Karube, I. Computation of equivalent circuit parameters of quartz crystals in contact with liquids and study of liquid properties. Anal. Chem. 1988, 60, 2142–2146, doi:10.1021/ac00170a032.
- Kubono, A.; Akiyama, R. Viscoelastic Analysis in the Formation of Organic Thin Films. Mol. Cryst. Liq. Cryst. 2006, 445, 213–222, doi:10.1080/15421400500366449.


