 +1 credit
| Version | Summary | Created by | Modification | Content Size | Created at | Operation |
|---|---|---|---|---|---|---|
| 1 | Vera Nikolaeva | + 1018 word(s) | 1018 | 2021-06-18 11:35:36 | | | |
| 2 | Vera Nikolaeva | Meta information modification | 1018 | 2021-07-01 19:41:54 | | | | |
| 3 | Rita Xu | + 6 word(s) | 1024 | 2021-07-02 05:40:46 | | | | |
| 4 | Vera Nikolaeva | + 4 word(s) | 1028 | 2021-07-02 09:15:43 | | | | |
| 5 | Vera Nikolaeva | + 4 word(s) | 1028 | 2021-07-02 09:19:31 | | | | |
| 6 | Vera Nikolaeva | Meta information modification | 1028 | 2021-07-02 10:18:11 | | |
Video Upload Options
E-region Auroral Ionosphere Model (AIM-E) is a numerical model involving both solar EUV radiation and electron precipitation as ionization sources. The AIM-E model allows to evaluate the concentration of the main ionospheric ions N+, N2+, NO+, O2+, O+(4S), O+(2D), O+(2P), electrons and minor neutral components NO, N(4S), N(2D), for quiet and disturbed geomagnetic conditions at specified date, time and geographic location. The model design allows to calculate the ionospheric composition in the entire high-latitude E-region in the retrospective, nowcast and forecast modes and shows good agreement with measurements.
1. Introduction
The Earth’s ionosphere E-region in the auroral zone is one of the primary indicators of solar influence on our planet and is an important element in Space Weather forecasting. Satellite and ground-based ionospheric observations have limited temporal and spatial resolution, therefore the need for mathematical modeling arises.
2. Global Distribution of Ionospheric Composition
E-region Auroral Ionosphere Model (AIM-E) calculates the ion composition and electron concentration in the high-latitude E-region, including the auroral zone using the auroral electron fluxes and solar extreme ultraviolet radiation as input parameters. The high-performance computation method allows to calculate the spatial distribution of electron concentration and other ionosphere parameters over the entire auroral zone (Figure 1) in the real time mode.
The model reproduced the ionospheric response to the geomagnetic substorm with a sufficient accuracy and can be used to describe the large-scale dynamics of the auroral oval during disturbed periods (Figure 1). The high computing performance allowed application of the AIM-E model in regular E-layer monitoring all over the auroral and subauroral zones, which is important for a real-time prediction of the radio wave propagation conditions. The AIM-E model can be applied to various practical tasks using input parameters such as solar EUV radiation and auroral electron flux from in situ measurements by satellites, or from the models, or as their combination depending on the modeling goals.
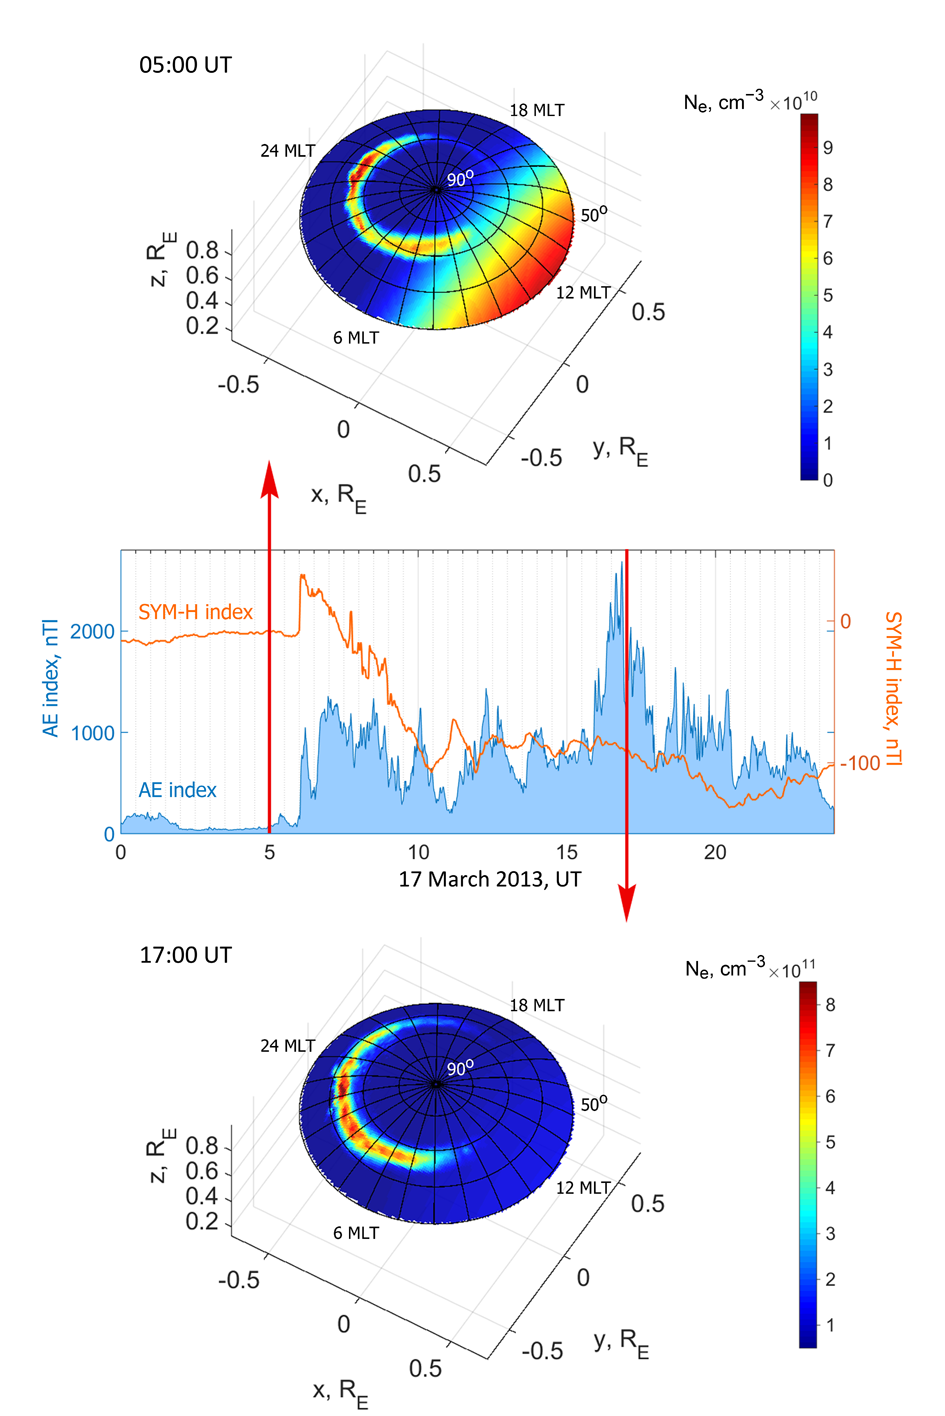 Figure 1. AIM-E evaluation of global electron distribution in the high latitude ionosphere using EUV and particle precipitation models in course of the geomagnetic storm. Geomagnetic SYM-H and AE indices variations and E layer maximum electron density spatial distribution maps for two moments (red arrows): during quiet geomagnetic conditions — 5:00 UT (upper map) and main phase of the storm — 17:00 UT (lower map) on 17 March 2013. Note, the colorbar scale differs by an order of magnitude.
3. Local Ionospheric Calculations
The model results, calculated with different types of input parameters and for the different geomagnetic conditions, show a good agreement with ground-based ionospheric data (EISCAT UHF incoherent scattering radar. Figure 2 presents the calculation of electron concentration altitude profiles along the REIMEI satellite pass across the auroral oval on 5 December 2007. During this intense electron precipitation event, the REIMEI satellite was in magnetic conjunction with EISCAT radar at 0:36:36 UT (0.610 h), enabling quantitative verification of the AIM-E model. The AIM-E solution for the electron concentration vertical profile (Figure 2c) has a clear response to a change of the precipitating electrons’ energy spectrum measured by the spacecraft. A notable manifestation is an increase of the electron concentration by the ~2 order of magnitude and the sporadic Es-layer formation after 00:36:18 UT (0.605 h) due to the sharp increase of the ~3 keV electron flux. The EISCAT experiment was carried out simultaneously with the REIMEI satellite passage and the moment of the conjugated measurements was at 0:36:36 UT (0.610 h). Figure 2d shows a sufficiently good agreement between the altitude profile of the electron concentration calculated with the AIM-E model (red line) and measured by incoherent scattering radar (blue line).
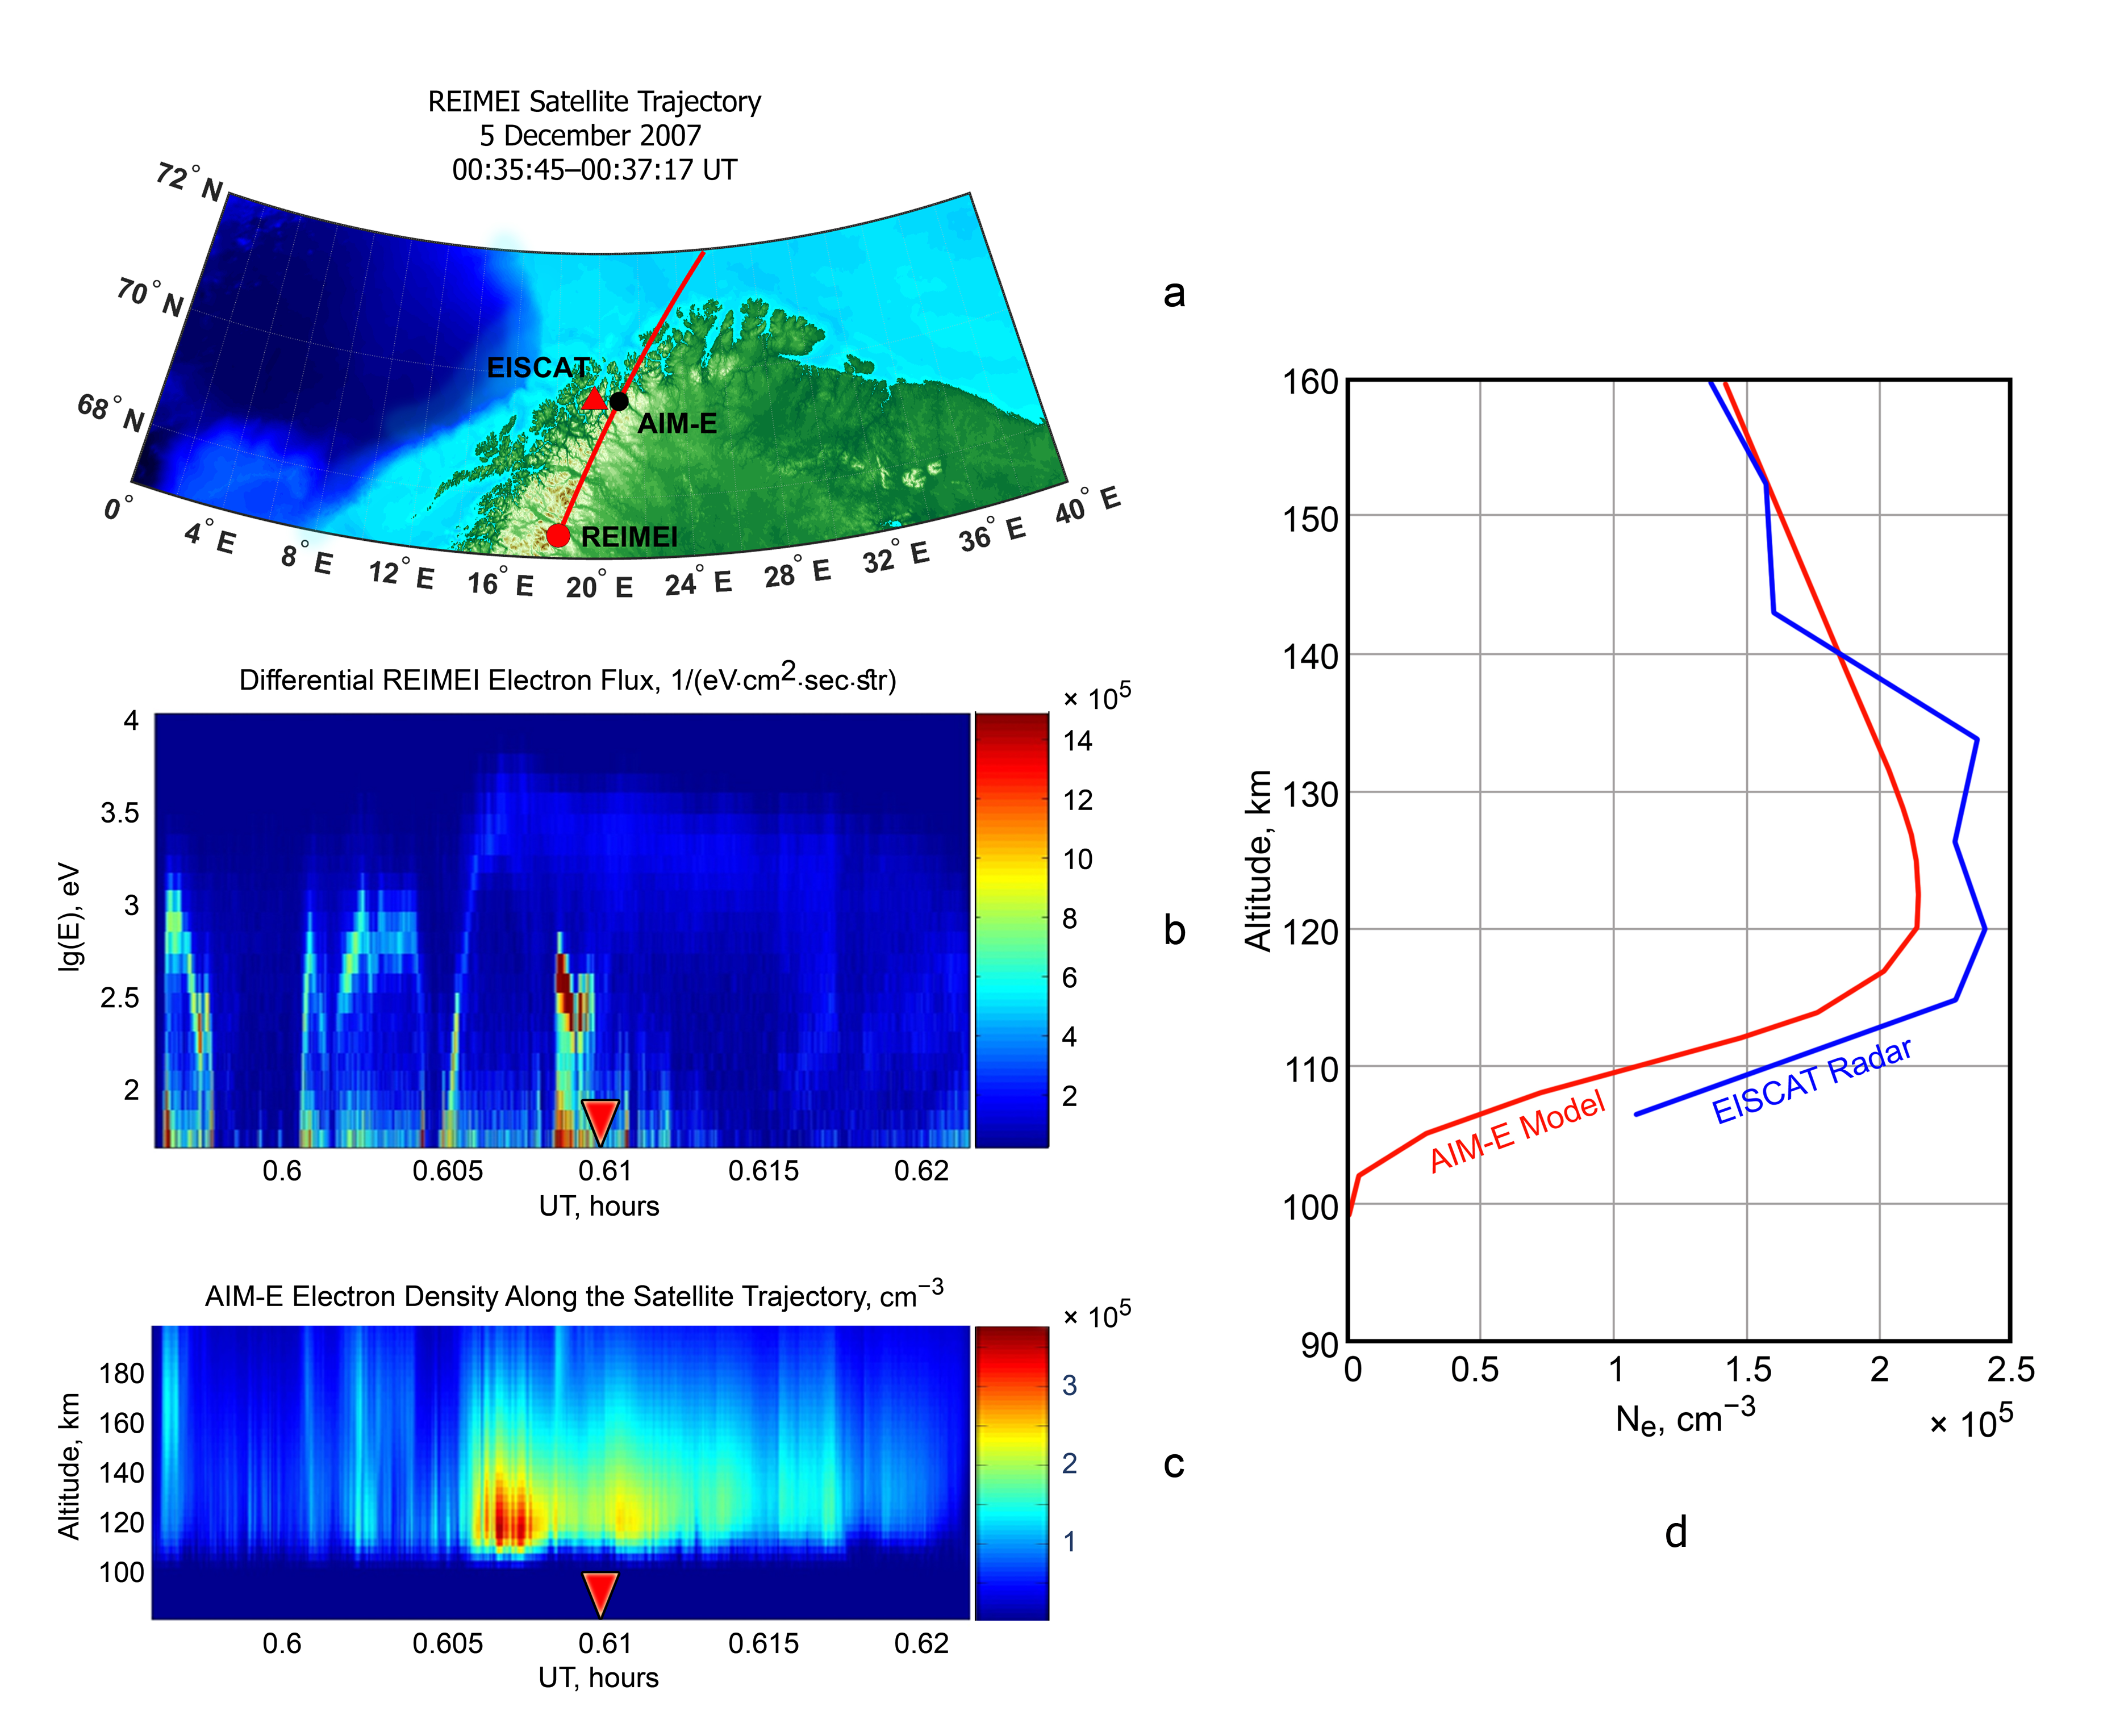 Figure 2. An example of the electron concentration vertical profiles calculation along the satellite trajectory. (a) REIMEI spacecraft trajectory on 5 December 2007 (00:35:45–00:37:17 UT (0.596–0.621 h)) projected to the 110 km height along the magnetic field lines with the IGRF-12 model; (b) REIMEI differential electron energy flux along the satellite trajectory in energy range from 60 eV to 11 keV; (c) AIM-E electron density values corresponding to REIMEI precipitation input electron flux measurements. Red triangles in (b,c) shows the moment of EISCAT and REIMEI conjugated measurements at 0:36:36 UT (0.610 h). (d) Vertical electron concentration profiles for the December 5, 2007 0:36:36 UT (0.610 h). AIM-E model electron concentration—red line and EISCAT UHF incoherent scattering radar—blue line.
Figure 3a shows the diurnal variation of measured (red lines) and modeled (blue dashed lines) foE during the considered 3-day period for the selected auroral and subauroral stations. The modeled foE values were in good agreement with measured values at all stations (correlation coefficient R = 0.982). This result shows that the AIM-E model can adequately describe the current state (and even a short-term forecast) of the ionosphere regular E layer, which is especially important in the absence of ionospheric data or during the strong D-region absorption events.
Model can provide a reliable ionospheric information during the day in the whole auroral zone (Figure 3b) that is important for the HF radio wave propagation (3–30 MHz). Knowing the current conditions and forecast of the regular E-layer is critical to ensuring long-distance logistics on land, at sea, and in the air.
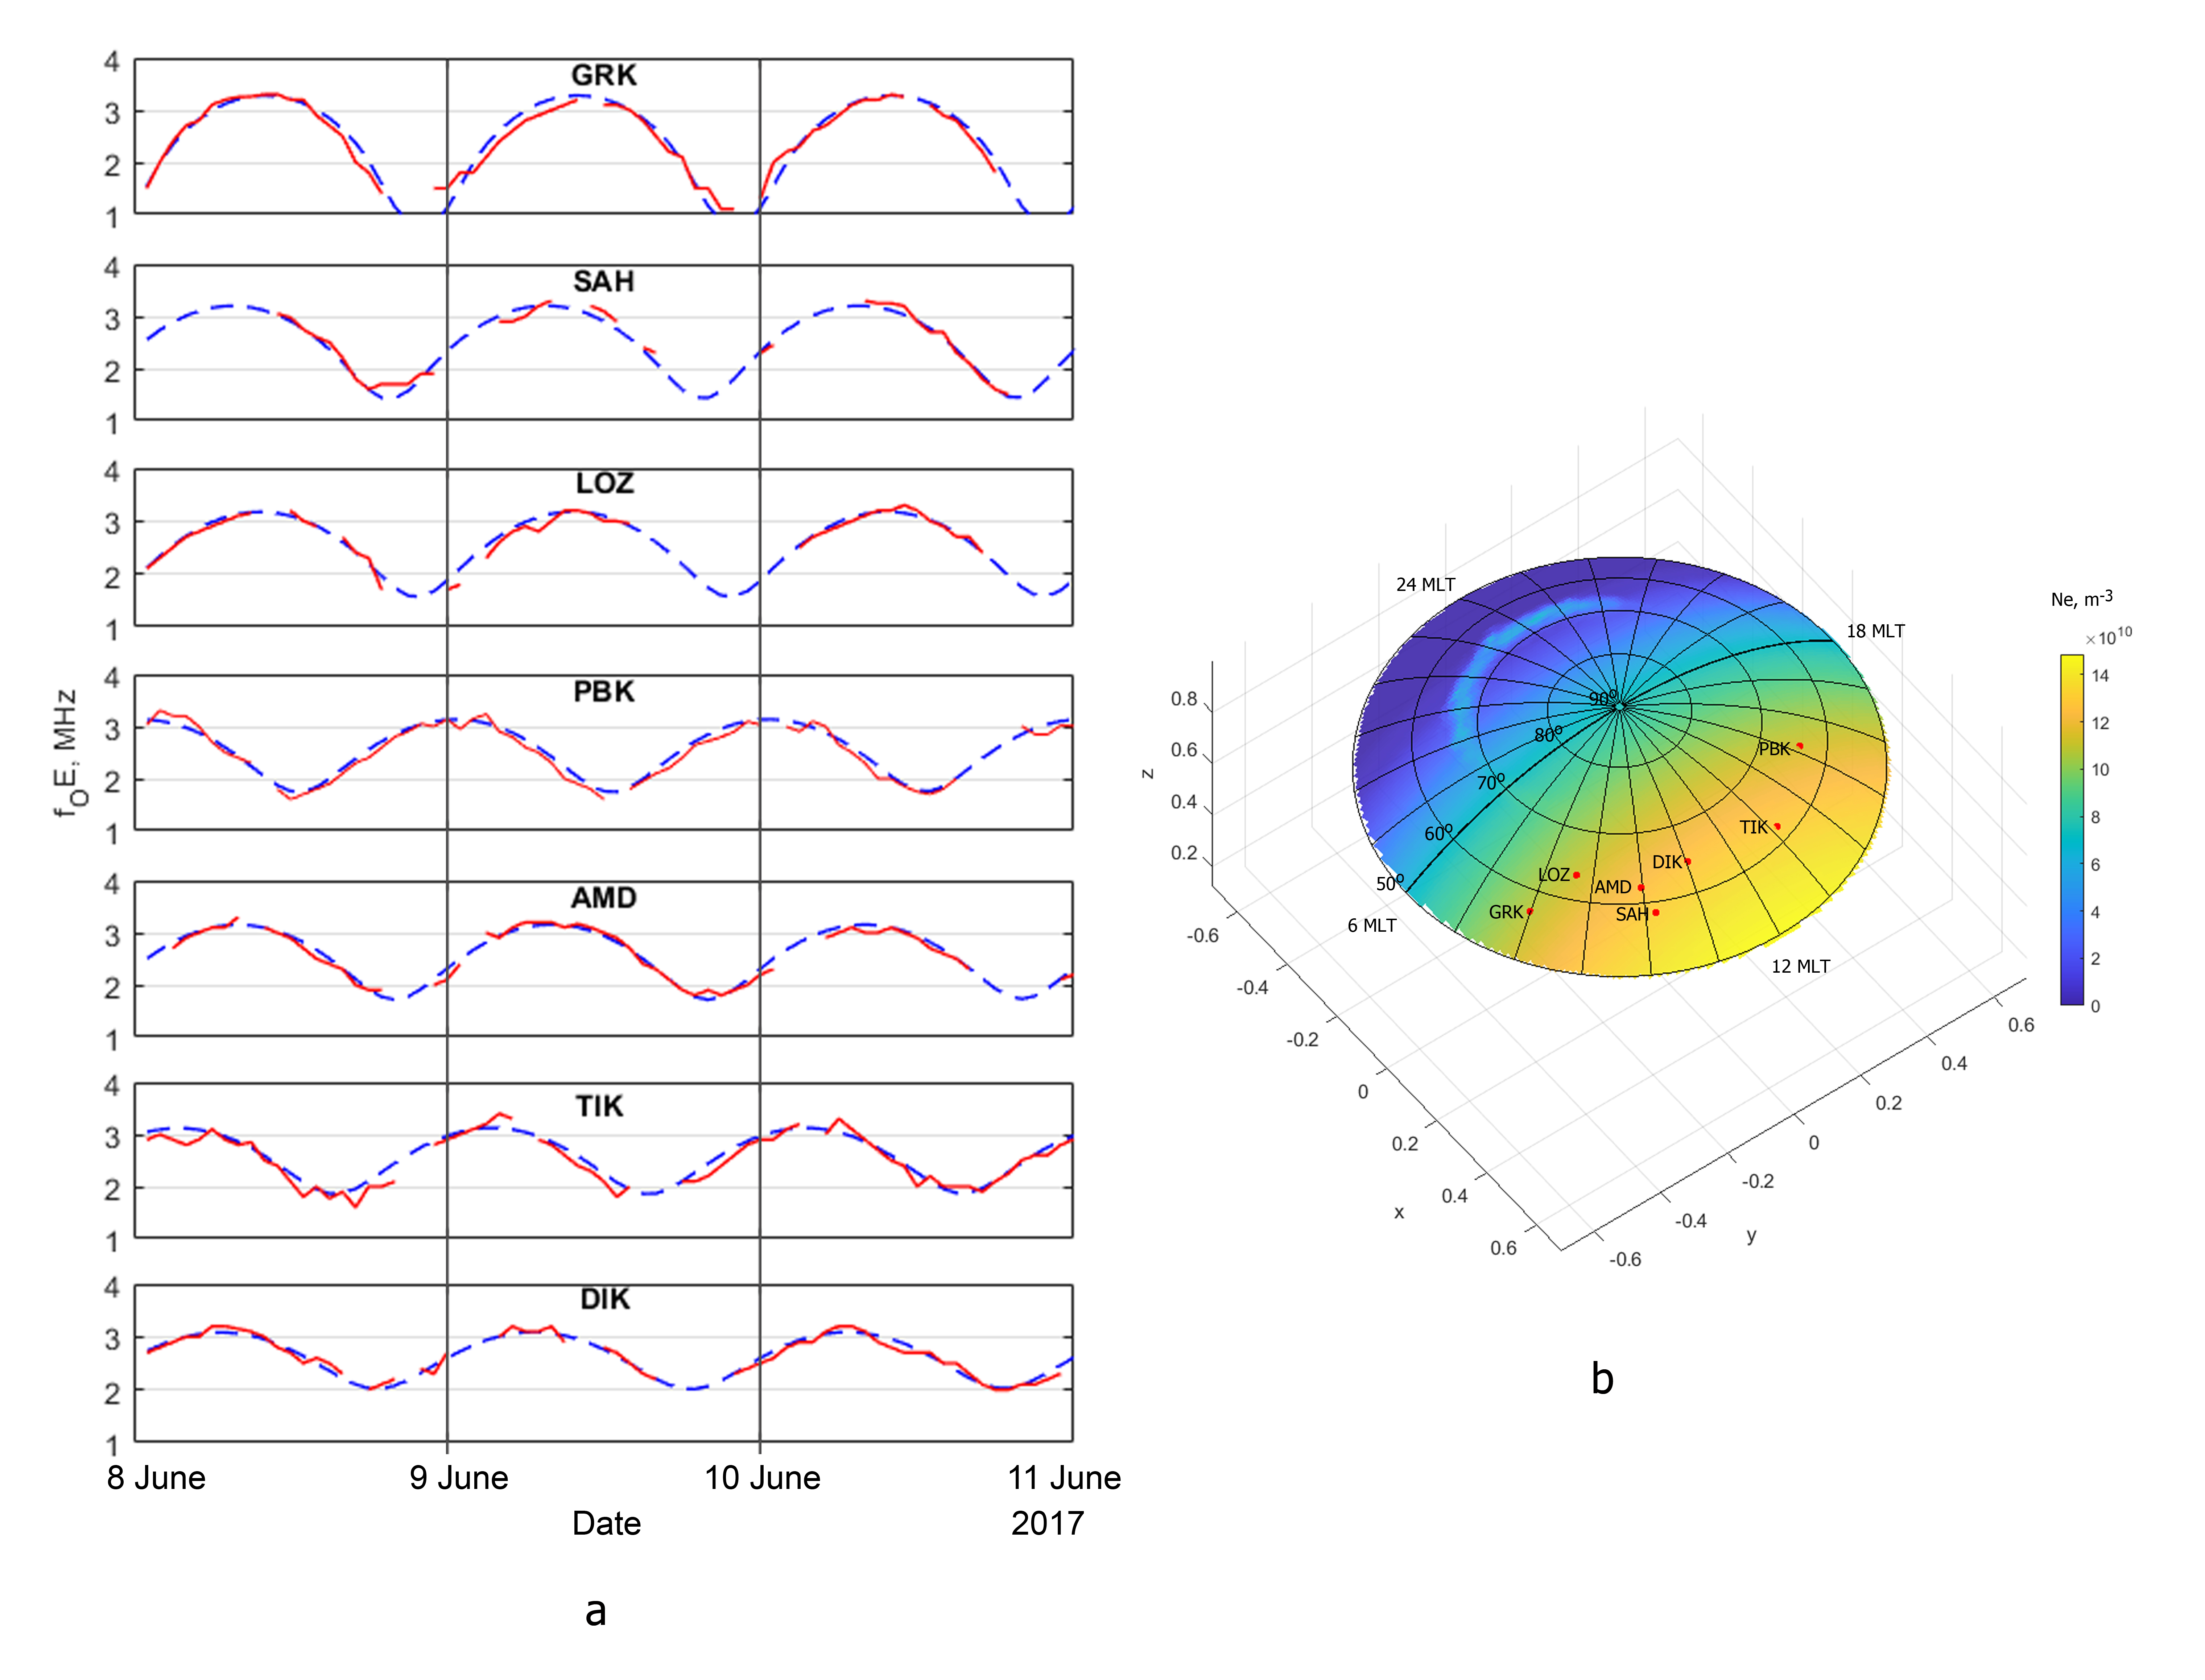 Figure 3. AIM-E evaluation of the regular E layer parameters during quiet geomagnetic conditions. (a) Diurnal variation of the ionosphere regular E region critical frequencies determined by high-latitude observatories Gorkovskaya (GRK), Salekhard (SAH), Lovozero (LOZ), Pevek (PBK), Amderma (AMD), Tiksi (TIK), and Dickson (DIK) (red lines), and critical frequencies calculated using the AIM-E model with EUVAC model photon flux input (blue dashed lines) for the period of 8–10 June 2017. (b) A map of electron density spatial distribution at the E-layer maximum for June 04, 2015, 05:00 UT. The coordinate system is solar magnetic (SM).
4. Conclusions
The AIM-E model was designed to become a useful tool for both operational and scientific applications in the Arctic and Antarctic ionosphere regions. The model can be used in a wide spectrum of scientific problems, including, but not limited to, various aspects of ionospheric chemistry, distribution of conductance, electric fields and currents, calculation of electron density, etc. In the operational mode, the model is suitable for real-time monitoring of the radio waves propagation conditions, which are crucial for the quality of communication in the most unstable auroral zone. The AIM-E model may also be utilized as a part of more complex space weather models as an efficient ionospheric module.


