Your browser does not fully support modern features. Please upgrade for a smoother experience.
Submitted Successfully!
 +1 credit
Thank you for your contribution! You can also upload a video entry or images related to this topic.
For video creation, please contact our Academic Video Service.
| Version | Summary | Created by | Modification | Content Size | Created at | Operation |
|---|---|---|---|---|---|---|
| 1 | Arianna Carolina Rosa | + 2595 word(s) | 2595 | 2021-10-19 11:13:26 | | | |
| 2 | Amina Yu | -99 word(s) | 2496 | 2021-10-20 11:41:31 | | |
Video Upload Options
We provide professional Academic Video Service to translate complex research into visually appealing presentations. Would you like to try it?
Cite
If you have any further questions, please contact Encyclopedia Editorial Office.
Rosa, A.C. Interplay between Histamine H4 Receptor and Kidney Function. Encyclopedia. Available online: https://encyclopedia.pub/entry/15180 (accessed on 08 February 2026).
Rosa AC. Interplay between Histamine H4 Receptor and Kidney Function. Encyclopedia. Available at: https://encyclopedia.pub/entry/15180. Accessed February 08, 2026.
Rosa, Arianna Carolina. "Interplay between Histamine H4 Receptor and Kidney Function" Encyclopedia, https://encyclopedia.pub/entry/15180 (accessed February 08, 2026).
Rosa, A.C. (2021, October 20). Interplay between Histamine H4 Receptor and Kidney Function. In Encyclopedia. https://encyclopedia.pub/entry/15180
Rosa, Arianna Carolina. "Interplay between Histamine H4 Receptor and Kidney Function." Encyclopedia. Web. 20 October, 2021.
Copy Citation
Histamine H4 receptor is the most recently discovered histamine receptor. It is a pertussis-toxin-sensitive GPCR mostly expressed on cells of the immune system, such as mast cells, eosinophils, neutrophils, and basophils, but also found in resident renal cells.
histamine H4 receptors
renal function
diabetic nephropathy
1. Introduction
The previous in vitro and ex vivo studies demonstrated that the H4 receptor is localized on the proximal tubules, thus suggesting it could participate in renal patho-physiology. Consistently, our group demonstrated that the H4 receptor antagonist JNJ-39758979 prevents renal damage in a mouse model of diabetes-induced nephropathy [1]. In particular, the data obtained suggested that histamine through the H4 receptor could exert both an indirect effect on renal tissue architecture by recruiting pro-inflammatory cells and, more importantly, direct modulation of tubular reabsorption. However, the histamine receptor subtype ligands’ specificity, efficacy and potency are a source of concerns [2]. Therefore, genetic knockout models are fundamental to understand the role of this specific histamine receptor subtype in kidney function and differentiate between off-target and on-target histamine H4 receptor effects.
Histamine H4 receptor knockout (H4R−/−) mice were generated soon after the histamine H4 receptor discovery [3] and initially used to demonstrate the role of the histamine H4 receptor in mediating mast cells’ chemotaxis. Since then, H4R−/− mice have been widely used to highlight the complexity of histamine H4 receptor function in allergy [4][5][6][7][8], inflammation [2], pain [9], or cancer [10]. However, to the best of our knowledge, none of these studies investigated the renal function in H4R−/− mice. Nevertheless, although histamine was suggested to be involved in the etiopathology of diabetes complications [11], nephropathy in particular [12], no study to date involved diabetic H4R−/− mice and evaluated their susceptibility to developing diabetic nephropathy.
1.1. Comparison between Wild-Type and H4R−/− Mice on Histamine Receptor Expression
The expression of the histamine receptors in both wild-type and H4R−/− mice was evaluated. As shown in Figure 1, only histamine H1 and H2 receptors were different between the two genotypes. Histamine H1 receptor was over-expressed in H4R−/− mice. On the contrary, wild-type mice showed a higher level of the histamine H2 receptor.
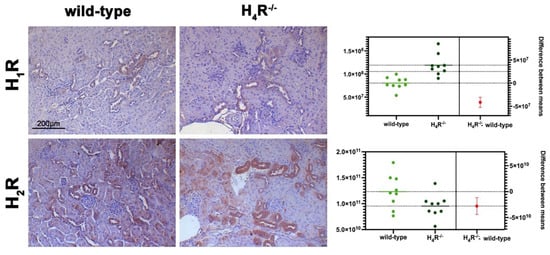
Figure 1. Comparison of histamine H1 and H2 receptor expression between wild-type and H4R−/− mice. Micrographs represent the immunolabeling of transverse kidney sections with specific anti-histamine H1 and H2 antibodies (20× magnification). Positive staining area/total area was determined by color deconvolution, and the estimation plot of Welch’s t-test has been reported.
1.2. Comparison between Wild-Type and H4R−/− Mice on Functional Parameters
The comparison between the urine volumes collected after 24 h showed a significant difference between wild-type and H4R−/− animals (1.33 ± 0.01 and 0.44 ± 0.10, respectively; p < 0.05). Similarly, UPE, albumin excretion, as well as the creatinine-to-albumin ratio (ACR) in the wild-type group were significantly higher than that of H4R−/− (0.26 ± 0.04 vs. 0.09 ± 0.03 for albuminuria and 17.74 ± 1.63 vs. 8.67 ± 2.89 for ACR; p < 0.05). However, the urinary pH and creatinine clearance (CrCl) did not show any significant differences between the two groups (Table 1). Mice age did not affect the renal function changes observed. Despite the described differences in some urine parameters, the morphological analysis by hematoxylin and eosin staining revealed comparable renal architecture between wild-type and H4R−/− mice (Figure 2a) without signs of inflammatory infiltration as well as tubular or glomerular damage (Figure 2a,b).
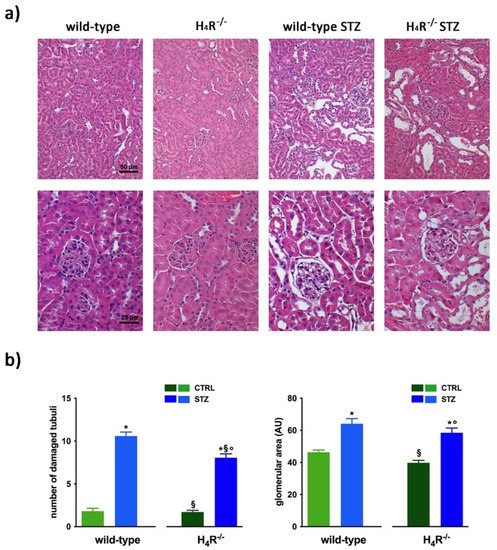
Figure 2. Comparison of gross tissue architecture between wild-type and H4R−/− mice: (a) Representative micrographs showing hematoxylin and eosin staining at day 116 highlighting tubular and glomerular diabetic-associated alterations magnification: 200× in upper panels and 400× in lower panels; (b) Quantification of tubular damage and glomerular area. Data are expressed as the number of damaged tubules and glomerular area (Arbitrary Unit, AU), respectively. Data are expressed as the mean ± S.E.M.; * p < 0.05 vs. wild-type; § p < 0.05 vs. STZ wild-type; ° p < 0,05 STZ H4R−/− vs. H4R−/−.
However, the analysis of the intrarenal inflammation marker IL-6 shown in Figure 3 demonstrates a higher level of renal IL-6 in H4R−/− mice than the wild-type.
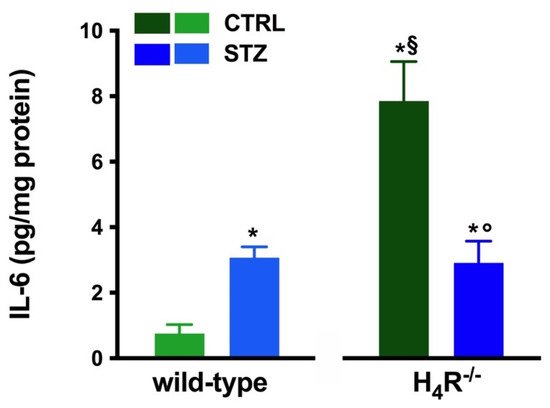
Figure 3. Comparison of IL-6 expression in kidney tissue between wild-type and H4R−/− mice. Expression of IL-6, reported as pg/mg of tissue homogenate protein (i.e., pg/mg protein), was determined by the enzyme-linked immunosorbent assay (ELISA). Data are expressed as the mean (pg/mg protein) ± S.E.M.; * p < 0.05 vs. wild-type; § p < 0.05 vs. STZ wild-type; ° p < 0,05 STZ H4R−/− vs. H4R−/−.
1.3. Diabetic Nephropathy Development in H4R−/− Mice
The basal glycemic level at day 116 was significantly higher in H4R−/− animals compared to wild-type counterpart (184.77 ± 21, 67 mg/dL vs. 102.11 ± 20.03 mg/dL; p < 0.05), although lower than the cut-off of 200 mg/dL, defining diabetes [13] for both the genotypes. One week after the induction of diabetes, more than a half of the animals showed a glycemia ≥200 mg/dL; the glycemic level raised over 200 mg/dL within 14 days and remained severe [13] (300–600 mg/dL; p < 0.05 vs. control) through the observation period, irrespectively of the animal age in both wild-type and H4R−/− mice (Figure 4a and Supplementary Materials Tables S3 and S4). The rise in glucose glycemic was paralleled by a reduction in body growth consistent with the type 1 diabetes model adopted: on day 116, the STZ wild-type group reached an average weight of 26.06 ± 2.44 g, and the STZ H4R−/− 24.97 ± 1.95 g (Figure 4b and Supplementary Materials Tables S1 and S2).
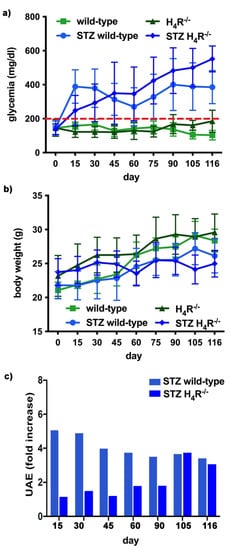
Figure 4. Comparison of diabetic wild-type and H4R−/− mice: (a) Six-hour fasting blood glucose was recorded fortnightly using a Glucocard MX Blood Glucose Meter. Data are expressed as mean ± S.E.M. The red line identifies the 200 mg/dL fasting blood glucose level cut used to assess the diabetes onset; (b) Body weight was monitored and recorded constantly throughout the experimental period. Data are expressed as mean ± S.E.M.; (c) Albuminuria progression was monitored over time on urine samples collected over 24 h. The data are expressed as fold increases compared to the relatively healthy controls. UAE = albuminuria.
In hyperglycemic conditions, histopathological changes, the hallmark of diabetic nephropathy were present. In particular, glomeruli were hypertrophic and displayed an increase in the glomerular area irrespectively to the genotype, and tubular atrophy was evident, although H4R−/− diabetic mice showed a lower number of damaged tubules compared to the wild-type counterpart (Figure 2b). Again, no evident signs of inflammatory infiltration were detectable in the different groups (Figure 2a). However, IL-6 was significantly increased in STZ wild-type animals compared to their control. On the contrary, the STZ H4R−/− group showed downregulation of IL-6 with respect to H4R−/− mice, reaching levels comparable to that of STZ wild-type animals (Figure 3). Looking at the renal function parameters in Table 1, diabetic animals showed values consistent with the renal damage characteristic of hyperglycemia: urine volume, urine acidity, UPE, albuminuria, ACR, and CrCl were significantly higher (p < 0.05) compared to the respective controls. However, the two genotypes present exciting differences. STZ wild-type animals showed lower polyuria (+8.70-fold) than the STZ H4R−/− group, in which the fold increase in urinary volume compared to their healthy controls was +49.68. Similarly, proteinuria was increased by 5.70-fold in STZ wild-type animals and 28.74-fold in the STZ H4R−/− group (p < 0.05). However, the increase in ACR was more significant in wild-type diabetics than in those of H4R−/− (15.07 vs. 6.56; p < 0.05). Interestingly, the progression of albuminuria was different between the two genotypes. Indeed, the rise in albuminuria over time is slower in the STZ H4R−/− group, reaching the fold increase registered in STZ wild-type animals only at day 105 (Figure 4c). Again, no significant difference was found for both urinary pH and CrCl (Table 1). The data reported and the differences found suggest that the H4 receptor is involved in tubular reabsorption phenomena.
2. Megalin Expression in Wild-Type and H4R−/− Mice
The data reported in Table 1 underline significant differences in albumin reabsorption between wild-type and H4R−/− mice. Therefore, the expression of megalin, an essential endocytic receptor of the proximal tubular apparatus involved in the uptake of glomerular-filtered albumin [14], was evaluated. Consistent with the functional data, the immunofluorescence analysis of megalin revealed a significant increase in protein expression in the H4R−/− group compared to the wild-type group (Figure 5). These differences in megalin basal expression were also found when diabetic mice were compared. Indeed, both wild-type and H4R−/− mice showed a significant reduction of megalin, consistent with diabetic renal damage. However, the megalin loss was significantly reduced in H4R−/− mice (Figure 5). These differences could explain, at least in part, the functional differences observed on the ACR.
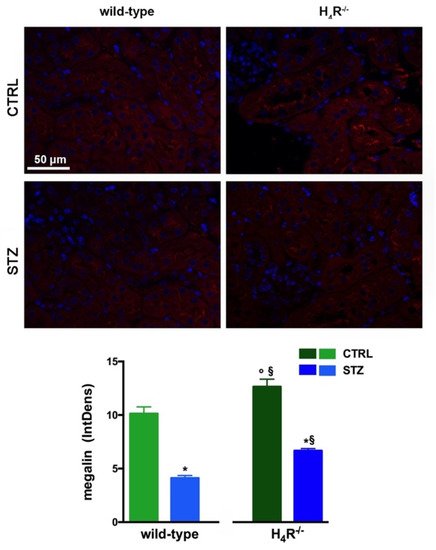
Figure 5. Comparison of megalin expression between wild-type and H4R−/− mice. Micrographs at 40× magnification showing the immunofluorescence analysis of megalin (red). Nuclei were stained with DAPI (blue). Densitometric analysis of megalin expression was determined by immunofluorescence analysis. Expression levels over control are expressed as the mean (IntDen) ± S.E.M. (n = 10); * p < 0.05 vs. wild-type; § p < 0.05 vs. STZ wild-type; ° p < 0.05 STZ H4R−/− vs. H4R−/−.
3. NHE3 Expression in Wild-Type and H4R−/− Mice
As megalin expression is inversely correlated with that of NHE3 [15], we also evaluated the expression of this tubular exchanger. As reported in Figure 6a, control animals, both wild-type and H4R−/− showed a weak fluorescence intensity, more localized in the apical area. The Western blot analysis revealed a single 95 kDa (molecular weight predicted for NHE3) species, demonstrating a significantly reduced expression of NHE3 in H4R−/− mice. The exchanger was over-expressed in the diabetic groups but the basal differences between the two genotypes were retrieved in diabetic animals (Figure 6b,c). These data, therefore, further confirm the potential role of the H4 receptor in regulating tubular reabsorption.
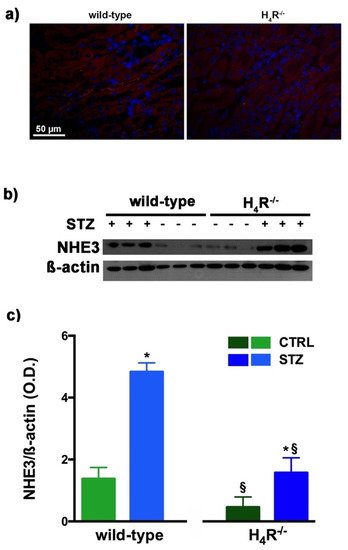
Figure 6. Comparison of NHE3 expression between wild-type and H4R−/− mice. Micrographs at 40× magnification showing the immunofluorescence analysis of NHE3 (red). Nuclei were stained with DAPI (blue) (a); Representative radiograph of NHE3 in kidney tissue determined by immunoblotting (b); The densitometric analysis (c) was performed, and expression levels normalized to β-actin are expressed as the mean ± S.E.M. of 3 animals/group; * p < 0.05 vs. wild-type; § p < 0.05 vs. STZ wild-type.
4. AQPs Expression in Wild-Type and H4R−/− Mice
The urine volume differences observed between wild-type and H4R−/− mice point out possible differences in the expression pattern of AQPs, a family of channel-forming transmembrane proteins differentially involved in water balance, included body water homeostasis [16]. Among them, AQP1, 3, and 7 are mainly expressed on the proximal tubular segment of the nephron. As shown in Figure 7, no significant differences were found.
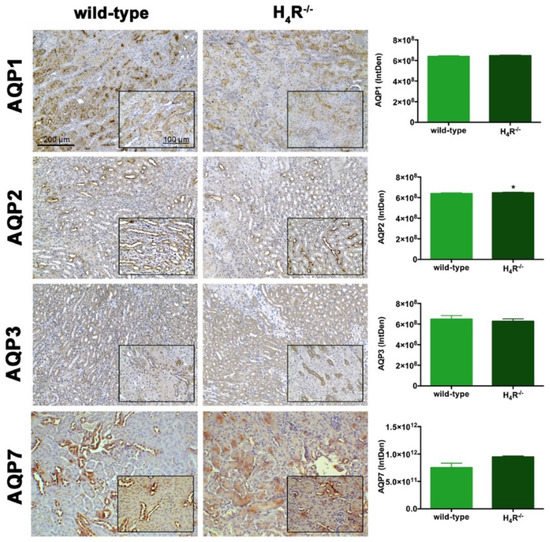
Figure 7. Comparison of AQPs expression between wild-type and H4R−/− mice. Micrographs at 20× and 40× (insert) magnification of transverse kidney sections, immunolabeled with specific anti-AQP1, -AQP2, AQP3, and AQP7 antibodies. Positive staining area/total area was determined by color deconvolution. Results are the mean ± S.E.M. of the IntDen; * p < 0.05 vs. wild-type.
However, the Western blot analysis revealed exciting differences in the balance between the glycosylated and non-glycosylated forms of AQP1 and AQP7 (Figure 8 and Figure 9).
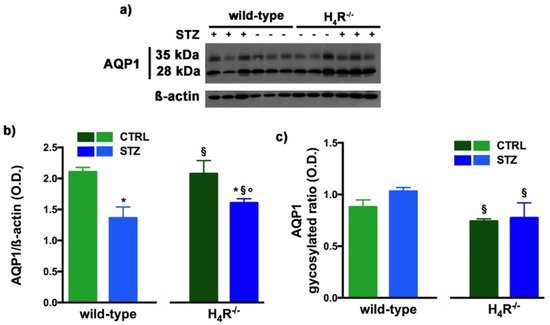
Figure 8. Comparison of AQP1 expression between wild-type and H4R−/− mice. Representative radiograph of AQP1 in kidney tissue determined by immunoblotting (a); The densitometric analysis of the AQP1 overall content was performed, and expression levels, normalized to β-actin, are expressed as the mean ± S.E.M. of 3 animals/group (b); The glycosylation ratio was evaluated and was expressed as the mean ± S.E.M. of 3 animals/group (c); * p < 0.05 vs. wild-type; § p < 0,05 vs. STZ wild-type; ° p < 0,05 STZ H4R−/− vs. H4R−/−.
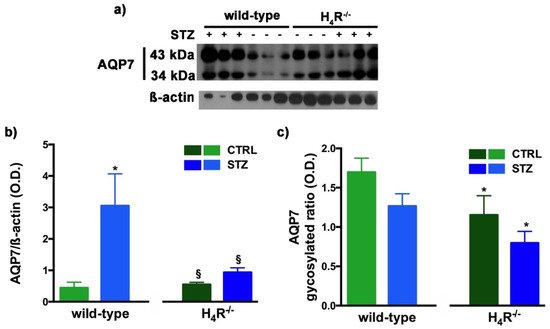
Figure 9. Comparison of AQP7 expression between wild-type and H4R−/− mice. Representative radiograph of AQP7 in kidney tissue determined by immunoblotting (a); The densitometric analysis of the AQP7 overall content was performed, and expression levels, normalized to β-actin, are expressed as the mean ± S.E.M. of 3 animals/group (b); The glycosylation ratio was evaluated and was expressed as the mean ± S.E.M. of 3 animals/group (c); * p < 0.05 vs. wild-type; § p < 0,05 vs. STZ wild-type.
As reported in Figure 8a, the Western blot analysis revealed for AQP1 two bands corresponding to the glycosylated (35 kDa) or the non-glycosylated (28 kDa) form [17]. The glycosylation ratio in H4R−/− healthy or diabetic mice was lower than wild-type animals (Figure 8c). The overall content of AQP1 showed a significant reduction in diabetic animals compared to the respective controls. However, STZ wild-type animals showed significantly lower expression of AQP1 (Figure 8b) but a higher glycosylation ratio (Figure 8c) than STZ H4R−/−.
A similar glycosylation ratio analysis was also performed for AQP7. Two bands for AQP7 were revealed (Figure 9a): one with a higher molecular weight (43 kDa) and one with a lower molecular weight (34 kDa), which correspond respectively to the glycosylated and non-glycosylated form [18]. The glycosylation ratio in H4R−/− mice was lower than wild-type animals (Figure 9c). Diabetic wild-type mice but not H4R−/− showed an increase in AQP7 (Figure 9b) without significant differences in the glycosylation ratio compared to the relative controls (Figure 9c).
Finally, AQP2 expression was evaluated. This AQP, located on the apical cell membranes of the kidney’s collecting duct principal cells, is vasopressin-sensitive, and is the most well-studied AQP in the kidney [19]. Notably, the expression of AQP2 was lower in the H4R−/− (Figure 7 and Figure 10).
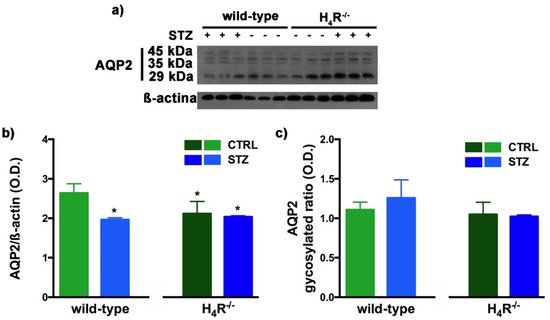
Figure 10. Comparison of AQP2 expression between wild-type and H4R−/− mice. Representative radiograph of AQP2 in kidney tissue determined by immunoblotting (a); The densitometric analysis of the AQP2 overall content was performed, and expression levels normalized to β-actin are expressed as the mean ± S.E.M. of 3 animals/group (b); The glycosylation ratio was evaluated and was expressed as the mean ± S.E.M. of 3 animals/group (c); * p < 0.05 vs. wild-type.
The Western blot analysis of AQP2 again detected a multi-band profile with one band at about 45 kDa, two at about 35 kDa, and the last at 29 kDa (Figure 10a). This spectrum is again compatible with AQP2 glycosylation, which determines its localization at the level of the apical membrane of the main cells of the collecting duct [20]. As shown in Figure 10b, a significant reduction in the expression of AQP2 was observed not only in H4R−/− mice but also in both diabetic wild-type and H4R−/− animals. However, no differences in the glycosylation ratio were registered (Figure 10c). The AQP pattern evaluation data collectively suggest that histamine could regulate the renal water balance through the H4 receptor.
5. NKCC1 Expression in Wild-Type and H4R−/− Mice
With NKCC1, being a key cotransporter in the kidney, we also evaluated its expression. More precisely, we investigated the expression of the NKCC1 cotransporter, the form that is widely distributed throughout the body but especially abundant in the kidney. Like AQP-2, NKCC1 is expressed on the outer medullary collecting duct but on the α-intercalated cells [21]. As shown in Figure 11, the immunohistochemistry analysis revealed a reduced basal expression of NKCC1 in H4R−/− animals compared to their wild-type counterpart.
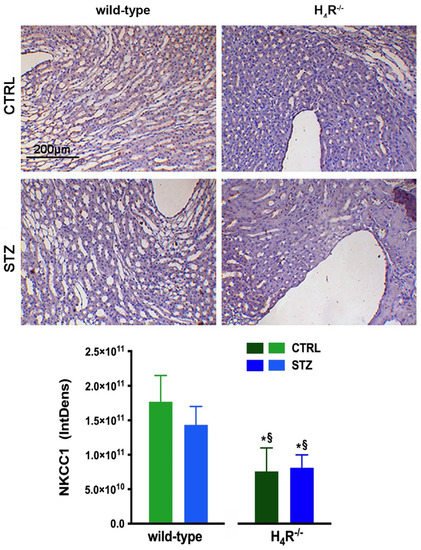
Figure 11. Comparison of NKCC1 expression between wild-type and H4R−/− mice. Micrographs at 20× magnification of transverse kidney sections, immunolabeled with specific anti-NKCC1 antibody. Densitometric analysis of NKCC1 expression was determined by color deconvolution analysis. Expression levels over control are expressed as the mean (IntDen) ± S.E.M. (n = 10); * p < 0.05 vs. wild-type; § p < 0.05 vs. STZ wild-type.
References
- Pini, A.; Grange, C.; Veglia, E.; Argenziano, M.; Cavalli, R.; Guasti, D.; Calosi, L.; Ghè, C.; Solarino, R.; Thurmond, R.L.; et al. Histamine H4 receptor antagonism prevents the progression of diabetic nephropathy in male DBA2/J mice. Pharmacol. Res. 2018, 128, 18–28.
- Neumann, D.; Schneider, E.H.; Seifert, R. Analysis of histamine Receptor Knockout Mice in Models of Inflammation. J. Pharmacol. Exp. Ther. 2014, 348, 2–11.
- Hofstra, C.L.; Desai, P.J.; Thurmond, R.L.; Fung-Leung, W.-P. Histamine H4 Receptor mediates Chemotaxis and Calcium Mobilization of Mast Cells. J. Pharmacol. Exp. Ther. 2003, 305, 1212–1221.
- Dunford, P.J.; O’Donnell, N.; Riley, J.P.; Williams, K.N.; Karlsson, L.; Thurmond, R.L. The Histamine H4 receptor Mediates Allergic Airway Inflammation by Regulating the Activation of CD4+ T Cells. J. Immunol. 2006, 176, 7062–7070.
- Dunford, P.J.; Williams, K.N.; Desai, P.J.; Karlsson, L.; McQueen, D.; Thurmond, R. Histamine H4 receptor antagonists are superior to traditional antihistamines in the attenuation of experimental pruritus. J. Allergy Clin. Immunol. 2007, 119, 176–183.
- Hartwig, C.; Munder, A.; Glage, S.; Wedekind, D.; Schenk, H.; Seifert, R.; Neumann, D. The histamine H4-receptor (H4R) regulates eosinophilic inflammation in ovalbumin-induced experimental allergic asthma in mice. Eur. J. Immunol. 2014, 45, 1129–1140.
- Rossbach, K.; Schaper, K.; Kloth, C.; Gutzmer, R.; Werfel, T.; Kietzmann, M.; Bäumer, W. Histamine H4 receptor knockout mice display reduced inflammation in a chronic model of atopic dermatitis. Allergy 2015, 71, 189–197.
- Schirmer, B.; Bringmann, L.; Seifert, R.; Neumann, D. In vivo evidence for Partial Activation of Eosinophils via the Histamine H4-Receptor: Adoptive Transfer Experiments Using Eosinophils from H4R−/− and H4R+/+ Mice. Front. Immunol. 2018, 9, 2119.
- Sanna, M.D.; Ghelardini, C.; Thurmond, R.; Masini, E.; Galeotti, N. Behavioural phenotype of Histamine H4 receptor knockout mice: Focus on central neuronal functions. Neuropharmacology 2017, 114, 48–57.
- Sterle, H.; Nicoud, M.B.; Massari, N.A.; Delgado, M.A.T.; Ducloux, M.V.H.; Cremaschi, G.A.; Medina, V.A. Immunomodulatory role of Histamine H4 receptor in breast cancer. Br. J. Cancer 2018, 120, 128–138.
- Pini, A.; Obara, I.; Battell, E.; Chazot, P.L.; Rosa, A.C. Histamine in diabetes: Is it time to reconsider? Pharmacol. Res. 2016, 111, 316–324.
- Grange, C.; Gurrieri, M.; Verta, R.; Fantozzi, R.; Pini, A.; Rosa, A.C. Histamine in the kidneys: What is its role in renal pathophysiology? Br. J. Pharmacol. 2020, 177, 503–515.
- Chow, B.S.; Allen, T.J. Mouse models for Studying Diabetic Nephropathy. Curr. Protoc. Mouse Biol. 2015, 5, 85–94.
- De, S.; Kuwahara, S.; Saito, A. The endocytic Receptor Megalin and its Associated Proteins in Proximal Tubule Epithelial Cells. Membranes 2014, 4, 333–355.
- Girardi, A.; Di Sole, F. Deciphering the mechanisms of the Na+/H+ exchanger-3 regulation in organ dysfunction. Am. J. Physiol. Physiol. 2012, 302, C1569–C1587.
- Azad, A.K.; Raihan, T.; Ahmed, J.; Hakim, A.; Emon, T.H.; Chowdhury, P.A. Human aquaporins: Functional diversity and Potential Roles in Infectious and Non-infectious Diseases. Front. Genet. 2021, 12, 654865.
- Maunsbach, A.B.; Marples, D.; Chin, E.; Ning, G.; Bondy, C.; Agre, P.; Nielsen, S. Aquaporin-1 water channel expression in human kidney. J. Am. Soc. Nephrol. 1997, 8, 1–14.
- Chen, X.-F.; Li, C.-F.; Lu, L.; Mei, Z.-C. Expression and clinical significance of aquaglyceroporins in human hepatocellular carcinoma. Mol. Med. Rep. 2016, 13, 5283–5289.
- Su, W.; Cao, R.; Zhang, X.; Guan, Y. Aquaporins in the kidney: Physiology and pathophysiology. Am. J. Physiol. Physiol. 2020, 318, F193–F203.
- Hendriks, G.; Koudijs, M.; van Balkom, B.W.M.; Oorschot, V.; Klumperman, J.; Deen, P.M.T.; van der Sluijs, P. Glycosylation is Important for Cell Surface Expression of the Water Channel Aquaporin-2 but Is Not Essential for Tetramerization in the Endoplasmic Reticulum. J. Biol. Chem. 2004, 279, 2975–2983.
- Wall, S.M.; Fischer, M.P. Contribution of the Na+-K+-2Cl− Cotransporter (NKCC1) to transepithelial Transport of H+, NH4+, K+, and Na+ in Rat Outer Medullary Collecting Duct. J. Am. Soc. Nephrol. 2002, 13, 827–835.
More
Information
Subjects:
Allergy
Contributor
MDPI registered users' name will be linked to their SciProfiles pages. To register with us, please refer to https://encyclopedia.pub/register
:
View Times:
1.0K
Revisions:
2 times
(View History)
Update Date:
21 Oct 2021
Table of Contents


Notice
You are not a member of the advisory board for this topic. If you want to update advisory board member profile, please contact office@encyclopedia.pub.
OK
Confirm
Only members of the Encyclopedia advisory board for this topic are allowed to note entries. Would you like to become an advisory board member of the Encyclopedia?
Yes
No
${ textCharacter }/${ maxCharacter }
Submit
Cancel
Back
Comments
${ item }
|
${ item.createdUser.fullName }
${ item.createdAt }
${ item.vote }
${ item.reply }
Delete
${ reply.createdUser.fullName }
${ reply.createdAt }
${ reply.vote }
Delete
There is no reply to this comment~
${ item.replyTextCharacter }/${ item.replyMaxCharacter }
Submit
Cancel
More
No more~
There is no comment~
${ textCharacter }/${ maxCharacter }
Submit
Cancel
${ selectedItem.replyTextCharacter }/${ selectedItem.replyMaxCharacter }
Submit
Cancel
Confirm
Are you sure to Delete?
Yes
No