 +1 credit
| Version | Summary | Created by | Modification | Content Size | Created at | Operation |
|---|---|---|---|---|---|---|
| 1 | Daniel Salvador | + 2770 word(s) | 2770 | 2020-06-01 11:34:03 | | | |
| 2 | Rita Xu | -926 word(s) | 1844 | 2020-06-29 11:00:48 | | | | |
| 3 | Rita Xu | -2 word(s) | 1842 | 2020-10-27 04:09:42 | | |
Video Upload Options
Hepatitis E virus (HEV) is a non-enveloped single-stranded positive-sense RNA virus, belonging to the Hepeviridae family, resistant to environmental conditions, and transmitted by the consumption of contaminated water. This virus is responsible for both sporadic and epidemic outbreaks, leading to thousands of infections per year in several countries, and is thus considered an emerging disease in Europe and Asia. This study refers to a survey in Portugal during 2019, targeting the detection and eventual quantification of enteric viruses in samples from surface and drinking water. Samples positive for HEV RNA were recurrently found by reverse transcription quantitative PCR (RT-qPCR), in both types of matrix. Our results evidenced the existence of samples positive either for HEV RNA (77.8% in surface water and 66.7% in drinking water) or for infectious HEV (23.0% in surface water and 27.7% in drinking water). These results highlight the need for effective virological control of water for human consumption and activities.
The sampling points of surface water were in a river and in a dam reservoir. Two sampling points of drinking water were located at the end of the treatment process in two water treatment plants (WTPs) and another one, at one point in the water distribution network. WTP_R treats surface water from the river and WTP_D treats surface water from the dam reservoir.
1. HEV RNA in Surface Water Samples
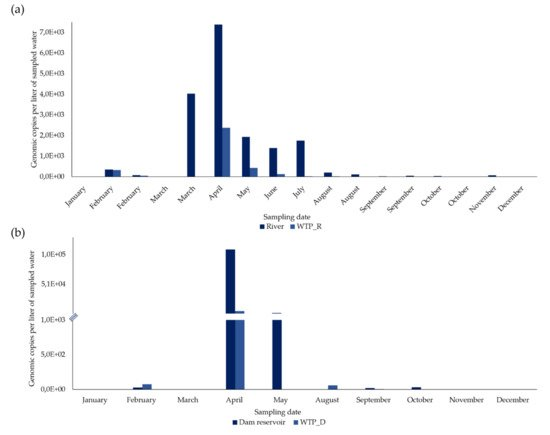
From 27 concentrated samples from surface water, HEV RNA was detected and quantified in 21 (77.8%) (Figure 1 and Figure 2).
In the river, in February, March, August, September, and October, two sampling campaigns were carried out (in the first and second half of each month) and, of the 17 concentrated samples, 15 (88.2%) were positive for HEV RNA (Figure 2a). HEV RNA was detected in 11 of the 12 months of the campaign, in concentrations fluctuating between 0 and 7383.2 gc/L, with a maximum in April (7383.2 gc/L) and a very sharp decrease from August to December (Figure 1a).
In the 10 concentrated surface water samples from the dam reservoir, HEV RNA was detected in six (60%) (Figure 1b). HEV RNA was detected and quantified in concentrations ranging between 0 and 10,9687.5 gc/L (the highest concentration, which was in April), with a concentration lower than 2411.9 gc/L in the remaining months (Figure 1b).
2. HEV RNA in Drinking Water Samples
From 36 samples of concentrated drinking water, HEV RNA was detected and quantified in 24 (66.7%) (Figure 1 and Figure 2).
In WTP_R, two sampling campaigns were carried out in February, March, August, September, and October (in the first and second half of each month). HEV RNA was detected in 11 out of 17 concentrated samples (64.7%) (Figure 1a), presenting its highest concentration (2,379.3 gc/L) in April, which then declined sharply to 0. It was not detected in January, March (first and second half), August and October (second half in both months), and December.
In the 10 concentrated drinking water samples from WTP_D, HEV RNA was detected in five (50%), corresponding to five months (Figure 1b) and was not detected in January, March, May, November, and December. From 75.151 gc/L detected in February and a maximum concentration of 5617.1 gc/L reached in April, HEV RNA concentrations significantly decreased, presenting values between 58.725 gc/L to no detection, from May to December.
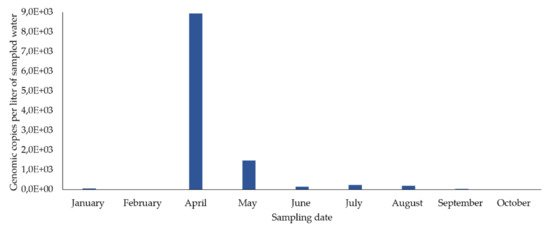
In the concentrated samples of drinking water from the sampling point in the distribution network, HEV RNA was detected in eight out of nine samples (88.9%) (eight months) (Figure 2), in concentrations fluctuating between 5645 and 8926.6 gc/L. The highest concentration occurred in April and then decreased until December. It was not detected in February.
3. Evaluation of the Efficacy of Water Treatment Plants (WTPs) in HEV RNA Elimination
3.1. River vs WTP_R
In January and the first half of March, HEV RNA was not detected either in the surface water of the river or in its treated drinking water from WTP_R. Along the remaining months (15 sampling dates), HEV RNA was detected in the river, always in higher concentrations than in the WTP_R (9.8–100% reduction, as shown in Table 2). The lowest reduction values were obtained in February (9.8 and 37%, in the first and in the second half, respectively), while the highest values (100%) were obtained in the second half of March, August, October, and December; values higher than 87.6% were obtained in the first half of these months. High reduction values (>90%) were also obtained in four other situations (June, July, and in the first and second half of September), while intermediate values were obtained in the remaining comparisons (77.9 and 67.8%, in May and April, respectively). There were statistically significant differences in the concentrations of HEV RNA between samples from the river and from WPT_R, i.e., between non-treated and treated water samples (Student’s t-test, p < 0.05).
3.2. Dam Reservoir vs WTP_D
In January, March, and December, HEV RNA was not detected either in surface water from the dam reservoir or in its treated drinking water from WTP_D, and in February and June, there was no reduction with the treatment. However, a reduction of 73.3% was observed in September and a reduction of over 94.9% in April, May, October, and November (Table 2). There were no statistically significant differences in the concentrations of HEV RNA between samples from the dam reservoir and from WTP_D, i.e., between non-treated and treated water samples (Student’s t-test, p > 0.05).
Table 2. Quantification of HEV RNA in concentrated samples from surface water sources and their associated water treatment plants, and evaluation of the treatment efficacy (reduction in RNA copies).
| Date | HEV Concentration (gc/L) | Reduction (%) after Treatment | HEV Concentration (gc/L) | Reduction (%) after Treatment | ||
|---|---|---|---|---|---|---|
| River | WTP_R | Dam Reservoir | WTP_D | |||
| January | 0 | 0 | * | 0 | 0 | * |
| February, first half | 355.5 | 320.8 | 9.8 | - | - | - |
| February, second half | 78.2 | 49.3 | 37.0 | 29.1 | 75.2 | NR |
| March, first half | 0 | 0 | * | - | - | - |
| March, second half | 4,029.1 | 0 | 100 | 0 | 0 | * |
| April | 7,383.1 | 2,379.3 | 67.8 | 109,687.5 | 5,617.1 | 94.9 |
| May | 1,936.5 | 428.0 | 77.9 | 2,412 | 0 | 100 |
| June | 1,394.9 | 126.0 | 91.0 | 0 | 58.7 | NR |
| July | 1,755.0 | 22.0 | 98.7 | - | - | - |
| August, first half | 206.5 | 24.2 | 88.3 | - | - | - |
| August, second half | 113.3 | 0 | 100 | - | - | - |
| September, first half | 23.3 | 1.9 | 91.9 | - | - | - |
| September, second half | 55.1 | 5.0 | 90.9 | 19.5 | 5.2 | 73.3 |
| October, first half | 36.3 | 4.5 | 87.6 | - | - | - |
| October, second half | 2.7 | 0 | 100 | 30.4 | 0.7 | 97.6 |
| November | 69.9 | 4.8 | 93.1 | 0.7 | 0 | 100 |
| December | 2.1 | 0 | 100 | 0 | 0 | * |
4. Discussion
This study followed a complex and complete approach in order to assess the presence of HEV, starting from high volumes of water and combining, in the same procedure, the possibility to detect viral RNA by RT-qPCR as well as evaluate infectivity (Entry 2_HEV infectivity in water samples). Other methods are limited to a maximum starting volume of five liters of water, as described in ISO 15216-1:2017 [1][2], but EPA Method 1615 of the United States Environmental Protection Agency [3], which supported this experimental protocol, is based on the collection of much larger volumes, making the results more reliable [4][5].
This one-year survey evaluated the presence of HEV in concentrated samples from two bodies of water (a river and a dam reservoir) and from the drinking water sampled on their water treatment plants (WTP_R and WTP_D, respectively) at the end of the treatment process.
HEV was detected in concentrated samples from the two bodies of water. Comparing the two bodies of water, the river showed a greater number of positive samples for HEV RNA (88,2%) than the dam reservoir (60%). On the other hand, in both, the maximum concentration (>100,000 gc/L, in the dam reservoir) occurred in April (Spring in Portugal) and decreased until December. The maximum concentrations in April can be explained by the pattern of precipitation in Portugal, as described for Colombia [6]. In April 2019, rainfall was high, the fifth rainiest April since 2000 [7] and, associated with more precipitation, a greater runoff of possible contaminants from the surrounding areas may have disturbed these water bodies [8]. Many of the areas surrounding the sampling sites are places of agriculture and animal production [9], where manure from animal production activities is still used as fertilizer. It is well known that pigs are reservoirs of HEV, which is excreted in feces, and might thus be the possible origin of water contamination [10][11][12].
In drinking water, HEV RNA was also detected, although in a smaller number of concentrated water samples (64.7% in WTP_R, and 50.0% in WTP_D) than was observed in the bodies of water, as also found in Switzerland [13]. After analyzing the concentrated samples of drinking water from the two WTPs and from a point in the distribution network, there was an identical pattern: the peak HEV RNA concentration was detected in April, and subsequently decreased until the end of the year. These results are in complete accordance with what was previously described for the bodies of water that feed these WTPs and the point in the distribution network. Likewise, the highest HEV RNA concentrations were found in two related water matrices: the dam reservoir and WTP_D.
High values of genomic copies per liter found in several samples of natural water may also be attributed to the large volumes sampled. These large volumes were considered necessary to recover enough viruses to allow a reliable quantification based on the low levels of enteric viruses often reported for natural waters.
Regarding the efficacy of the WTPs in reducing HEV, based only on genome copies, this was observed in both situations, but only with statistically significant differences in WTP_R. Differences in the water volumes sampled in the two types of matrix, evidenced in Table 1, may explain less marked differences. Differences found in the two WTPs concerning efficacy in eliminating viruses may also be attributed to difficulties related to the manipulation of the sample during the various stages of filtration and concentration, including the characteristics of each water matrix. Moreover, the values obtained by RT-qPCR cannot be interpreted as absolute, since there are many steps in the experimental procedures that may lead to RNA degradation [5]. In any case, these results may indicate that the treatment at WTP_R, including pre-oxidation with ozone, adsorption with coal and disinfection with chlorine, may be more effective in the elimination of this virus than WTP_D, which uses neither ozone nor adsorption with coal [6][14][15]. Ozone may be crucial in the control of viruses in water, as found in other studies [16][17], concerning the elimination of enteric viruses and bacteriophages. However, more studies will be needed to confirm this statement.
Finally, climate change will certainly increase the frequency of pathogens in water systems worldwide, whether due to the occurrence of floods, sewage contamination or the scarcity of safe drinking water sources [18]. In this context and considering the results obtained in this study, monitoring the presence of HEV and other viruses in water supply and distribution systems is advisable. A similar approach should be conducted, increasing the sampling effort and implementing the application of the quantitative microbial risk assessment (QMRA) [19].
References
- ISO. International Standard-Microbiology of the Food Chain—Horizontal Method for Determination of Hepatitis A Virus and Norovirus; ISO Copyright Office: Geneva, Switzerland, 2017.
- Pedro Teixeira; Sílvia Costa; Bárbara Brown; Susana Silva; Raquel Rodrigues; Elisabete Valério; Quantitative PCR Detection of Enteric Viruses in Wastewater and Environmental Water Sources by the Lisbon Municipality: A Case Study. Water 2020, 12, 544, 10.3390/w12020544.
- Fout, G.S.; Brinkman, N.E.; Cashdollar, J.L.; Griffin, M.; McMinn, B.R.; Rhodes, E.R.; Varughese, E.A.; Karim, M.R.; Grimm, A.C.; Spencer, S.K; et al. Method 1615-Measurement of Enterovirus and Norovirus Occurrence in Water by Culture and RT-qPCR. JoVE 2016, 107, 1–13.
- G. Shay Fout; Jennifer L. Cashdollar; Eunice A. Varughese; Sandhya U. Parshionikar; Ann C. Grimm; EPA Method 1615. Measurement of enterovirus and norovirus occurrence in water by culture and RT-qPCR. I. Collection of virus samples. Journal of Visualized Experiments 2016, 107, 1–13, 10.3791/52067.
- Eiji Haramoto; Masaaki Kitajima; Akihiko Hata; Jason R. Torrey; Yoshifumi Masago; Daisuke Sano; Hiroyuki Katayama; A review on recent progress in the detection methods and prevalence of human enteric viruses in water. Water Research 2018, 135, 168-186, 10.1016/j.watres.2018.02.004.
- Paula A. Baez; Maria Camila Lopez; Alejandra Duque-Jaramillo; Dioselina Pelaez; Francisco Molina; Maria-Cristina Navas; First evidence of the Hepatitis E virus in environmental waters in Colombia. PLOS ONE 2017, 12, 1–16, 10.1371/journal.pone.0177525.
- Instituto Português do Mar e da Atmosfera. Resumo Climatológico Preliminar 1 a 29 Abril de 2019. Available online: https://www.ipma.pt/resources.www/docs/im.publicacoes/edicoes.online/20190503/IsNqBQXrKBtUkblVoGQA/cli_20190401_20190430_pcl_mm_co_pt.pdf (accessed on 25 March 2020).
- Sunny C. Jiang; W. Chu; PCR detection of pathogenic viruses in southern California urban rivers. Journal of Applied Microbiology 2004, 97, 17-28, 10.1111/j.1365-2672.2004.02269.x.
- Pordata-Valor da Produção Agrícola: Total e Por Tipo. Available online: https://www.pordata.pt/Municipios/Valor+da+produção+agrícola+total+e+por+tipo-956 (accessed on 26 March 2020).
- Harrison, L.; DiCaprio, E; Hepatitis E Virus: An Emerging Foodborne Pathogen. Front. Sustain. Food Syst. 2018, 2, 1–9.
- Dalton, H.R.; Seghatchian, J; Hepatitis E virus: Emerging from the shadows in developed countries. Transfus. Apher. Sci. 2016, 55, 271–274.
- Martin-latil, S.; Hennechart-collette, C.; Delannoy, S.; Guillier, L; Quantification of Hepatitis E Virus in Naturally-Contaminated Pig Liver Products. Front. Microbiol. 2016, 7, 1–10.
- Wang, H.; Kjellberg, I.; Sikora, P.; Rydberg, H.; Lindh, M.; Bergstedt, O.; Norder, H; Hepatitis E virus genotype 3 strains and a plethora of other viruses detected in raw and still in tap water. Water Res. 2020, 168, 1–9.
- R. Girones; Anna Carratalà; Byron Calgua; Miquel Calvo; Jesus Rodriguez-Manzano; Suzanne Emerson; Chlorine inactivation of hepatitis E virus and human adenovirus 2 in water. Journal of Water and Health 2014, 12, 436-442, 10.2166/wh.2014.027.
- Laura Guerrero-Latorre; Eloy Gonzales-Gustavson; Ayalkibet Hundesa; Regina Sommer; Girones Rosina; UV disinfection and flocculation-chlorination sachets to reduce hepatitis E virus in drinking water. International Journal of Hygiene and Environmental Health 2016, 219, 405-411, 10.1016/j.ijheh.2016.04.002.
- Eunkyung Shin; Jin Seok Kim; Kyungwhan Oh; Sung Suck Oh; MunJu Kwon; Soojin Kim; Jungsun Park; Hyo-Sun Kwak; Gyung Tae Chung; Chul-Joong Kim; et al.Junyoung Kim A waterborne outbreak involving hepatitis A virus genotype IA at a residential facility in the Republic of Korea in 2015. Journal of Clinical Virology 2017, 94, 63-66, 10.1016/j.jcv.2017.07.006.
- Mi Young Lim; J.-M. Kim; Jung Eun Lee; GwangPyo Ko; Characterization of Ozone Disinfection of Murine Norovirus. Applied and Environmental Microbiology 2010, 76, 1120-1124, 10.1128/aem.01955-09.
- Pedro Teixeira; Daniel Salvador; João Brandão; Warish Ahmed; Michael J. Sadowsky; Elisabete Valério; Environmental and Adaptive Changes Necessitate a Paradigm Shift for Indicators of Fecal Contamination. Microbiology Spectrum 2020, 8, 1–20, 10.1128/microbiolspec.erv-0001-2019.
- WHO. Quantitative Microbial Risk Assessment: Application for Water Safety Management. WHO Press: Geneva, Switzerland, 2016; pp. 1–187.


