This study revealed high levels of circulating complement factor C1q of the participants, placing C1q as a key molecule to identify an myalgic encephalomyelitis/chronic fatigue syndrome (ME/CFS) subtype/subgroup with more apparent pain symptoms.
1. Introduction
Myalgic encephalomyelitis/chronic fatigue syndrome (ME/CFS) constitutes a serious health problem that truncates the life of millions of people and their families around the world [1,2,3]. ME/CFS is a chronic condition characterized by profound fatigue which is exacerbated by physical/mental and emotional activity (also known as PEM; post-exertional malaise), lack of refreshing sleep and dysautonomia, and multiple additional comorbidities [4]; its diagnosis still solely relies on clinical symptom assessment [5,6,7] after ruling out potential subjacent illness that could explain patient´s symptoms.
Despite a number of studies aimed at evidencing routine clinical parameters that may be useful, at least for the suspicion of an ME/CFS case, few are the differences that have been reported [8]. For example, Nacul et al. found significantly lower median values of serum creatine kinase (CK) in severely ill patients compared to healthy controls (HCs) and non-severe ME/CFS (median = 54, 101.5, and 84 U/L, respectively) [9], a finding confirmed by two additional studies [10,11]. While CK differences may be derived from patient sedentarism itself, some potential differences, including the levels of alkaline phosphatase, free T4 levels, or eosinophil counts, detected at lower significance (p < 0.1) in small cohorts (n = 15/group) [10] deserve further exploration in larger cohorts, individually or in combination with others.
Blood factors differentially altered in ME/CFS subgroups may constitute valuable tools in the clinic for achieving improved patient treatments, particularly for precision medicine purposes, while they may also serve to minimize patient heterogeneity in research studies. Unveiling the nature of ME/CFS, in fact, might well depend on homogeneous patient subset assessment, boosting the statistical robustness of data.
Therefore, in the current study, we aimed at identifying clinical parameters that differentiate ME/CFS case subgroups by themselves or in relation to symptom severity, in a large cohort of female ME/CFS cases (n = 250), with potential therapeutic and/or research purposes.
2. Demographics and Clinical Characteristics of the Participants
This prospective observational study included 250 adult females diagnosed with ME/CFS by 1994 CDC/Fukuda and 2003 CCC
[1][2], the analysis of 69 laboratory blood tests, demographic variables, and four validated self-reported questionnaires to assess disease severity and comorbidities
[3][4][5][6]. In addition, cardiac variables and medication prescriptions were also recorded (
Supplementary Table S1).
Table 1 shows the descriptive parameters of the study participants. The average age of participants was 45.9 ± 7.02 years, 11.6% (29/250) presented obesity (BMI ≥ 30), fitting with the 13% assessed for the general population
[7], average heart rate was 78.5 ± 10.3 bpm, and systolic and diastolic blood pressure were 125.8 ± 2.5 and 76.3 ± 1.6 mmHg, respectively, among participants. The overall FIS-40 score range reflected the presence of participants with different degrees of fatigue severity. The vast majority of participants had a severe fatigue score (98.8%) while only 1.2% had mild/moderate fatigue, as assessed by the FIS-40 questionnaire provided to the study participants. In addition, over 50% of subjects were taking at least more than one medication as usual/routine care treatment (
Table 1).
Table 1. Demographics and clinical characteristics of participants at baseline. Data are expressed as the mean ± standard deviation (SD) for continuous variables and compared by Student t-test, whereas categorical variables are given as numbers with percentages (%) and compared by Fisher’s exact test.
| Variables |
ME/CFS (n = 250) |
| Age, years |
45.9 ± 7.02 |
| BMI, kg/m2 † |
24.5 ± 4.72 |
| SBP, mmHg |
125.8 ± 2.5 |
| DBP (mmHg) |
76.3 ± 1.6 |
| Medication, n (%) |
|
| NSAIDs |
9 (42.9) |
| Hypnotics |
5 (23.8) |
| Antidepressants |
6 (28.6) |
| Antipsychotics |
4 (19.0) |
| Opioids |
11 (52.4) |
| Measures |
|
| FIS-40 |
|
| Global score (0–160) |
|
| Physical |
35.4 ± 2.4 |
| Cognitive |
34.0 ± 3.4 |
| Psychosocial |
63.9 ± 2.4 |
| COMPASS-31 |
|
| Global score (0–100) |
53.6 ± 3.5 |
| Orthostatic intolerance |
24.3 ± 2.1 |
| Vasomotor |
1.4 ± 2.7 |
| Secretomotor |
9.3 ± 3.4 |
| Gastrointestinal |
11.6 ± 2.9 |
| Bladder |
3.5 ± 4.1 |
| Pupillomotor |
3.7 ± 3.4 |
| PSQI |
|
| Global score (0–21) |
14.0 ± 0.7 |
| Subjective sleep quality |
1.9 ± 0.1 |
| Sleep latency |
2.2 ± 0.1 |
| Sleep duration |
1.5 ± 0.1 |
| Habitual sleep efficiency |
1.9 ± 0.2 |
| Sleep disturbances |
2.4 ± 0.1 |
| Sleeping medication |
1.9 ± 0.2 |
| Daytime dysfunction |
2.2 ± 0.1 |
| SF-36 |
|
| Physical functioning |
26.9 ± 0.6 |
| Physical role |
3.7 ± 0.81 |
| Bodily pain |
16.2 ± 1.55 |
| General health perception |
21.3 ± 2.18 |
| Vitality |
17.0 ± 1.58 |
| Social role functioning |
28.2 ± 1.87 |
| Emotional role functioning |
30.5 ± 2.78 |
| Mental health |
41.4 ± 3.12 |
3. Exploratory Case Cluster Analysis Based on Symptoms
After applying unbiased hierarchical clustering and optimal grouping based on k-means screenings to identify case clusters, as detailed in
Section 2, a set of three clusters showing significant differences in their total FIS-40, total COMPASS-31, total PSQI, physical functioning, and bodily pain scores was obtained (
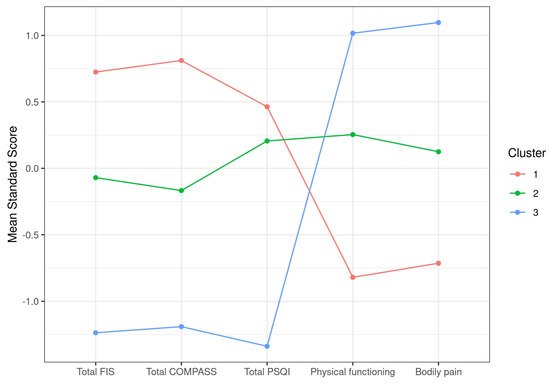
Table 2). Plotting of the itemized standard score differences clearly illustrated the inverse distribution between scales of total FIS-40, total COMPASS-31, and total PSQI that attribute higher scores to more severe symptoms and SF-36 subscales that do the opposite. As a result, our cohort of 250 cases was subdivided into cluster 1, including cases showing more severe symptoms in all five selected parameters (
n = 94), cluster 2 with cases presenting moderate affection (
n = 107), and a smaller group of only 49 individuals with milder symptoms (cluster 3) (
Figure 1). This shows that the cohort studied mostly contained severe to moderate cases, with < 20% of mildly affected cases. The definition of severe in cluster 1 involves total FIS-40 scores over 145 on average, scores over 65 for total COMPASS-31, scores over 15 on average for PSQI, and the lowest scores for physical functioning and bodily pain, which may translate into a more severe fatigue phenotype, accompanied by dysautonomia and sleep problems while experiencing higher levels of pain and compromised physical functioning than the other two clusters (
Table 2,
Figure 1).
Figure 1. Graphic representation of ME/CFS clustering according to symptom standard mean scores.
Table 2. Clustering of ME/CFS cases according to symptom differences, as supported by k-means analysis. Data are presented as the mean ± SD for each item. Physical functioning and bodily pain were evaluated by two items of the 36-item Short-Form Health Survey (SF-36).
| |
Cluster 1 |
Cluster 2 |
Cluster 3 |
p-Value |
| Total FIS |
147.93 (9.88) |
131.79 (13.48) |
108.1 (21.83) |
<0.0001 |
| Total COMPASS |
66.82 (10.52) |
50.9 (10.77) |
34.26 (12.71) |
<0.0001 |
| Total PSQI |
15.82 (3.4) |
14.75 (2.94) |
8.33 (2.78) |
<0.0001 |
| Physical functioning |
12.82 (8.82) |
31.27 (12.75) |
44.39 (16.79) |
<0.0001 |
| Bodily pain |
6.3 (7.77) |
17.95 (11.79) |
31.45 (11.83) |
<0.0001 |
| Size |
94 |
107 |
49 |
|
4. Cluster-Based Differential Analysis of Blood Parameters
Next, we assessed potential differences in the blood analytical variables of these three clusters of cases (clusters 1, 2, and 3, as defined above) using univariate analyses (see
Section 2 for details). The analyses intended to detect blood parameters within normal reference range values presented significant differences across case groups (clusters) and may, therefore, be associated with case symptoms. The statistical analysis detected five blood parameters fulfilling the requirements, with
p-values < 0.05 (
Table 3).
Table 3. Blood analytic differences between symptom-based case clusters. Data are presented as mean ± (SD) for each biochemical variable.
| |
Cluster 1 |
Cluster 2 |
Cluster 3 |
p-Value |
| Hb (g/dL) |
13.16 (1.05) |
13.57 (0.94) |
13.07 (1.12) |
0.0033 |
| NT (×109 |
| /L) |
3.99 (1.65) |
3.58 (1.63) |
3.3 (1.48) |
0.0365 |
| COL (mg/dL) |
229.57 (36.69) |
216.6 (37.42) |
211.84 (33.73) |
0.0077 |
| HDL (mg/dL) |
64.71 (14.44) |
59.71 (12.48) |
63.12 (12.65) |
0.0292 |
| C3 (mg/dL) |
132.32 (24.65) |
132.02 (29.96) |
119.89 (28.09) |
0.0246 |
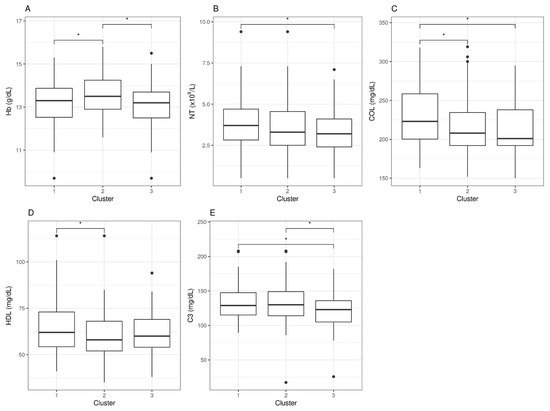
However, when looking at statistical differences between individual pair sets, we found that none of these five parameters could individually differentiate clusters 1, 2, and 3. For hemoglobin (Hb) levels, only the moderate group (cluster 2) differentiated from the other two, an observation with unclear physiologic interpretation. For neutrophil counts (NT), differences were found between severe (cluster 1) and mild (cluster 3) cases, but none were detected for the moderate group. For cholesterol levels (COL), severe cases (cluster 1) presented differences with moderate and mild (clusters 2 and 3), with no differences between the latter two, whereas high-density lipoproteins (HDL) differences appeared between clusters 1 and 2, but not with cluster 3. Lastly, the levels of complement factor 3 (C3) presented differences between the severe and mild clusters, as well as between the mild and the moderate, but no differences were detected between the severe and the moderate clusters, indicating potential value as a marker to differentiate mild cases from the rest (Figure 2).
Figure 2. Blood analytic difference boxplots between ME/CFS symptom-based clusters. Abbreviations: Hb, hemoglobin; NT, neutrophil counts; COL, cholesterol; HDL, high-density lipoprotein; C3, complement 3. The significance level was set at *p < 0.05. Data beyond 1.5 inter-quartile range values, representing potential outliers, are plotted as individual dots.
In conclusion, symptom-based case clustering followed by differential blood analytics was inefficient for detecting robust single blood variables correlated with case health severity, as defined in these three clusters. It is, however, interesting that some of these blood parameters could, to some extent, differentiate between clusters, the significance of which is not understood at present.
5. Stratified Analysis
As an additional attempt to detect patient subgroups that could help refine current diagnosis methods, we evaluated sets of cases presenting abnormal blood parameter values for stratification purposes.
5.1. Outstanding Blood Parameters with Abnormal Values
Top analytic variable values deviating from established healthy population reference ranges were vitamin D (60.4%) mostly represented by deficiency, LDL (55.6%), complement factor C1q (42.8%), and cholesterol (26.4%), all showing increased values overall. Platelet means volume values appeared both increased and decreased (
Table 4 and
Supplementary Figure S1).
Table 4. Top blood analytic variables showing abnormal values with respect to reference values in our cohort (n = 250). The number of cases with abnormal values with respect to reference values and percentages (%) is shown.
| Variables |
n (%) |
| 25(OH) Vitamin D3 |
151 (60.4) |
| LDL |
140 (56.0) |
| C1q |
107 (42.8) |
| 25(OH) Vitamin D3, LDL |
81 (32.4) |
| 25(OH) Vitamin D3, C1q |
72 (28.8) |
| COL |
66 (26.4) |
| C1q, LDL |
60 (24.0) |
| COL, LDL |
58 (23.2) |
| PMV |
56 (22.4) |
Combinations of these five blood analytical variables which included at least 20% of the cases in our cohort showed that vitamin D and LDL were both abnormal in 32.4% of the participants. Other combinations, such as vitamin D deficiency and increment of C1q, or increased LDL with C1q or cholesterol involved over 20% of the participants (> 50 cases). Since vitamin D reference values are widely influenced by genetic and environmental factors, and the assays to quantitate its levels typically show variability over ± 10%
[8][9], leading to a lack of consensus global reference values
[10][11], we decided to exclude this variable from our stratified downstream analysis.
Similarly, since differences found in LDL and cholesterol are nonspecifically associated with disease, sometimes appearing together with vitamin D deficiency
[10][11], they were not further pursued, meaning that they were not used to set stratification conditions of our cohort. The unexpected finding of a quite significant proportion of ME/CFS cases showing increased levels of C1q and decreased C1 inhibitor (42.8% and 8.8%, respectively) (
Supplementary Table S1), together with the C1q deficiency being associated with autoimmune diseases such as systemic lupus erythematosus
[12], motivated our interest to hypothesize C1q as a potential biomarker for ME/CFS subtyping.
5.2. Symptom Differences across C1q Case Clusters
Downstream analysis after a conservative 5% cutoff above C1q maximum normal value stratification (samples with C1q > 26.05 mg/dL, cluster 1, with n = 90; samples with C1q < 26.05 mg/dL, cluster 2, with n = 160), however, showed no significant differences in any symptom score, with the only exception of a tendency for bodily pain (p = 0.09), suggesting perhaps increased pain in the group with high C1q levels (mean values were 14.24 vs. 17.33, respectively) (Table 5).
Table 5. Symptom differences between case clusters with increased C1q values (cluster 1) (> 26.05 mg/dL) or within range (C1q < 26.05 mg/dL). Group mean values and standard deviations are shown.
| |
Cluster 1 |
Cluster 2 |
p-Value |
| Total FIS-40 |
132.6 (22.83) |
133.56 (18.81) |
0.7358 |
| Total COMPASS-31 |
54.96 (16.84) |
52.88 (15.94) |
0.3401 |
| Total PSQI |
14.29 (4.06) |
13.67 (4.21) |
0.2544 |
| Physical functioning |
27.5 (18.36) |
26.57 (16.56) |
0.6907 |
| Bodily pain |
14.24 (13.63) |
17.32 (13.95) |
0.0906 |
| Size |
90 |
160 |
|
5.3. Blood analytic Differences across C1q Case Clusters
To evaluate whether the group of cases presenting increased C1q levels (cluster 1,
n = 90) could, at the same time, present with additional blood parameter differences, even when being within normal reference values for the group showing normal C1q values (cluster 2,
n = 160), we applied a statistic test after cohort stratification, as detailed in
Section 2. The results showed significant differences in seven blood parameters (
p < 0.05), as shown in
Table 6.
Table 6. Blood analytic differences between C1q case clusters. Group means and standard deviations are shown.
| |
Cluster 1 |
Cluster 2 |
p-Value |
| RBC (×1012 |
| /L) |
4.62 (0.32) |
4.53 (0.38) |
0.0431 |
| PT (g/dL) |
7.24 (0.39) |
7.1 (0.42) |
0.0093 |
| IgG3/IgG |
6.29 (3.64) |
8.91 (13.47) |
0.0219 |
| IgG4/IgG |
2.75 (1.7) |
3.32 (2.56) |
0.0343 |
| C1inh (mg/dL) |
25.56 (5.28) |
27.56 (5.58) |
0.0055 |
| C3 (mg/dL) |
137.44 (27.47) |
125.43 (27.48) |
0.0011 |
| C4 (mg/dL) |
30.73 (8.57) |
27.7 (7.72) |
0.006 |
Overall, the cluster with increased C1q levels presented with higher red blood cell counts, as well as total protein, C3, and C4 levels, and lower IgG3, IgG4, and C1inh concentrations, indicating pathways potentially connected with elevated C1q levels and, thus, potentially relevant for clinical treatment of an important subset of ME/CFS cases.
6. Conclusions
In conclusion, it has been identified a potential new player in the ME/CFS pathology, the C1q component of the complement system, affecting over 40% of cases. This finding paves the way for exploring a C1q-based standard lab assay to detect ME/CFS subtypes with relevant clinical and research implications. The understanding of the underlying pathomechanisms behind this finding is limited at present, granting further exploration of the observation.
 +1 credit