 +1 credit
| Version | Summary | Created by | Modification | Content Size | Created at | Operation |
|---|---|---|---|---|---|---|
| 1 | Jasminka Ilich | + 6553 word(s) | 6553 | 2021-09-28 05:57:49 |
Video Upload Options
Osteosarcopenic adiposity (OSA), originally termed osteosarcopenic obesity (OSO), syndrome (both terms currently used interchangeably) describes the simultaneous deterioration of bone, muscle and adipose tissues, resulting in reduced functionality, systemic metabolic dis-regulation, and possibly exacerbating several other chronic diseases creating a vicious cycle. The key factors contributing to this syndrome are the excess of body fat and/or ectopic fat in the bone, muscle, and viscera, accompanied by the low-grade chronic inflammation, as well as ageing. However, it could also occur in younger individuals with some chronic diseases (like obesity, diabetes, cancer).
1. Introduction
The original osteosarcopenic obesity (OSO) concept paper outlining the whole body and cellular connections among the three tissues; bone, muscle and body fat, was published in 2014 along with the preliminary diagnostic criteria [1]. More refined diagnoses and some preliminary treatment modalities followed in subsequent papers [2][3]. Another update indicating the rationale for the change of the term from OSO into osteosarcopenic adiposity (OSA) and relating its origination and/or worsening in the presence of low-grade chronic inflamation (LGCI) was published recently [4]. Markedly, either of the terms, OSA or OSO, are in use in the current literature. One of the key elements of OSA is the linked nature of the syndrome; from its cellular connections to the deterioration of bone (osteopenia/osteoporosis), muscle (sarcopenia) and excess adipose tissue (overweight/obesity, including the redistribution of fat into the visceral area and adipogenesis in bone and muscle tissues) [1]. Osteopenia/osteoporosis, sarcopenia and overweight/obesity were once considered as separate conditions and were rarely studied together. The combination of two conditions, namely, osteoporosis and sarcopenia [5][6] or sarcopenia and obesity [7][8][9], has been discussed. Earlier however, it was rarely a case that all three conditions (referring to a full blown OSA) were linked together, apart from some preliminary suggestions [10][11]. Recently, the research on this issue exploded and is briefly reviewed below, followed with the appraisal of the updated diagnostics criteria.
2. The State of the Current Knowledge
OSA is progressive, and it can begin with any one of the three conditions: osteopenia/osteoporosis, sarcopenia or obesity/visceral adiposity, and/or adipose tissue infiltration, each originating on cellular and endocrine levels. The processes most likely start from the stem cell lineage commitment deregulation, involving bone, muscle and adipose tissue cross talk and alterations in osteokines, myokines and adipokines concentrations, respectively [1]; each process is exacerbated by the presence of LGCI [4]. Any of the conditions, if untreated can culminate into the triad of bone, muscle and fat deterioration, or OSA syndrome [1][2][3], leading to the elevated risks for immobility, frailty, falls, and disability as well as to the lower quality of life, and probably to an array of other chronic diseases that have yet to be recognized and linked to it [1][2][3][4][12][13][14][15][16][17][18][19][20] (see Figure 1).
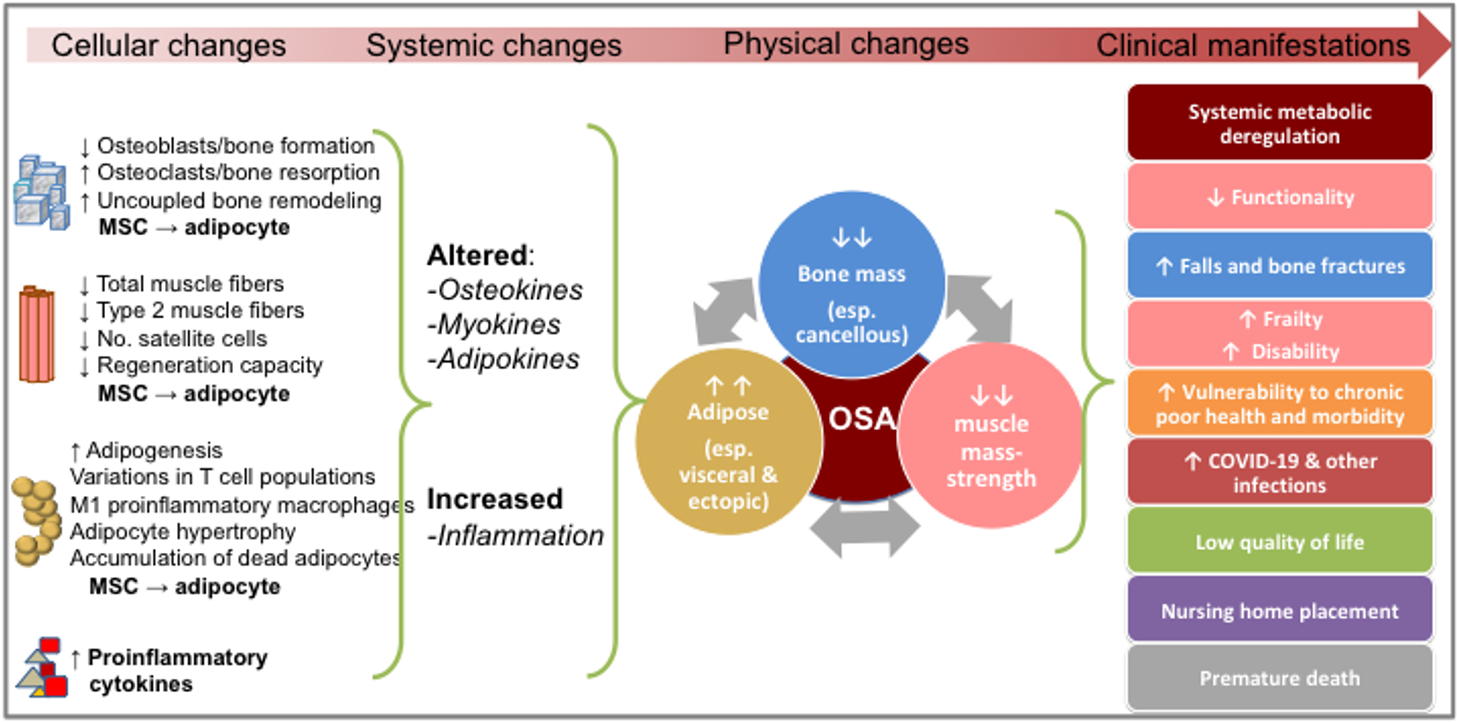
Figure 1. The progress of osteosarcopenic adiposity (OSA) from cellular changes to clinical manifestations. Adapted from references [1][2][3][4][12][13][14][15][16][17][18][19][20]. MSC, mesenchymal stem cells.
A detailed review evaluating the studies on OSA/OSO was published in 2019 [3]. For an update, a quick search in November 2021 on PubMed using “osteosarcopenic obesity/adiposity” as a key phrase, returned 79 articles in humans and animals. This seems to be an underestimated reflection of the overall number of published articles, since the search with various other key words/phrases including three body composition compartments, returned hundreds of hits. Evaluation of these hits revealed that osteopenia/sarcopenia/adiposity were addressed simultaneously in many of them, but the condition was not specified as OSA/OSO. Some other studies had databases from which OSA/OSO could have been identified, but the objectives were different, or the authors were simply unaware of or did not use the term. The following brief review has been modified from recent papers [3][4][19][20] and also addresses the most relevant recently published papers in humans.
2.1. Physical Functioning and OSA
After the proof of concept has been established in 2014 [1], among the first published original studies was the one in Caucasian overweight/obese postmenopausal women. The study depicted a significant inferior functionality (handgrip strength, walking speed, balance) in women with OSA, compared to their counterparts who were obese only [12]. Subsequently, many other studies reported similar findings in which OSA was associated with multiple inferior functional performance measures [21][22][23][24][25] and higher frailty scores [13] in older individuals with OSA compared to those with only one or two impaired body composition outcomes. These studies suggest that individuals with OSA do have lower functional abilities and may be at increased risks of falls and fractures (although not always confirmed for the latter two [25]), as well as other disabilities, all resulting in poorer quality of life, Figure 1.
2.2. Metabolic Disorders and OSA
A recently published study in almost 3,000 middle-age and older Taiwan community-dwelling residents (evaluated in a hospital setting) reported that those with metabolic syndrome had about 2.5 times higher risk for developing full-blown OSA, compared to those without metabolic syndrome [26]. Other researchers reported that individuals with OSA (both men and women) compared to those without OSA, had poorer cardiometabolic disease markers [27]; higher prevalence of hypertension even after adjusting for possible confounders [28]; worsened lipid profile [29]; and lower serum vitamin D [27][30]. The results of these studies indicate possible elevated metabolic disorders in individuals with OSA or these disorders worsening body composition components resulting in OSA. However, the cause and effect have yet to be elucidated; it is also possible that the conditions create a viscious cycle, especially accompanied by LGCI, the feature known to hasten all of the above conditions.
2.3. Chronic Diseases and OSA
Evaluation of body composition in patients with other chronic diseases was also conducted in a few studies. For example, in a sample of ~40-year-old women with rheumatoid arthritis, about 42% were identified as having OSO/OSA [31], possibly indicating impaired overall body composition status. In the study among older men with and without HIV, those identified as having OSA (although such term was not used, but patients’ characteristics clearly pointed to its existence; low bone and muscle mass, increased body fat) had significantly higher fragility scores, compared to men without OSA, regardless of the HIV status [32]. Evaluating the patients (>50 years) with non-alcoholic liver disease (NAFLD), a recent study reported the prevalence of OSA of about 9% in women and its significant association with NAFLD [33].
Carsote et al., conducted a mini review evaluating some 40 studies in patients with various malignancies, concluding that OSA may worsen the oncology outcomes [34]. Considering the increased proinflammatory state and catabolic features of cancers, as well as the consequences of cancer therapy, it is obvious that muscle, bones and adipose tissue are impacted, although not specifically named in each article of that review. It seems likely that all three tissues when impaired (the OSA syndrome), could worsen the cancer prognosis while malignancy itself may either contribute to or exacerbate the OSA, perpetuating the vicious cycle. A recent pilot study evaluated body composition in breast cancer survivors (mostly stage I and at least 5 years into survivorship) comparing them with their age-matched healthy counterparts [35]. About 94% of women in each group (survivors/controls) were obese and the prevalence of OSA in breast cancer survivors was 5.9% compared to 0% in control group. This study needs to be taken with caution because of the small number of participants (n=35 total), however some other studies reported compromised body composition in breast cancer survivors, although not explicitly determining the prevalence of OSA [36][37][38]. These studies indicate that OSA may propagate other chronic diseases or the catabolic state of the disease itself might be a cause for the body composition deregulation.
2.4. Nutrition and OSA
At the time of this writing, we are not aware of any published clinical trials with nutritional intervention to assess their effects on OSA. A few of the published studies were observational or retrospective, utilizing post-hoc analyzes or cross-sectionally comparing the intake of individuals with OSA to those with normal or milder body composition impairments. Among these studies, the most frequently addressed nutrients were macronutrients and rarely micronutrients. For example, de Franca et al., reported that protein intake as g/kg body weight (but not as a percent of energy intake) was significantly lower in individuals with OSA [23]. In that study, n=218 participants (both males and females age 59-69 years) were divided into 8 groups: from normal body composition to OSA. None of the other nutrients examined (including calcium and vitamin D) were significantly different among the groups. Although the categorization of participants into 8 groups based on the body composition status was commendable as it included all possible variations, the study was probably underpowered. Some groups had only 6, 11, or 14 participants and dietary intake was not separated for men and women.
Choi and Bae, utilizing the database from the Korean National Health and Nutrition Examination Survey (KNHANES), reported that men (>50 years) with OSA had lower plant-based and overall protein intake compared to control men [39]. Other Korean researchers utilizing the same database but collected in different years, showed poorer diet quality reflected probably in lower vitamin D status [30], higher dietary inflammatory index [40] and lower fruit intake [41] in OSA individuals compared to those with less impaired body composition. Regarding the relationship between selected micronutrients (minerals and vitamins), LGCI and OSA, a recent review examined their roles in general and relevant to the COVID-19 pandemic [20]. Briefly, the most influential micronutrients are calcium, magnesium, and vitamin D which have profound impact on OSA and its components, and the latter two also on LGCI. Potassium and vitamin K are vital in bone, muscle functioning and possibly adipose tissue modification. Both, but particularly vitamin D, surfaced as important modulators of immune system with application in COVID-19 infections. While both P and Na have important roles in bone, muscle, and can impact adiposity, due to their abundance in food their intake should be curbed to prevent possible damaging effects [20]. Obviously, more studies and clinical trials are needed to bring insight into the influence of overall diet, as well as specific nutrients, on OSA. Further refinement in personalized nutrition may bring a needed breakthrough in this area.
2.5. Physical Activity and OSA
There are a few randomized clinical trials which evaluated the exercise intervention (as possible therapy) specifically in the OSA patients and the subsequent outcomes in body composition and other related biomarkers. For example, the Iranian group conducted a series of studies in older women with OSA and intervention with the elastic band resistance training. They reported that during the 12 weeks of intervention there was an improvement in body composition and some other biomarkers ( e.g., serum lipids) in those who completed the intervention, compared to those who did not [42][43]. Similarly, Cunha et. al., reported the dose response-improvement in body composition and ultimately in OSA after a 12-week resistance training in OSA patients (three set produced better benefits than a single set) [44]. It seems that the above are the first randomized clinical trials evaluating specifically the OSA patients and implementing some interventional measures to investigate possible improvements in body composition or other related biomarkers. Obviously, more needs to be done in that area.
2.6. Complexity of OSA
A recent paper addressed various influences on OSA and LGCI, as well as their mutual action on each other, and provided nutritional and behavioral recommendations which could be personalized to help with either preventing or managing OSA and LGCI in general, and specifically in the time of the COVID-19 pandemic [19]. Detailed also were nutritional recommendations for and roles of macro- and micronutrients and bioactive food components; the microbiome; and optimal physical activity regimens. Other issues, such as food insecurity and nutritional inadequacy, circadian misalignment in shift workers (or by choice) were addressed as well. Since there is still a lack of longer-term primary studies in COVID-19 patients (either acute or recovered) and interventions for OSA improvement, the discussion was based on the existing knowledge, scientific hypotheses and observations derived from similar conditions or studies just being published. Overall, based on the presented evidence from numerous studies, it could be said that the health consequences of OSA with comorbidities are greater than the sum of its individual components. In other words, each individual condition (osteopenia/osteoporosis, sarcopenia, adiposity) may promote development of other comorbidities resulting in a new illness contributing to OSA and vice versa; each compounding the overall consequences and making them worse than just the sum of individual conditions [3][4].
Addressing the complexity of the OSA syndrome, Figure 2 presents biological, behavioral and environmental factors contributing to bone, muscle, and adipose tissues deterioration and probable development of OSA. Some of the influencing factors are innevitable (like aging and genetics), others could possibly be modified (stress, inflammation), and others could be mitigated even to a fuller extent (nutrition, lifestyle) [4][19][20].
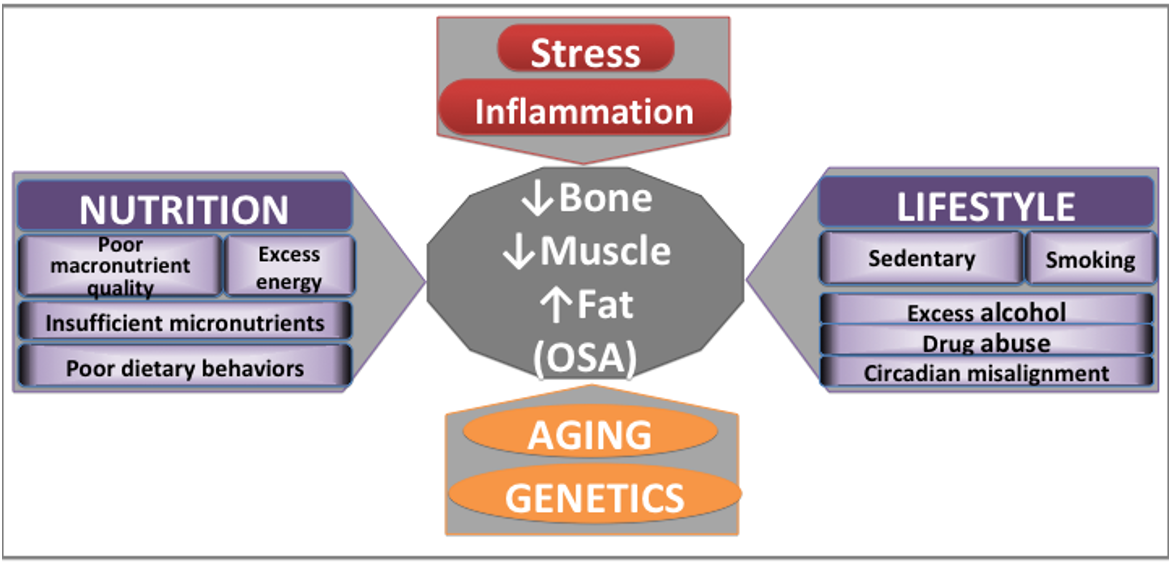
Figure 2. Major contributors to bone and body composition impairments. Adapted from [4][19][20].
2.7. Prevalence of OSA
A very important point is that the studies identifying/diagnosing OSA used different methodologies and criteria to diagnose not just the full OSA, but also its components (osteopenic adiposity, sarcopenia, sarcopenic adiposity, or adiposity/obesity itself), which resulted in mismatched diagnoses and wide range of OSA prevalence. While the consensus on diagnosing osteopenia/osteoporosis has been established many years ago and followed worldwide [45][46], that is not true for other body composition components within OSA [3][4][19][20]. However, the biggest and persisting problem in standardization of OSA diagnosis and thus determining its overall prevalence, or prevalence in specific groups, is a lack of consensus for cutoffs in determining body adiposity and identifying ectopic fat in each of the tissues [4]. Additionally, the studies reporting the prevalence of OSA were conducted in populations of different age, ethnicities, diseased state, as well as in different geographic regions. Therefore, it is of no surprise that the overall prevalence of OSA is hard to infer and that it has such a wide range: ~3% to ~42% [3][25], typically (but not always) lower in men than in women. However, the most alarming findings were published just recently with the OSA prevalence among nursing home residents of ~53% for both men and women [47]. In that study, all body compartments for OSA diagnosis (including bone mass) were assessed via bioelectrical impedance analysis (BIA) technology.
Obviously, more studies around the world are needed to determine the prevalence of OSA in women and men of specific ages, diseased states, and its possible ethnic/geographic burden. However, the studies in patients with other chronic diseases and in the nursing homes residents both comprising the most vulnerable populations for this (and many other related problems, for tha matter) are particularly encouraged and they will probably render quite different results than those in community dwelling individuals.
3. Persisting Difficulties in the Identification of OSA and its Components
The current physical (body composition) diagnostic criteria render OSA identification when the clinically relevant stages of bone loss, muscle mass/strength loss, and body fat gain have been reached. Briefly, in our earlier study [2], we outlined two most suitable ways for diagnosing OSA: 1) by physical measurements of bone and body composition via dual energy x-ray absorptiometry (DXA) using the established cutoffs criteria for each body composition compartment; 2) by functionality measures (namely, handgrip strngth, one leg stance, gait speed and sit-to-stand chair test) as a proxy for bone and body composition assessments when DXA is not available (also using established cutoffs for each of the measure); or 3) by combination of both. Obviously, if both measurements (DXA-bone/body composition and functional performance) are available, a more comprehensive way to grade the extent of the physical and functional deterioration and diagnosis of OSA syndrome could be obtained [2]. However, our previous criteria were only for women and did not fully consider the role of ectopic fat in bone and muscle (and in OSA) and these criteria were subsequently updated and include those for men as well [3]. Furthermore, the steady development of alternative technologies (using not just DXA, but new BIA instruments and possibly other technologies) could make the OSA identification even easier, as reviewed below.
3.1. Bone and Muscle
The definitions and cutoffs for osteopenia and osteoporosis are well established and are based on the T-scores (≤ -1 standard deviation, SD) for the measured bone mineral density (BMD) in hip and lumbar spine; and compared to young, normal, reference population [45][46]. Although not perfect, they are based on the extensive research in the last several decades and are widely used in the medical community. Additionally, the position statement from the National Bone Health Alliance Working Group [48] suggests that the diagnosis of osteoporosis should consist of a low T-score combined with a high risk of fracture, assessed by the Fracture Risk Assessment Tool (FRAX®). The limitations of DXA for the mass screening and diagnosing osteoporosis are its relatively restricted availability and resource needs. A promissing new tool is a BIA technology (all portable, non invasive, relatively cheap) instrument BIA-ACC® (BioTekna srl, Marcon-Venice, Italy) which, unlike other BIA technologies, assesses bone mass (kg in the whole body). This instrument was used to detect OSA in young obese men and women [49] and in the nursing home residents [47], and has been validated against DXA [50]. However, unlike DXA, it cannot distinguish among different skeletal sites because it depicts only the total bone mass in the body. The bone status (like with DXA measurements) is determined based on a normal reference population (which may be instrument specific); therefore, a T-score of ≤ -1 SD would indicate a lower bone mass (osteopenia/osteoporosis). Regardless of the instruments used, current clinical approaches to defining osteopenia/osteoporosis remain rooted in determining the quantity of bone mass and do not account for bone marrow fat, trabecular changes [51] or ectopic fat in bone [52], in other words, they do not assess the quality of bone.
Regarding the muscle/lean tissue, Baumgartner and colleagues were one of the first groups to propose a criterion for sarcopenia using DXA in normal-weight individuals to detect the muscle mass, using the appendicular (arms and legs) lean mass as a proxy [53]. Although both DXA and BIA may be used to measure lean mass (either kg or % of body weight), the caveat is that neither technology identifies muscle itself. These technologies assess the total lean mass (sum of muscle, total body water and organs). This limitation is offset by including only the appendicular lean tissue which mostly comprises muscle [54]. However, in order to diagnose sarcopenia which includes both deteriorated muscle quantity (muscle mass) and quality (muscle strength), more comprehensive approach needs to be added, most often also including the battery of physical performance measures [55]. In this case too, the presence of the surrounding body fat and ectopic fat in muscle may make this approach more difficult. To address this issue, Baumgartner et al. suggested that one reliable and accurate instrument (e.g. DXA or BIA), should be used for the simultaneous assessment of sarcopenia and obesity [56], suggesting a single device is better than two or more to determine the ultimate combination of the impaired muscle (sarcopenia) and obesity. This subsequently led to the identification (and naming) of sarcopenic obesity as a separate entity [57][58], although not immediately and not always labeled as such.
While sarcopenia itself has been studied extensively and the well-developed criteria for its diagnosis are in place (using both muscle mass quantity and quality assessment, the latter via functional performance) [55], that is not the case with sarcopenic obesity for which the criteria are not uniformly defined. Identifying the skeletal mass index (SMI; derived from appendicular lean mass (ALM) and adjusted for squared height) seems to be the most common method, however, the different cutoff points are used by different researchers. They range from <7.2–8.8 kg/m2 for men and <4.7–7.4 kg/m2 for women [59]. Similar case is with the functional performance measures (and the choice of which ones to use) [55][56][57][58][59][60]. Importantly, sarcopenic obesity for overweight/obese women could be determined from the Domiciano et al. (2012) equation [61] derived from the negative residuals of the linear regression model in which appendicular lean mass (ALM) is adjusted for fat mass and height and in which the 20th percentile was defined as the cutoff point for sarcopenic obesity [2][61]. This has not been tested for men and even the original Baumgartner et al., [53] definition for sarcopenia, was found to underreport sarcopenic obesity in men [62].
3.2. Obesity Classification and Adipose Tissue
One of the still most-debated aspects in body composition evaluation, in general and in the physiological sense as it relates to OSA, is the assessment of obesity/adiposity [63][64]. The difficulties arise from the heterogenic nature of adipose tissue which encompasses visceral fat (around inner organs and abdomen), subcutaneous fat (underneath the skin) and ectopic fat (infitrated in bone, muscle and other tissues). Additionally, there are several types of fat cells (white, brown, beige), manifesting different metabolic pathways and functions [4]. These issues are discussed in more detailed below.
3.2.1 Whole Body Obesity/Adiposity Identification
The most common approach in classifying overweight/obesity in the clinical setting is still by calculating body mass index (BMI), using the values of ≥ 30 kg/m2 as a cutoff for obesity. Despite its shortfalls [65][66], some studies still support its utility for these purposes [67]. Probably the most important point to note here is that BMI may be useful if the outcome is the change in BMI, which is actually the change in weight. Nevertheless, a low BMI (underweight) is associated with sarcopenia (especially in older adults) [68], osteopenia/osteoporosis [69][70][71] and frailty [72], the latter exhibiting reverse epidemiology with body weight [73]. This supports the notion of normal-weight/BMI obesity [74] and suggests that the location of fat mass and the overall volume of bone/lean/muscle mass are more important than body weight. Therefore, in the context of OSA, where visceral and/or infiltrated fat is important, weight or BMI are not useful for identifying the obesity/adiposity status. It becomes obvious that a more unified definition of obesity is required to reflect the impact of excess fat mass on metabolic and tissue health, which still might not be available technologically, especially not for a wider use.
Regarding the use of some "popular" and relatively available technologies (e.g., DXA or BIA), the reported cutoffs for determining obesity based on the total body fat have a wide range: from ≥ 20% to 28% body fat for men and ≥ 32% to 43% body fat for women [59]. For example, the Framingham Study used obesity cutoffs of ≥ 30% for men and ≥ 40% of body fat for women [75], while the cutoffs from the American Council on Exercise for body fat percentage are 25% and 32% for men and women, respectively [76], the latter also used in our recent assessments [3]. The American College of Sports Medicine have obesity cutoffs differentiated not just by sex, but by age as well. For example, the ≥ 60 years old men and women have 28.5% and 36.6% cutoffs, respectively [77].
3.2.2. Visceral Adiposity and its Identification
In addition to the different cutoffs and the lack of a consensus as to which one to use, no measures or cutoffs reviewed above consider the inevitable redistribution of fat into the visceral area (well known to secrete proinflammatory molecules) and its infiltration into bone and muscle, particularly accelerated with age (when they cause more metabolic disorders and other chronic problems than subcutaneous fat) [78]. Therefore, despite of all uncertainties and very new area of this research, the biggest problem might be due to the heterogenic nature of adipose tissue [4] and inability of current technology to assess it. Briefly, visceral fat surrounding the organs (mostly in abdominal area) and infiltrated/ectopic fat in bone and muscle can be accurately detected only with limited technologies (e.g., MRI or CT), thus, not widely available. In fact, the heterogeneity of adipose tissue was the main reason why the original term osteosarcopenic “obesity” was changed into osteosarcopenic “adiposity”; in view that obesity typically referrs to the overt overweight-phenotype and adiposity, in addition to the overweight-phenotype, also reflects the complexity of fat tissue [79]. Additionally, the term osteosarcopenic adiposity also aligns better with our original definition of the syndrome [1][2]. However, since the term OSO was depicted in the earlier studies and since some authors are still using it, both terms, OSO and OSA, reflect the same condition and are currently in use.
It is worth noting that another alternative to measuring visceral fat is to calculate android and gynoid fat, made possible by newer DXA instruments which measure/analyze the android (abdominal) and gynoid (hip) fat regions of the body [80]. Visceral fat correlates better with android than with gynoid fat, and this is evident by the much lower presence of gynoid fat in males [81]. However, the android to gynoid fat ratio (A/G ratio) is also a useful measure as it is a good predictor of metabolic deregulation and cardiovascular disease in adults [82][83] and children [84] similar to visceral fat. An A/G ratio of < 1.0 is a recommended cutoff for both males and females. In cases when DXA is not available, a proxy for the A/G ratio could be waist and hip circumferences or the waist-to-hip-circumference ratio (see Table 1).
3.2.3. Ectopic Fat Identification and Assessment of Bone and Muscle Quality
The unique material properties of bone regarding its strength and quality could not be measured in-vivo (other than with some invasive technologies, like CT or expensive MRI) until recently. The introduction of impact micro-indentation (IMI) technology offers the evaluation of in vivo tissue-level properties of bone in humans. The meta-analysis evaluating studies using this technology, focusing on the OsteoProbe® (ActiveLife Scientific Inc, Santa Barbara, CA, USA), has recently been published [85]. Briefly, the IMI measures the reference point micro-indentation and bone’s ability to resist the separation of mineralized collagen fibrils after the probe insertion. The final output is a calculated bone material strength index (BMSi), a ratio of the indentation distance in bone versus a reference material; in cases of compromised bone strength a deeper probe indentation occurs, resulting in the lower BMSi. However, the OsteoProbe® technology is somewhat invasive as it requires application of local anesthetic at a mid-shaft tibia where the probe is inserted through the skin. Nevertheless, this is a promising technology for the in vivo bone material properties and bone quality and fragility evaluation, especially when complemented with other technologies (e.g., DXA) [85].
The instruments which enable assessment of volumetric, as opposed to areal BMD (obtained by DXA), in both humans and animals are based on quantitative computed tomography (QCT). Those used in humans, peripheral, pQCT, measure bone parameters in appendicular skeleton (e.g., radius, tibia, femur) and can separate between trabecular and cortical bone. Additionally, these instruments also analyze bone geometric properties, such as marrow and cortical cross-sectional area, cortical thickness, as well as biomechanical parameters, like cross-sectional moment of inertia (indicating bone strength in torsion). These instruments enable the analysis of fat and muscle composition in extremities; thus providing some information about the bone and muscle quality. Due to their low radiation exposure, lower costs and ability to characterize appendicular bone geometry, compartmental density and strength, they can also be used to monitor changes during drug therapies, diet and exercise, as well as the disease outcomes on bone health. The biggest drawback for the longitudinal assessment is the need for very precise and consistent repositioning during follow-up. Also the cutoffs of various measured parameters are not well established and not officially used to diagnose osteoporosis. For more information see review [86].
Another non-invasive method for bone evaluation and screening for low bone mass is quantitative ultrasound (QUS) technology, generally applied to peripheral skeletal sites (e.g., phalanx, calcaneus, radius, tibia); however, the only validated measurement site for osteoporosis management is the heel. The most commonly used QUS measures include speed of sound (SoS) and broadband ultrasound attenuation (BUA), both correlated well with DXA derived BMD at lumbar spine and femoral neck. Some in vitro studies indicated that QUS indices reflect two principal constituents of bone; the bone quantity and quality (microarchitecture and strength). Nevertheless, most of the QUS application in humans is used for fracture prediction and not bone quality assessment. The cutoffs are based on T-scores (like with DXA), but they might be specific for each instrument. Additionally, the commercially available devices show technological diversity and employ different methods for calibration, thus precluding the results from different devices to be directly compared. For more information see review [87].
One of the newer devices (BIA-ACC® BioTekna, Marcon-Venice, Italy), based on multi-frequency bioelectrical impedance enables quantitative and qualitative body composition assessment and it has been validated against DXA [50]. This instrument detects total bone mass in the body (kg), along with minerals, calcium, magnesium and phosphorus; although it cannot distinguish between different skeletal sites or types of bone. The determination of bone status is based on the T-scores of normal reference population, just as in case with DXA measurements, but the T-scores may be instrument specific. This technology does not assess the ectopic fat in bone or changes in bone marrow fat; in other words, it does not address the quality of bone, but it gives a more comprehensive picture about the minerals and protein in the bone.
In addition, BIA-ACC® assesses the skeletal muscle mass (kg and % fat free mass), as well as intramuscular adipose tissue (IMAT). It also yields the amount of fat mass (kg and % body weight), total body water, and extracellular and intracellular water. The BIA-ACC® may be complemented by another portable device, the PPG-StressFlow® (BioTekna, Marcon-Venice, Italy), which assesses the autonomic nervous system, heart rate and heart rate variability, providing the information on chronic stress, systemic inflammation, oxidative stress and insulin resistance [88][89]. Therefore, in addition to their portability and ease of use, the synergy of BIA-ACC® and PPG-StressFlow® provides body composition assessment enabling the diagnosis of OSA, and at the same time shows underlying metabolic derangements such as low-grade chronic inflammation and stress, offering a thorough assessment about overall health.
Regarding other assessments of muscle quality, the easiest way would be to calculate the phase-angle from the BIA data by finding the arc-tangent of the reactance/resistance ratio [90]. Although this methodology does not directly measure the infiltrated fat in muscle, it could serve as a proxy for muscle tissue quality. Similarly, some researchers are using the knee extension measurements to assess muscle quality, as well as the lower body strength, where one repetition maximum in kg from the knee extension is divided by the leg lean mass in kg (mostly measured by DXA or BIA) [91]. The BIA-ACC® instrument conveniently provides the analysis of phase angle, in addition with other muscle and body composition properties mentioned above (e.g., IMAT).
Recent attention has been given to the advanced assessment of muscle tissue via ultrasound technology, particularly in view of its ability to distinguish among different properties of the muscle. For example, the high-frequency ultrasound measures the skeletal muscle mass, muscle length and density and can even track muscle atrophy [92]. Additionally, an ultrasound probe can evaluate the quality of skeletal muscle, such as the quadriceps, by finding the echo intensity using gray scale analysis with software such as Adobe Photoshop [93]. Echo intensity is negatively correlated with muscle strength, muscle thickness and age and may be useful in identifying infiltrated fat (myosteatosis) and the aging muscle [93].
4. Updated OSA Identification
Based on the reviewed data and available technology, we expand on our previously proposed criteria [1][2][3] to identify OSA, including the criteria for both men and women, presented in Table 1. The criteria for osteopenia/osteoporosis are well-established [45][46][48], with a T-score of ≤ −1 standard deviation (SD) with respect to the reference values and include both osteopenia and osteoporosis (the latter defined as ≤ −2.5 SD of reference values), using DXA. Using the bioelectrical impedance to measure whole body bone mass (currently possible only with BIA-ACC®, see above), a T-score of ≤ −1 SD is a cutoff and the reference is specific for that instrument [3][49][50]. For muscle mass and sarcopenia, the criteria with cutoff values include skeletal muscle index (SMI) [55] and the 20th percentile of appendicular lean mass (ALM) [61][62] both obtained by DXA or BIA. Another criterion, but specific only to BIA-ACC® instrument, includes the S-Score with cutoff of ≤ −1.0 SD with respect to the reference [3][49][50]. For total body fat, the percentage cutoffs and the fat mass index for obesity are included [3][77]. We also include the cutoffs for the visceral adipose tissue to account for the fat redistribution into the abdominal area (occurring inevitably with age), when CT and/or MRI measurements are availble [3]. When DXA measurements are available, the visceral/subcutaneous or android/gynoid fat ratios could be used, while intramuscular adipose tissue (IMAT) cutoffs are available by BIA-ACC®, and were used to previously identify OSO/OSA [47][49]; although there may be other specific reference values for different bioelectrical impedance instruments. The basic anthropometric measurements cutoffs of waist, hip and their ratios are included as well (Table 1). As a final point, in addition to CT and MRI to measure visceral fat, DXA technology has been shown to correlate well with CT data [94][95][96][97] which expands the role of DXA in identifying OSA.
Table 1. Physical diagnostic criteria for osteosarcopenic adiposity in males and females using commonly available technologies with the corresponding cutoffs.
|
OSA/OSO Components |
Males |
Females |
BONE |
T-score for BMD ≤ − 1.0 SD (by DXA) -Femoral neck OR -Proximal femur OR -Lumbar spine -Calcaneus (by QUS) T-score, total bone mass ≤ − 1.0 SD (by BIA-ACC®) |
T-score for BMD ≤ − 1.0 SD (by DXA) -Femoral neck OR -Proximal femur OR -Lumbar spine --Calcaneus (by QUS) T-score, total bone mass ≤ − 1.0 SD (by BIA-ACC®) |
MUSCLE |
SMI ≤ 5.5 (kg/m2) (by DXA, BIA) ALM -- Not studied
S-Score ≤ −1.0 SD (by BIA-ACC®) |
SMI ≤ 7.3 (kg/m2) (by DXA, BIA) ALM ≤ 20th percentile (by DXA, BIA) S-Score ≤ −1.0 SD (by BIA-ACC®) |
|
TOTAL BODY FAT |
Total body fat ≥ 25% (by DXA, BIA) Fat Mass Index ≥ 9 (kg/m2) (by anthropometrics) |
Total body fat ≥ 32% (by DXA, BIA) Fat Mass Index ≥ (13 kg/m2) (by anthropometrics) |
|
VISCERAL FAT
ECTOPIC FAT |
Visceral fat ≥ 130 (cm2) (by CT, MRI) Visceral/Subcutaneous ratio ≥ 1 (by DXA) Android/Gynoid fat ratio ≤ 1.0 (by DXA) IMAT ≥ 2.0% (by BIA-ACC®) |
Visceral fat ≥ 100 (cm2) (by CT, MRI) Visceral/Subcutaneous ratio ≥ 1 (by DXA) Android/Gynoid fat ratio ≤ 1.0 (by DXA) IMAT ≥ 2.0% (by BIA-ACC®) |
|
CENTRAL FAT (anthropometrics) |
Waist circumference ≥ 102 (cm) (40 inches) Waist/hip ratio > 0.90 |
Waist circumference ≥ 88 (cm) (35 inches) Waist/hip ratio > 0.85 |
OSA/OSO, Osteosarcopenic Adiposity/Obesity; BMD, bone mineral density; DXA, dual-energy x-ray absorptiometry; BIA, Bioelectrical Impedance Analysis; BIA-ACC® (device by BioTekna, Marcon, Italy), measuring the total body bone mass; SMI, Skeletal mass index (ALM/height2); ALM, Appendicular lean mass; CT, Computerized Tomography; MRI, Magnetic Resonance Imaging, IMAT, intramuscular adipose tissue.
In this physical diagnostic criteria, we did not include BMI as a preferred method to define obesity in the context of OSA/OSO for two reasons: 1) it does not differentiate between body composition compartments (bone, muscle and fat), creating one of its major flaws [65][66]; and 2) it excludes individuals with normal-weight obesity, who nevertheless may be at risk for OSA because of redistributed/infiltrated fat (see discussion above). However, in the absence of other measures, BMI, with appropriate ethnic cutoffs, may suffice to obtain an initial diagnosis of obesity, if that is the research area of interest. It is important to measure visceral fat and other body composition parameters in order to assess the metabolic burden of obesity (systemic and/or on bone and muscle). Although the preference is to use DXA, BIA and, whenever possible, CT or MRI to measure ectopic fat and to identify OSA, we have included proxy measures of ectopic fat for clinical setting. Finally, we have utilized broadly established cutoffs or those of European origin; however, we encourage adjustments to the criteria for various other ethnic groups. We envision a grading method based on some of these measures in the future; however, not enough data on OSA are available currently, and more research is needed.
Regarding the assessment based on the functional performace to complement physical criteria, our originally proposed scoring [2] could be revised just for the older men. This revision stems from the recently changed criteria for handgrip strength to diagnose sarcopenia in older men [55]. Based on the European Working Group on Sarcopenia in Older People 2 (EWGSOP2), the newest cutoffs for handgrip strength for men and women are ≤ 27 kg (lowered from ≤ 30 kg) and ≤ 16 kg (stayed the same), respectively. Moreover, the whole battery of functionality measures could be used, depending on the facility and the preference, as each one has the established cutoffs [55]. In our earlier paper [2], besides the handgrip strength, we also proposed one-leg stance, gait speed, and sit-to-stand chair test. Other possible combinations include Short Physical Performance Battery (SPPB), Timed-Up-and Go (TUG) and 400-m walk tests, as proposed recently to assess the severity of sarcopenia [55].
5. Summary and Future Needs in OSA Research
This entry reviewed the basic characteristics of OSA, its possible causes and consequences (Figure 1), as well as the most relevant research findings across the world related to its various characteristics and concerns. We have shown that research in OSA and its detection is being conducted in many populations globally, including even young overweight/obese males and females. Most often, OSA has been associated with a reduced functionality but also frailty in older individuals, metabolic deregulation, possible worsened prognosis if present with chronic diseases and malignancy (or vice versa), poor diet and a sedentary lifestyle (Figure 2). We presented measures and cutoff values for the physical diagnosis of OSA, as well as of each of its components or combination of two (Table 1). There, we incorporated visceral adipose tissue (and when possible ectopic fat), to account for the fat redistribution into the abdominal area and fat infiltration, both characteristic of ageing. We also expanded the criteria to include males and briefly discussed the complementary diagnosis employing functionality measures. Some of these measures/criteria will require validation in the context of OSA identification, but most notably those regarding the adipose tissue assessment.
Presently, there are technologies available that could be utilized and further developed for the diagnosis of OSA and its components. However, there needs to be a concerted effort to develop devices that can be used in the field/clinic as well as in a research setting to accurately assess visceral/ectopic fat and other body composition compartments, so that more studies could be done to refine the diagnostic criteria for bone and muscle loss and fat mass gain/redistribution. Therefore, future research is urgently needed to facilitate the improvements in diagnosis of OSA and its separate components (e.g., osteopenic adiposity, sarcopenic adiposity). Of particular importance is to establish the consensus for the overall obesity classification, in addition to the criteria for visceral/ectopic fat and marrow fat abnormalities. Regarding other possible advances in OSA identification, some preliminary research has been done in identifying potential serum biomarkers specific to each tissue (bone, muscle, fat) [98], to complement the diagnosis and also to evaluate the systemic effects of OSA. However, this area is in its nascent stage and needs supplementary research and evaluation.
We have previously summarized and outlined the nutritional and exercise interventions in the form of an algorithm [3] with the ensuing update and expansion [4][19][20], in order to aid with the treatment and management of OSA. More elaborate and specific recommendations will be available in the future issues and as more research evolves.
Overall, it could be concluded that OSA encompasses more serious and more detrimental outcomes than the sum of its components [3][4]. Regarding its identification, despite several options that are available for diagnosing OSA (see Table 1), there is a need to establish the scientific group on osteosarcopenic adiposity to guide researchers in its diagnosis and identification toward the uniform criteria, as currently exists for sarcopenia [55]. In view that defining and classifying adiposity is still such a difficult and problematic task, many researchers will need to come together, in addition for the development of more advanced and approachable technology to be used and in some cases, newly developed.
This entry has been adapted from 10.1155/2016/7325973; 10.3390/nu11040747; 10.3390/nu12123898; 10.1017/S0029665121000586
References
- Jasminka Z. Ilich; Owen Kelly; Julia E. Inglis; Lynn B. Panton; Gustavo Duque; Michael J. Ormsbee; Interrelationship among muscle, fat, and bone: Connecting the dots on cellular, hormonal, and whole body levels. Ageing Research Reviews 2014, 15, 51-60, 10.1016/j.arr.2014.02.007.
- Jasminka Z. Ilich; Owen J. Kelly; Julia E. Inglis; Osteosarcopenic Obesity Syndrome: What Is It and How Can It Be Identified and Diagnosed?. Current Gerontology and Geriatrics Research 2016, 2016, 1-7, 10.1155/2016/7325973.
- Owen J. Kelly; Jennifer C. Gilman; Jasminka Z. Ilich; Utilizing Dietary Nutrient Ratios in Nutritional Research: Expanding the Concept of Nutrient Ratios to Macronutrients. Nutrients 2019, 11, 282, 10.3390/nu11020282.
- Jasminka Z. Ilich; Jennifer C. Gilman; Selma Cvijetic; Dario Boschiero; Chronic Stress Contributes to Osteosarcopenic Adiposity via Inflammation and Immune Modulation: The Case for More Precise Nutritional Investigation. Nutrients 2020, 12, 989, 10.3390/nu12040989.
- Jean-Yves Reginster; Charlotte Beaudart; Fanny Buckinx; Olivier Bruyere; Osteoporosis and sarcopenia. Current Opinion in Clinical Nutrition and Metabolic Care 2016, 19, 31-36, 10.1097/mco.0000000000000230.
- Hiroshi Kaji; Linkage between muscle and bone. Current Opinion in Clinical Nutrition and Metabolic Care 2013, 16, 272-277, 10.1097/mco.0b013e32835fe6a5.
- Sari Stenholm; Tamara B. Harris; Taina Rantanen; Marjolein Visser; Stephen Kritchevsky; Luigi Ferrucci; Sarcopenic obesity: definition, cause and consequences. Current Opinion in Clinical Nutrition & Metabolic Care 2008, 11, 693-700, 10.1097/mco.0b013e328312c37d.
- Kyung Mook Choi; Sarcopenia and sarcopenic obesity. The Korean Journal of Internal Medicine 2016, 31, 1054-1060, 10.3904/kjim.2016.193.
- Mauro Zamboni; Gloria Mazzali; Francesco Fantin; Andrea Rossi; Vincenzo Di Francesco; Sarcopenic obesity: A new category of obesity in the elderly. Nutrition, Metabolism and Cardiovascular Diseases 2008, 18, 388-395, 10.1016/j.numecd.2007.10.002.
- Rama Vaidya; Obesity, sarcopenia and postmenopausal osteoporosis: An interlinked triad!. Journal of Mid-life Health 2014, 5, 1-2, 10.4103/0976-7800.127778.
- Silvia Migliaccio; Emanuela A. Greco; Antonio Aversa; Andrea Lenzi; Age-associated (cardio)metabolic diseases and cross-talk between adipose tissue and skeleton: endocrine aspects. Hormone Molecular Biology and Clinical Investigation 2014, 20, 25–38, 10.1515/hmbci-2014-0030.
- Jasminka Z Ilich; Julia E Inglis; Owen Kelly; Daniel McGee; Osteosarcopenic obesity is associated with reduced handgrip strength, walking abilities, and balance in postmenopausal women. Osteoporosis International 2015, 26, 2587-2595, 10.1007/s00198-015-3186-y.
- Claudia Szlejf; Lorena Parra; Oscar Rosas-Carrasco; Osteosarcopenic Obesity: Prevalence and Relation With Frailty and Physical Performance in Middle-Aged and Older Women. Journal of the American Medical Directors Association 2017, 18, 733.e1-733.e5, 10.1016/j.jamda.2017.02.023.
- Angel, A.; Pathophysiologic changes in obesity. Canadian Medical Association Journal 1978, 119, 1401–1406.
- Michael R. Deschenes; Effects of Aging on Muscle Fibre Type and Size. Sports Medicine 2004, 34, 809-824, 10.2165/00007256-200434120-00002.
- Kari Martyniak; Michal M Masternak; Changes in adipose tissue cellular composition during obesity and aging as a cause of metabolic dysregulation. Experimental Gerontology 2016, 94, 59-63, 10.1016/j.exger.2016.12.007.
- Natasa Miljkovic; Jae-Young Lim; Iva Miljkovic; Walter R. Frontera; Aging of Skeletal Muscle Fibers. Annals of Rehabilitation Medicine 2015, 39, 155-162, 10.5535/arm.2015.39.2.155.
- Sikaris, Ken A.; The clinical biochemistry of obesity. The Clinical Biochemist Reviews 2004, 25, 165–181.
- Jasminka Z. Ilich; Nutritional and Behavioral Approaches to Body Composition and Low-Grade Chronic Inflammation Management for Older Adults in the Ordinary and COVID-19 Times. Nutrients 2020, 12, 3898, 10.3390/nu12123898.
- Jasminka Z. Ilich; Osteosarcopenic adiposity syndrome update and the role of associated minerals and vitamins. Proceedings of the Nutrition Society 2021, 80, 344-355, 10.1017/s0029665121000586.
- Vanessa Ribeiro Dos Santos; Luís Alberto Gobbo; Physical activity is associated with functional capacity of older women with osteosarcopenic obesity: 24-month prospective study. European Journal of Clinical Nutrition 2019, 74, 912-919, 10.1038/s41430-019-0505-y.
- Vanessa Ribeiro Dos Santos; Luís Alberto Gobbo; Use of the Handgrip Strength Test in the Identification of Osteosarcopenic Obesity in Older Women. Topics in Geriatric Rehabilitation 2020, 36, 215-220, 10.1097/tgr.0000000000000284.
- Natasha A. G. De França; Barbara S. E. Peters; Elizabete A. Dos Santos; Marcela M. S. Lima; Regina M. Fisberg; Ligia Araújo Martini; Obesity Associated with Low Lean Mass and Low Bone Density Has Higher Impact on General Health in Middle-Aged and Older Adults. Journal of Obesity 2020, 2020, 1-10, 10.1155/2020/8359616.
- Yixuan Ma; Wen Zhang; Peipei Han; Masahiro Kohzuki; Qi Guo; Osteosarcopenic Obesity Associated with Poor Physical Performance in the Elderly Chinese Community. Clinical Interventions in Aging 2020, ume 15, 1343-1352, 10.2147/cia.s257739.
- Esma Nur Kolbaşı; Filiz Demirdağ; Prevalence of osteosarcopenic obesity in community-dwelling older adults: a cross-sectional retrospective study. Archives of Osteoporosis 2020, 15, 1-9, 10.1007/s11657-020-00829-x.
- Yu-Hsiang Su; Yu-Ming Chang; Chih-Ying Kung; Chiu-Kuei Sung; Wei-Shin Foo; Mei-Hua Wu; Shang-Jyh Chiou; A study of correlations between metabolic syndrome factors and osteosarcopenic adiposity. BMC Endocrine Disorders 2021, 21, 1-7, 10.1186/s12902-021-00880-w.
- Yoo Mee Kim; Sunghoon Kim; Young Jun Won; Se Hwa Kim; Clinical Manifestations and Factors Associated with Osteosarcopenic Obesity Syndrome: A Cross-Sectional Study in Koreans with Obesity.. Calcified Tissue International 2019, 105, 77-88, 10.1007/s00223-019-00551-y.
- Xingcai Chen; Cunqing Kong; Hongrong Yu; Jiangu Gong; Ling Lan; Lining Zhou; Jichun Gong; Peng Liu; Lin Xu; Qiongying Deng; et al. Association between osteosarcopenic obesity and hypertension among four minority populations in China: a cross-sectional study. BMJ Open 2019, 9, e026818, 10.1136/bmjopen-2018-026818.
- Dan Mo; Peishan Hsieh; Hongrong Yu; Lining Zhou; Jichun Gong; Lin Xu; Peng Liu; Gang Chen; Zhao Chen; Qiongying Deng; et al. Osteosarcopenic obesity and its relationship with dyslipidemia in women from different ethnic groups of China. Archives of Osteoporosis 2018, 13, 65, 10.1007/s11657-018-0481-1.
- Jinhee Kim; Yunhwan Lee; Seunghee Kye; Yoon-Sok Chung; Okhee Lee; Association of serum vitamin D with osteosarcopenic obesity: Korea National Health and Nutrition Examination Survey 2008-2010. Journal of Cachexia, Sarcopenia and Muscle 2016, 8, 259-266, 10.1002/jcsm.12154.
- R. Yatsyshyn; I. Stoika; AB0358 Phenotypes of secondary sarcopenia in patients with rheumatoid arthritis. Rheumatoid arthritis – comorbidity and clinical aspects 2018, 77, 1351-1351, 10.1136/annrheumdis-2018-eular.2305.
- Kellie L. Hawkins; Long Zhang; Derek K. Ng; Keri N. Althoff; Frank J. Palella; Lawrence A. Kingsley; Lisa P. Jacobson; Joseph B. Margolick; Jordan E. Lake; Todd T. Brown; et al.Kristine M. Erlandson Abdominal obesity, sarcopenia, and osteoporosis are associated with frailty in men living with and without HIV. AIDS 2018, 32, 1257-1266, 10.1097/qad.0000000000001829.
- Kazuhiro Kashiwagi; Michiyo Takayama; Hitoshi Ichikawa; Hiromasa Takaishi; Yasushi Iwao; Takanori Kanai; A significant association of non-obese non-alcoholic fatty liver disease with osteosarcopenic obesity in females 50 years and older. Clinical Nutrition ESPEN 2021, 42, 166-172, 10.1016/j.clnesp.2021.01.045.
- Carsote M., Albu S.E., Gherigian A., et al.; Particular types of non-age related sarcopenia: Osteosarcopenic obesity and malignancy—Associated muscle waste (a mini-review). Arch. Balk. Med. Union 2016, 51, 369–372.
- Madzima, Takudzwa A., Caroline D. Deaterly; Body composition, metabolism, and inflammation in breast cancer survivors and healthy age-matched controls: a cross-sectional analysis. International Journal of Exercise Science 2020, 13, 1108-1119.
- A.L. Artese; E. Simonavice; T.A. Madzima; J.-S. Kim; B.H. Arjmandi; J.Z. Ilich; L.B. Panton; Body composition and bone mineral density in breast cancer survivors and non-cancer controls: A 12- to 15-month follow-up. European Journal of Cancer Care 2018, 27, e12824, 10.1111/ecc.12824.
- Simonavice E., Liu P.-Y., Ilich J.Z., et al; Body composition, muscular strength, and physical function in breast cancer survivors. International journal of body composition research 2011, 9, 57–64.
- Emily Simonavice; Pei-Yang Liu; Jasminka Z. Ilich; Jeong-Su Kim; Bahram Arjmandi; Lynn B. Panton; The effects of a 6-month resistance training and dried plum consumption intervention on strength, body composition, blood markers of bone turnover, and inflammation in breast cancer survivors. Applied Physiology, Nutrition, and Metabolism 2014, 39, 730-739, 10.1139/apnm-2013-0281.
- M.-K. Choi; Y.-J. Bae; Protein intake and osteosarcopenic adiposity in Korean adults aged 50 years and older. Osteoporosis International 2020, 31, 2363-2372, 10.1007/s00198-020-05529-3.
- Susan Park; Woori Na; Cheongmin Sohn; Relationship between osteosarcopenic obesity and dietary inflammatory index in postmenopausal Korean women: 2009 to 2011 Korea National Health and Nutrition Examination Surveys. Journal of Clinical Biochemistry and Nutrition 2018, 63, 211-216, 10.3164/jcbn.18-10.
- Yun-Jung Bae; Fruit intake and osteosarcopenic obesity in Korean postmenopausal women aged 50–64 years. Maturitas 2020, 134, 41-46, 10.1016/j.maturitas.2020.02.003.
- Ebrahim Banitalebi; Mohammad Faramarzi; Majid Mardaniyan Ghahfarokhi; Farideh SavariNikoo; Neda Soltani; Azita Bahramzadeh; Osteosarcopenic obesity markers following elastic band resistance training: A randomized controlled trial. Experimental Gerontology 2020, 135, 110884, 10.1016/j.exger.2020.110884.
- Ebrahim Banitalebi; Majid Mardaniyan Ghahfarrokhi; Mortaza Dehghan; Effect of 12-weeks elastic band resistance training on MyomiRs and osteoporosis markers in elderly women with Osteosarcopenic obesity: a randomized controlled trial. BMC Geriatrics 2021, 21, 1-11, 10.1186/s12877-021-02374-9.
- Paolo M. Cunha; Alex S. Ribeiro; Crisieli M. Tomeleri; Brad J. Schoenfeld; Analiza Silva; Mariana Ferreira de Souza; Matheus A. Nascimento; Luis Sardinha; Edilson Cyrino; The effects of resistance training volume on osteosarcopenic obesity in older women. Journal of Sports Sciences 2017, 36, 1564-1571, 10.1080/02640414.2017.1403413.
- F. Cosman; S. J. De Beur; M. S. LeBoff; E. M. Lewiecki; B. Tanner; S. Randall; R. Lindsay; Clinician’s Guide to Prevention and Treatment of Osteoporosis. Osteoporosis International 2014, 25, 2359-2381, 10.1007/s00198-014-2794-2.
- E. S. Siris; R. Adler; J. Bilezikian; M. Bolognese; B. Dawson-Hughes; M. J. Favus; S. T. Harris; S. M. Jan De Beur; Sundeep Khosla; N. E. Lane; et al.R. LindsayA. D. NanaE. S. OrwollK. SaagS. SilvermanN. B. Watts The clinical diagnosis of osteoporosis: a position statement from the National Bone Health Alliance Working Group. Osteoporosis International 2014, 25, 1439-1443, 10.1007/s00198-014-2655-z.
- Irena Keser; Selma Cvijetić; Ana Ilić; Irena Colić Barić; Dario Boschiero; Jasminka Ilich; Assessment of Body Composition and Dietary Intake in Nursing-Home Residents: Could Lessons Learned from the COVID-19 Pandemic Be Used to Prevent Future Casualties in Older Individuals?. Nutrients 2021, 13, 1510, 10.3390/nu13051510.
- Centre for Metabolic Bone Diseases University of Sheffield UK . FRAX® fracture risk assessment tool. Retrieved 2021-11-23
- Charikleia Stefanaki; Melpomeni Peppa; Dario Boschiero; George P. Chrousos; Healthy overweight/obese youth: early osteosarcopenic obesity features. European Journal of Clinical Investigation 2016, 46, 767-778, 10.1111/eci.12659.
- Peppa, M.; Stefanaki, C.; Papaefstathiou, A.; Boschiero, D.; Dimitriadis, G.; Chrousos, G.P.; Bioimpedance analysis vs. DEXA as a screening tool for osteosarcopenia in lean, overweight and obese Caucasian postmenopausal females. Hormones 2017, 16, 181-193, 10.14310/horm.2002.1732.
- Huayue Chen; Xiangrong Zhou; Hiroshi Fujita; Minoru Onozuka; Kin-Ya Kubo; Age-Related Changes in Trabecular and Cortical Bone Microstructure. International Journal of Endocrinology 2013, 2013, 1-9, 10.1155/2013/213234.
- Clifford J Rosen; Mary L Bouxsein; Mechanisms of Disease: is osteoporosis the obesity of bone?. Nature Clinical Practice Rheumatology 2006, 2, 35-43, 10.1038/ncprheum0070.
- Baumgartner, R.N.; Koehler, K.M.; Gallagher, D.; Romero, L.; Heymsfield, S.B.; Ross, R.R.; Garry, P.J.; Lindeman, R.D.; Epidemiology of sarcopenia among the elderly in New Mexico. American journal of epidemiology 1998, 147, 755–763.
- John A. Shepherd; Bennett K. Ng; Markus J. Sommer; Steven B. Heymsfield; Body composition by DXA. Bone 2017, 104, 101-105, 10.1016/j.bone.2017.06.010.
- Alfonso J Cruz-Jentoft; Gülistan Bahat; Jürgen Bauer; Yves Boirie; Olivier Bruyère; Tommy Cederholm; Cyrus Cooper; Francesco Landi; Yves Rolland; Avan Aihie Sayer; et al.Stéphane M SchneiderCornel C SieberEva TopinkovaMaurits VandewoudeMarjolein VisserMauro ZamboniIvan BautmansJean-Pierre BaeyensMatteo CesariAntonio CherubiniJohn KanisMarcello MaggioFinbarr MartinJean-Pierre MichelKaisu PitkäläJean-Yves ReginsterRené RizzoliDolores Sánchez-RodríguezJos Schols Sarcopenia: revised European consensus on definition and diagnosis. Age And Ageing 2018, 48, 16-31, 10.1093/ageing/afy169.
- Baumgartner, Richard N.; Body composition in healthy aging. Annals of the New York Academy of Sciences 2000, 904, 437–448.
- Y Schutz; Uug Kyle; C Pichard; Fat-free mass index and fat mass index percentiles in Caucasians aged 18–98 y. International Journal of Obesity 2002, 26, 953-960, 10.1038/sj.ijo.0802037.
- Zhaoping Li; David Heber; Sarcopenic obesity in the elderly and strategies for weight management. Nutrition Reviews 2012, 70, 57-64, 10.1111/j.1753-4887.2011.00453.x.
- Carlene A. Johnson Stoklossa; Arya M. Sharma; Mary Forhan; Mario Siervo; Raj S. Padwal; Carla M. Prado; Prevalence of Sarcopenic Obesity in Adults with Class II/III Obesity Using Different Diagnostic Criteria. Journal of Nutrition and Metabolism 2017, 2017, 1-11, 10.1155/2017/7307618.
- Stephanie A. Studenski; Katherine W. Peters; Dawn E. Alley; Peggy M. Cawthon; Robert R. McLean; Tamara B. Harris; Luigi Ferrucci; Jack M. Guralnik; Maren S. Fragala; Anne M. Kenny; et al.Douglas KielStephen B. KritchevskyMichelle D. ShardellThuy-Tien L. DamMaria T. Vassileva The FNIH Sarcopenia Project: Rationale, Study Description, Conference Recommendations, and Final Estimates. The Journals of Gerontology Series A: Biological Sciences and Medical Sciences 2014, 69, 547-558, 10.1093/gerona/glu010.
- D. S. Domiciano; C. P. Figueiredo; J. B. Lopes; V. F. Caparbo; L. Takayama; Paulo Menezes; Eloisa Bonfa; R. M. R. Pereira; Discriminating sarcopenia in community-dwelling older women with high frequency of overweight/obesity: the São Paulo Ageing & Health Study (SPAH). Osteoporosis International 2012, 24, 595-603, 10.1007/s00198-012-2002-1.
- Anne B. Newman; Varant Kupelian; Marjolein Visser; Eleanor Simonsick; Bret Goodpaster; Michael Nevitt; Stephen B. Kritchevsky; Frances A. Tylavsky; Susan M. Rubin; Tamara B. Harris; et al.on behalf of the Health ABC Study Investigators Sarcopenia: Alternative Definitions and Associations with Lower Extremity Function. Journal of the American Geriatrics Society 2003, 51, 1602-1609, 10.1046/j.1532-5415.2003.51534.x.
- Jasminka Z. Ilich; Another Impairment in Older Age: What Does Osteosarcopenic Obesity Syndrome Mean for Middle-Aged and Older Women?. Journal of the American Medical Directors Association 2017, 18, 648-650, 10.1016/j.jamda.2017.05.001.
- Pegah JafariNasabian; Julia E Inglis; Wendimere Reilly; Owen Kelly; Jasminka Z Ilich; Aging human body: changes in bone, muscle and body fat with consequent changes in nutrient intake. Journal of Endocrinology 2017, 234, R37-R51, 10.1530/joe-16-0603.
- Thais Coutinho; Kashish Goel; Daniel Corrêa de Sá; Charlotte Kragelund; Alka M. Kanaya; Marianne Zeller; Jong-Seon Park; Lars Kober; Christian Torp-Pedersen; Yves Cottin; et al.Luc LorgisSang-Hee LeeYoung-Jo KimRandal ThomasVéronique L. RogerVirend K. SomersFrancisco Lopez-Jimenez Central Obesity and Survival in Subjects With Coronary Artery Disease: A Systematic Review of the Literature and Collaborative Analysis With Individual Subject Data. Journal of the American College of Cardiology 2011, 57, 1877-1886, 10.1016/j.jacc.2010.11.058.
- Eyal Shahar; The Association of Body Mass Index With Health Outcomes: Causal, Inconsistent, or Confounded?. American Journal Of Epidemiology 2009, 170, 957-958, 10.1093/aje/kwp292.
- H. Blackburn; D. Jacobs; Ancel Keys; Flaminio Fidanza; Martti J Karvonen; Noburu Kimura; Henry L Taylor; Commentary: Origins and evolution of body mass index (BMI): continuing saga. International Journal Of Epidemiology 2014, 43, 665-669, 10.1093/ije/dyu061.
- Vanessa Ribeiro Dos Santos; Diego Giulliano Destro Christofaro; Igor Conterato Gomes; Ricardo Agostinete; Ismael Forte Freitas Júnior; Luís Alberto Gobbo; Factors associated with sarcopenia in subjects aged 80 years and over. Revista de Nutrição 2015, 28, 319-326, 10.1590/1415-52732015000300008.
- A. Coin; G. Sergi; P. Benincà; L. Lupoli; G. Cinti; L. Ferrara; G. Benedetti; G. Tomasi; C. Pisent; G. Enzi; et al. Bone Mineral Density and Body Composition in Underweight and Normal Elderly Subjects. Osteoporosis International 2001, 11, 1043-1050, 10.1007/s001980070026.
- William P. Hedges; Marwan Bukhari; Increasing body fat mass reverses bone loss in osteopenia as detected by dual-energy X-ray absorptiometry scans. European Journal of Rheumatology 2016, 3, 1-4, 10.5152/eurjrheum.2015.0025.
- Yukako Tatsumi; Aya Higashiyama; Yoshimi Kubota; Daisuke Sugiyama; Yoko Nishida; Takumi Hirata; Aya Kadota; Kunihiro Nishimura; Hironori Imano; Naomi Miyamatsu; et al.Yoshihiro MiyamotoTomonori Okamura Underweight Young Women Without Later Weight Gain Are at High Risk for Osteopenia After Midlife: The KOBE Study. Journal of Epidemiology 2016, 26, 572-578, 10.2188/jea.JE20150267.
- M. Liset Rietman; D. L. Van Der A; S. H. Van Oostrom; H. S. J. Picavet; M. E. T. Dollé; H. Van Steeg; W. M. M. Verschuren; A. M. W. Spijkerman; The Association Between BMI and Different Frailty Domains: A U-Shaped Curve?. The journal of nutrition, health & aging 2016, 22, 8-15, 10.1007/s12603-016-0854-3.
- Emmanuelle Boutin; Pierre-André Natella; Anne-Marie Schott; Sylvie Bastuji-Garin; Jean-Philippe David; Elena Paillaud; Yves Rolland; Florence Canouï-Poitrine; Interrelations between body mass index, frailty, and clinical adverse events in older community-dwelling women: The EPIDOS cohort study. Clinical Nutrition 2018, 37, 1638-1644, 10.1016/j.clnu.2017.07.023.
- Estefania Oliveros; Virend K. Somers; Ondrej Sochor; Kashish Goel; Francisco Lopez-Jimenez; The Concept of Normal Weight Obesity. Progress in Cardiovascular Diseases 2013, 56, 426-433, 10.1016/j.pcad.2013.10.003.
- Alyssa B. Dufour; Marian T. Hannan; Joanne Murabito; Douglas Kiel; Robert R. McLean; Sarcopenia Definitions Considering Body Size and Fat Mass Are Associated With Mobility Limitations: The Framingham Study. The Journals of Gerontology: Series A 2012, 68, 168-174, 10.1093/gerona/gls109.
- Percent body fat norms for men and women . American Council on Exercise. Retrieved 2021-11-23
- American College of Sports Medicine. ACSM’s Health-Related Physical Fitness Assessment Manual; Lippincott Williams & Wilkins: Philadelphia, PA, USA, 2017; pp. p. 208.
- Hunter, Gary R., Barbara A. Gower, Brandon L. Kane; ge related shift in visceral fat. International journal of body composition research 2010, 8, 103–108.
- 2021 Obesity Algorithm® . Obesity Medicine Association. Retrieved 2021-11-23
- Francesca De Blasio; Erica P. A. Rutten; Emiel F. M. Wouters; Luca Scalfi; Marco A. Akkermans; Martijn A. Spruit; Frits M. E. Franssen; Preliminary study on the assessment of visceral adipose tissue using dual-energy x-ray absorptiometry in chronic obstructive pulmonary disease. Multidisciplinary Respiratory Medicine 2016, 11, 1-9, 10.1186/s40248-016-0070-3.
- Ike S Okosun; J P Seale; Rodney Lyn; Commingling effect of gynoid and android fat patterns on cardiometabolic dysregulation in normal weight American adults. Nutrition & Diabetes 2015, 5, e155-e155, 10.1038/nutd.2015.5.
- Xiaohua Fu; Fei Zhu; Xinyu Zhao; Xiaoguang Ma; Shankuan Zhu; Central Fat Accumulation Associated with Metabolic Risks beyond Total Fat in Normal BMI Chinese Adults. Annals of Nutrition and Metabolism 2014, 64, 93-100, 10.1159/000363072.
- Tomasz Miazgowski; Krzysztof Safranow; Katarzyna Iskierska; Krystyna Widecka; Joanna Dziwura-Ogonowska; Changes in adiponectin level and fat distribution in patients with type 2 diabetes. European Journal of Clinical Investigation 2013, 44, 192-199, 10.1111/eci.12207.
- Lennie Samsell; Michael Regier; Cheryl Walton; Lesley Cottrell; Importance of Android/Gynoid Fat Ratio in Predicting Metabolic and Cardiovascular Disease Risk in Normal Weight as well as Overweight and Obese Children. Journal of Obesity 2014, 2014, 1-7, 10.1155/2014/846578.
- Manuela Schoeb; Neveen A. T. Hamdy; Frank Malgo; Elizabeth M. Winter; Natasha M. Appelman-Dijkstra; Added Value of Impact Microindentation in the Evaluation of Bone Fragility: A Systematic Review of the Literature. Frontiers in Endocrinology 2020, 11, p. 15, 10.3389/fendo.2020.00015.
- Stefano Stagi; Loredana Cavalli; Tiziana Cavalli; Maurizio De Martino; Maria Luisa Brandi; Peripheral quantitative computed tomography (pQCT) for the assessment of bone strength in most of bone affecting conditions in developmental age: a review. Italian Journal of Pediatrics 2016, 42, 1-20, 10.1186/s13052-016-0297-9.
- Kok-Yong Chin; Soelaiman Ima-Nirwana; Calcaneal Quantitative Ultrasound as a Determinant of Bone Health Status: What Properties of Bone Does It Reflect?. International Journal of Medical Sciences 2013, 10, 1778-1783, 10.7150/ijms.6765.
- Charikleia Stefanaki; Panagiota Pervanidou; Dario Boschiero; George P. Chrousos; Chronic stress and body composition disorders: implications for health and disease. Hormones 2018, 17, 33-43, 10.1007/s42000-018-0023-7.
- Constantine Tsigos; Charikleia Stefanaki; George Lambrou; Dario Boschiero; George P. Chrousos; Stress and inflammatory biomarkers and symptoms are associated with bioimpedance measures. European Journal of Clinical Investigation 2015, 45, 126-134, 10.1111/eci.12388.
- Maria Cristina G Barbosa-Silva; Aluísio Jd Barros; Jack Wang; Steven B Heymsfield; Richard N Pierson; Bioelectrical impedance analysis: population reference values for phase angle by age and sex. The American Journal of Clinical Nutrition 2005, 82, 49-52, 10.1093/ajcn/82.1.49.
- Naomi Brooks; Jennifer E. Layne; Patricia L. Gordon; Ronenn Roubenoff; Miriam E. Nelson; Carmen Castaneda-Sceppa; Strength training improves muscle quality and insulin sensitivity in Hispanic older adults with type 2 diabetes. International Journal of Medical Sciences 2007, 4, 19-27, 10.7150/ijms.4.19.
- XuLei Qin; Baowei Fei; Measuring myofiber orientations from high-frequency ultrasound images using multiscale decompositions. Physics in Medicine & Biology 2014, 59, 3907-3924, 10.1088/0031-9155/59/14/3907.
- Yuya Watanabe; Yosuke Yamada; Yoshihiro Fukumoto; Keiichi Yokoyama; Tsukasa Yoshida; Motoko Miyake; Emi Yamagata; Misaka Kimura; Tatsuro Ishihara; Echo intensity obtained from ultrasonography images reflecting muscle strength in elderly men. Clinical Interventions in Aging 2013, 8, 993-998, 10.2147/cia.s47263.
- Lisa Micklesfield; Julia Goedecke; Mark Punyanitya; Kevin E. Wilson; Thomas L. Kelly; Dual-Energy X-Ray Performs as Well as Clinical Computed Tomography for the Measurement of Visceral Fat. Obesity 2012, 20, 1109-1114, 10.1038/oby.2011.367.
- Xiaoning Bi; L Seabolt; Cyndya Shibao; Maciej Buchowski; H Kang; Charles Keil; R Tyree; Heidi J Silver; DXA-measured visceral adipose tissue predicts impaired glucose tolerance and metabolic syndrome in obese Caucasian and African-American women. European Journal of Clinical Nutrition 2014, 69, 329-336, 10.1038/ejcn.2014.227.
- John T. Schousboe; Lisa Langsetmo; Ann V. Schwartz; Brent C. Taylor; Tien N. Vo; Allyson M. Kats; Elizabeth Barrett-Connor; Eric S. Orwoll; Lynn M. Marshall; Iva Miljkovic; et al.Nancy E. LaneKristine E. Ensrud Comparison of Associations of DXA and CT Visceral Adipose Tissue Measures With Insulin Resistance, Lipid Levels, and Inflammatory Markers. Journal of Clinical Densitometry 2017, 20, 256-264, 10.1016/j.jocd.2017.01.004.
- Timothy É. Murray; David Williams; Michael J. Lee; Erratum to: Osteoporosis, obesity, and sarcopenia on abdominal CT: a review of epidemiology, diagnostic criteria, and management strategies for the reporting radiologist. Abdominal Radiology 2017, 43, 1281-1281, 10.1007/s00261-017-1274-5.
- JafariNasabian, Pegah, et al.; Metabolic Profile of Osteosarcopenic Obesity Syndrome: Identifying Biomarkers for Diagnostic Criteria. The FASEB Journal 2017, 31, 151.5-151.5.


