 +1 credit
| Version | Summary | Created by | Modification | Content Size | Created at | Operation |
|---|---|---|---|---|---|---|
| 1 | Stanislav Juráň | + 3537 word(s) | 3537 | 2021-01-22 04:28:15 | | | |
| 2 | Camila Xu | -143 word(s) | 3394 | 2021-03-18 03:52:19 | | |
Video Upload Options
Tropospheric concentrations of phytotoxic ozone (O3) have undergone a great increase from preindustrial 10–15 ppbv to a present-day concentration of 35–40 ppbv in large parts of the industrialised world due to increased emissions of O3 precursors including NOx, CO, CH4 and volatile organic compounds.
1. Changes in O3 Concentration
Concentrations of O3 ([O3]) have been increasing since the preindustrial era due to an increase of its precursors [1]. As an important secondary phytotoxic air pollutant causing injury to plant tissue and a significant decrease of crop and timber yield, it deserves attention from farmers, scientists and the general public. Although the historical [O3] are unreliable because of a limited number of observations and disagreements in the retrospective modelling [2], it is considered that [O3] has increased from the baseline of 10–15 ppbv (parts per billion per volume, volume mixing ratio; [3]) to current concentrations of 35–40 ppbv in large parts of the industrialised world [4][5]). Plant species vary in their sensitivity to [O3], and it seems that genetically based detoxification processes [6] are significant and certainly sufficient to protect plants against any harmful effect of low pre-industrial [O3]. The concept of “effective O3 flux”, defined as a balance between stomatal O3 flux and detoxifying capacity of the plant, was proposed [7]. However, there is a huge variety of clones and cultivars (poplars, beans, etc.), which are sensitive even to low [O3], demonstrating a strong genetic basis for plant sensitivity to O3.
Ozone was discovered in 1839 by Christian Friedrich Schönbein during his experiments with the electrolysis of water. At the start of the modern era, [O3] was measured using classical procedures involving titration. In Europe, one of the first measurements was performed by Albert-Lévy in Paris. He showed [O3] to be 11 ± 2 ppbv over the period 1876–1910 [8]. Even in high elevations, at Pic du Midi, France, 3000 m a.s.l., a concentration of only 10 ppbv was measured during 1874–1895 with a peak in spring and a minimum in winter [9]. The oldest continuous measurements started at the Arkona-Zingst site (Germany) in 1956: they showed [O3] in the 1950s–1960s to be in the range of 15–20 ppbv [10].
The first harmful effects of O3 were reported in the San Bernardino Mountains of Southern California, in Pinus ponderosa forest [11]. During the 1970s, in inland valleys around Los Angeles, maximum annual [O3] reaching 300–400 ppbv was common [12]. Air pollution led to an increase in the number of days with [O3] > 95 ppbv from 114 in 1963 to 163 days in 1978 [13].
Elsewhere, an increase of 2–4 ppbv per decade was later reported [4], and an increase of 0.35 ppbv per year was seen in South Korea and Japan in 2000–2014 [14][15]. However, at highly polluted urban sites the increase was rapid, 2.6 ppbv per year in Beijing in 2005–2011 [16] and 2 ppbv per year in the Pearl River Delta region [17]. Recently, interannual and decadal changes are reported elsewhere: in the North China plains, there were increases of 3–5 ppbv (2001–2006), mostly attributed to a change of cloud cover and temperature [18] with only a low impact (1–2%) due to afforestation and increased VOC production [19].
In the southern hemisphere, with much less land area and industry, there is a trend of an increasing [O3] of 0.1 ppbv per year from 1990–2015 ranging from 0.04 at Baring head (New Zealand) to 0.21 at Arrival Heights (Antarctica). Overall there seems to be a concentration increase towards southern latitudes [20]. Similarly, an increase of 0.66 ppbv per decade has been observed in Chile at El Tololo mountain [21]. The increase is attributed to the poleward expansion of the Hadley Circulation, bringing the O3-rich air from the stratosphere [20].
Marked diurnal courses of [O3] have usually been found, particularly in large urban agglomerations [22]. O3 is produced over the day, associated with high UV irradiance which drives the photochemistry, whilst at the same time, O3 is being removed by wet and dry depositions on various surfaces and uptake by plants. Typically, NOx is transported from urban areas at low elevations to rural forested areas where significant amounts of VOC are being produced as natural plant emissions. Thus the appropriate VOC/NOx ratio for O3 production, ranging between 4 and 15, is achieved [23]. Such middle-range transport of NOx is responsible for the enhanced production of O3 in rural areas, often at high elevations, and may result in damage of vegetation. A globally averaged lifetime of tropospheric O3 is approximately 23 days [24]. Therefore, O3 could be transported even at long-range between continents [25]. However, its lifetime inside the boundary layer is much shorter because of the surface deposition and chemical reactions, such as reduction of O3 to oxygen. These processes, as well as the spatio-temporal heterogeneity in [O3], are further modulated by the seasonal variability of microclimatic conditions (Figure 1).
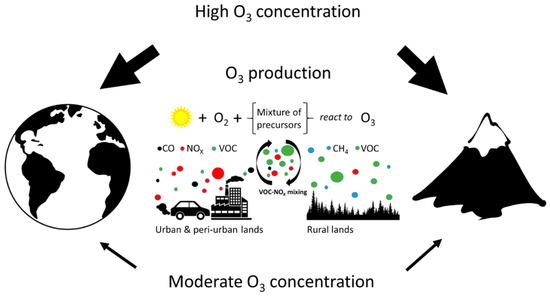
Figure 1. Scheme of tropospheric ozone (O3) formation. Tropospheric ozone is formed in a complex series of photochemical reactions driven by ultraviolet (UV) solar radiation. NO2 is photolyzed to form NO and an electronically excited oxygen atom, O, which reacts with molecular oxygen in the atmosphere (O2) to form O3. However, O3 may also regenerate NO2 in the presence of NO, thus keeping a photo-stationary state. Therefore, net O3 production occurs when O3 precursors, such as carbon monoxide (CO), methane (CH4) and volatile organic compounds (VOCs), are present in the atmosphere at appropriate concentrations. This chain of photochemical reactions is catalysed by hydroxide anion (OH−), hydroperoxyl radical (HO2), NO and NO2. Enhanced O3 production thus occurs under high levels of UV radiation and when the concentration of precursors reaches critical levels. Transport of precursors and catalysts from urban and industrial lands (CO, NOx and VOC) to rural conditions enhances mixing of polluted air plumes with clean rural air (enriched with CH4 and VOC) and results in a VOC/NOx ratio conducive for O3 formation. Therefore, latitudinal and elevational distribution differences in O3 concentration are likely caused by the distribution of O3 precursor sources associated with industrialization development and/or by an elevational increase in UV radiation.
At nightfall [O3] rapidly decreases because of the oxidation of NO to NO2 in the absence of production. Distinct seasonal behaviour patterns have been reported in industrialised and rural areas of Europe and the USA: (1) a broad spring-summer maximum of [O3] in the industrialised parts, but (2) a minimum [O3] in summer and autumn in remote regions [26]. Noticeably, spring [O3] maximum is a northern hemispheric phenomenon, only found in northern and western parts of Europe. In the temperate zone of Central and Eastern Europe, the highest [O3] are observed in summer months when temperatures and irradiances reach their highest values (reviewed in Monks [27]), while these are lowest in winter [28][29]. Moreover, substantially higher [O3] are observed under clear skies than under cloudy skies, but not in winter [29].
In the Czech Republic, Central Europe, the annual maxima of [O3] are being shifted towards the later parts of the year. The [O3] peak has shifted from Day of Year (DOY) 120–170 at the beginning of the millennium towards DOY 160–175 over the following 20 years depending on the locality [30]. The shift is probably caused by the change of meteorological conditions towards warmer and dryer years with consequently more favourable conditions for O3 formation [30]. However, contradicting results are found in the summer monsoon climate of Beijing: [O3] maximum is in June, while the lowest values of [O3] are in December [31]. Similarly, in the Yangtze River Delta, the maximum is found in July with a second maximum in September, followed by a minimum in November [32]. At 38 sites involved in the European Monitoring and Evaluation Programme (EMEP), there was a decrease of [O3] reported in the 1990s, however later, around 2000, the [O3] had increased; then, in the 2010s it decreased [33]. Interpretation of the trends and spatial patterns over several past decades has been challenging [34]; however in Europe, because of the successfully adopted measures to reduce O3 precursors, O3 surface concentration decreased by 2% from 2000 to 2014 [35].
In the Arctic, there is no clear trend in Barrow (USA, Alaska, 1981–2010) and Resolute (Canada), although there is an increasing trend in short-term periods [36]. In the southern hemisphere, the strongest increase in [O3] is reported to be during the austral autumn (March-May) with an increase of 0.14 ppbv per year on average, while in other seasons the increase is only 0.07–0.12 ppbv per year [20]. The exception is South Africa with a sharp increase of 1 ppbv per year over the period 1992–2011 [37]. An overview of [O3] in different regions of the world, with model predictions for the future, is given by Archibald et al. [5].
Currently, [O3] and its changes are both measured and modelled, however modelling approaches based on state-of-the-art models may suffer from huge uncertainties [38], and some are unable to track accurately [O3] from the past.
2. Effect on Carbon Uptake from Leaf to Ecosystem Level
In the atmosphere, O3 is known to react with double bonds between carbon atoms to produce aldehydes, ketones or higher oxidised molecules— that has been known since 1840 when O3 was discovered. The mechanism is the same in plants, where, after penetrating through the stomatal apertures, ozone molecules oxidise the fatty acids of cell/organelle membranes; this leads to the formation of reactive oxygen species (ROS) causing damage of tissues (Figure 3). Such damage to photosynthetic membranes, despite the plant’s increased defensive production of ROS scavenging enzymes ascorbate [39] and compounds with antioxidative capacity (carotenoids; [40][41]), inevitably leads to local necrotic cell death or early senescence [42]. Among others, Luwe and Heber [6] have shown that elevated [O3] increases concentrations of reduced and oxidised forms of ascorbate in the apoplast of leaves of different plant species. These transient increases are, however, often insufficient to protect leaf tissues. The yellowish mottling occurs particularly close to stomata and appears more often in older than young leaves [43]. Microscopic studies identified enlargement of intercellular space and chloroplast injuries, including thylakoid swellings and membrane disruption, as typical symptoms of O3 impact [40]. Such reduced photosynthetically active leaf area leads to a reduced carbon uptake [44].
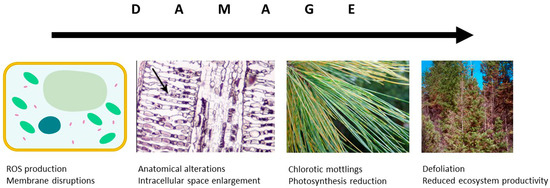
Figure 3. Damaging O3 effects at the cellular and leaf levels influence the carbon allocation at tree and ecosystem level.
However, O3 may affect carbon uptake at various physiological levels. Exposure to chronic [O3] closes stomatal pores leading thus to a reduced stomatal conductance to CO2 diffusion and consequently to a reduced photosynthetic CO2 assimilation [45]. Moreover, O3 reduces photosynthetic CO2 uptake via reduced Rubisco (ribulose-1,5-bisphosphate carboxylase/oxygenase) content [46][47]. These effects need to be related to growth and carbon economy at the ecosystem level. In a six-year free-air fumigation at a German forest, Matyssek et al. [48] reported a 44% decline in stem productivity in Fagus sylvatica exposed to twice-ambient [O3]. Reductions in biomass accumulation have been associated with a modified carbon allocation to plant organs. Based on the meta-analysis of temperate and boreal forests of the northern hemisphere, Wittig et al. [49] reported a significant decrease of the root-to-shoot ratio under elevated [O3] indicating greater sensitivity of root biomass to [O3]. O3-induced reduction in root surface area per soil volume unit [50] can result in decreases of water and nutrition uptakes. Investigation of carbon pools revealed faster O3-induced turnover of leaves/needles, reduction of canopy carbon pools and a substantial increase in carbon deposited to the forest floor [51].
Several metrics have been developed to assess the effect of O3 on plants and to relate threshold [O3] to relative yield loss. For example, the index AOT40 (accumulated dose of ozone over a threshold of 40 ppbv), which has to be interpreted with regional and meteorological aspect, has been established. This index is calculated over the sunlight hours and whole growing season, which is being prolonged towards a larger number of days in line with earlier phenological phase occurrence [52][53]. The highest and lowest AOT40 values are reported from Mediterranean regions (38,359 ppb h) and Northern Europe (5094 ppb h), respectively. In Continental Central Europe, AOT40 ranges between 13,636 and 23,515 ppb h, while it is 8207–13,751 ppb h in Atlantic Central Europe [35]. However, this AOT40 index takes into account only of O3 exposure, but not the physiological properties enabling O3 diffusion to plant tissues, which is directly responsible for the damage. Therefore, an alternative index based on stomatal O3 uptake, PODY (phytotoxic O3 dose above a flux threshold of Y nmol O3 m−2 s−1) has also been advanced. The threshold is species-specific and depends on the detoxifying capacity of the plant (e.g., [54]). The value of Y ranges from 7 in Alnus glutinosa to 0–1 nmol O3 m−2 s−1 in Fagus sylvatica. The minimum values of POD0 were found in Northern Europe (14 mmol m−2 year−1), while maximum values of 29.7–32.1 mmol m−2 year−1 were observed in Mediterranean and Atlantic regions of Europe [35].
While PODY is mainly used in scientific and modelling studies, AOT40 still prevails in legislation (European Council Directive 2008/50/EC) and monitoring activities [55]. Protection of vegetation recommended by UNECE [56] sets an exposure-based critical level of AOT40 as 5000 ppbv h. Attitudes may change, and PODY is now being discussed as a potential integral part of new legislation in Europe [57]. While AOT40 decreased and POD0 increase in Lithuanian forests over the period 2007–2014 [58], Klingberg et al. [59] reported a reduction of both indices in Picea abies at EMEP sites. More recently, Karlsson et al. [60] confirmed a reduction in AOT40 but did not find a change in POD1 for the same tree species. Between 2000 and 2014, AOT40 decreased in most of the European countries (except rural northern areas of Iceland, Svalbard and Sweden), while POD0 increased from 0.03 to 1.06 mmol O3 m−2 year−1 across Europe [35]. However, in warm and dry years, AOT40 increased [61] and PODY decreased [62] when compared to wet seasons. To correctly determine the long-term trends in the development of these indices, continual time series over several decades are, therefore, very much needed.
Recently, a new flux-based index combining stomatal exposure and crown defoliation has been determined to define critical levels (CLef) for forest protection against O3-induced visible injuries. Sicard et al. [63] recommended CLef to be less than 5 mmol m−2 year−1 POD1 for broadleaved species and less than 12 mmol m−2 year−1 POD1 for conifers. CLef representing ≥25% of crown defoliation is recommended to be maximal 17,000 and 19,000 ppbv h of AOT40 for conifers and broadleaved species, respectively. It is obvious that those new indices are inevitably linked to PODY and AOT40 and only new limits are set.
As the injuries induced by O3 deposition on cuticle are usually small [64], the negative effect of O3 uptake is connected mainly to stomatal O3 flux. The total flux of ozone to vegetation may be thought of as two components: stomatal flux (uptake through the stomatal pores) and non-stomatal flux (deposition to other surfaces in the canopy and also reaction with gaseous compounds in the canopy air-space). The ratio between stomatal and total O3 flux depends on actual microclimatic conditions and differs in various ecosystems (Table 1). The highest seasonal maxima of total O3 flux were recorded in Quercus ilex forest [62] followed by Populus grandidentata [65], Larix decidua and Pinus halepensis [66][67]. Daily mean values range from 0.8 nmol m–2 s–1 in Pinus sylvestris forest in Belgium [68] to 8.6 nmol m–2 s–1 in Q. ilex forest in Italy. See Table 1 for more details. Stomatal flux is determined by [O3] and two resistances connected in series (leaf boundary layer resistance and the stomatal resistance). While boundary layer resistance depends on wind speed and heat flux, stomatal resistance is primarily influenced by irradiance and VPD [69]. Stomatal O3 flux was found to be 37% of total O3 flux in a northern mixed hardwood forest [65], but it was 21% in semi-arid regions of Israel [66], and only 15% in Larix decidua, Alps, Italy [67]. However, in subalpine coniferous forest dominated by Engelmann spruce (Picea engelmannii) and subalpine fir (Abies lasiocarpa) in southern Wyoming, USA, 59% of stomatal O3 flux was found as an annual average [70]. Similarly, stomatal O3 flux dominated in Czech P. abies mountainous forest under moderately cool and humid climate [71]. Juráň et al. [29] found that stomatal flux represents 53.5% of total O3 flux during summer days with partly-cloudy conditions, but it decreases to 43.5% during sunny days. Moreover, a fraction of stomatal O3 flux could be further modulated by forest age [71][72]. Comparison of modelled and measured fluxes could be found elsewhere [29]. See Table 1 for more details.
Table 1. Examples of fractions of stomatal O3 fluxes to total O3 fluxes from different forest ecosystems. Notes: EC—eddy-covariance; *—Total deposition flux in µg m–2 s–1; **—value not specified.
| Forest Type | Species | Country | Total Deposition Flux (nmol m−2 s−1) |
Stomatal Flux (% of Total) |
Approach |
|---|---|---|---|---|---|
| Subalpine coniferous | Picea engelmannii and Abies lasiocarpa |
Wyoming, USA | 0.5–0.6 * (summer max) | 59 | EC |
| Mountainous | Picea abies | Czech Republic | 7.09 (daily mean) | dominant ** | modelling |
| Mountainous | Picea abies | Czech Republic | 14 (summer max) 2 (winter max) |
43.5–53.5 | EC |
| Northern mixed hardwood | Populus grandidentata | Michigan, USA | 27.7 (seasonal max) | 37 | EC |
| Evergreen Mediterranean | Quercus ilex | Italy | 6.9–8.6 (daily average) 51 (seasonal max) |
34.4 | EC |
| Coniferous | Pinus sylvestris | Belgium | 0.8–5.8 (daily mean) | 26 | modelling |
| Coniferous | Picea abies | Denmark | 0.5 * (5-years mean) | 21 | modelling |
| Coniferous | Pinus halepensis | Israel | 5–10 (seasonal range) | 21 | EC |
| Alpine | Larix decidua | Italy | 40 (summer daily max) | 15 | EC |
Non-stomatal O3 flux includes deposition onto the soil, stems and branches, cuticles and any external surface present. Chemical O3 sink also contributes to non-stomatal flux involving the reactions of O3 molecules with VOCs, NO and aerosols. Non-stomatal flux dominates in spring and summer because of the exponential increase of VOC concentration with increasing air temperature and solar radiation [73][74]. It is the period, when [O3] is usually the highest. Contrary to that, non-stomatal fluxes are negligible over the winter in temperate forests due to low VOC emissions to the atmosphere [75]. They were significant even at a moorland site in Scotland, without the complications of complex forest canopies: the non-stomatal O3 flux was up to 70% of the total flux [76]. These findings suggest that most of O3 deposits on leaf cuticles and/or wet layer of the moss, below the sparse herbaceous canopy.
Here we summarise the effects of O3 on NEP (net ecosystem productivity) and GPP (gross primary productivity) in several forest ecosystems estimated by eddy-covariance technique and modelling approaches (Table 2). The impacts of O3 are very diverse. There is no effect in mature Belgian Scots pine forest on GPP measured over 15 years, although critical levels of AOT40 and POD1 were exceeded in each year of measurement [77]. Similarly, in a poplar stand, Belgium, no effect on NEP was reported [78], even though stomatal O3 flux amounted up to 59% of the total O3 flux. On the other hand, a reduction of NEP was reported in Czech [71] and Swiss forests [79], particularly in Norway spruce and European beech stands. After 20 years of monitoring, the only mild effects of O3 on GPP and photosynthesis were observed in a broad-leaf Harvard forest. These findings were attributed to the fact that 40% of photosynthesis occurs lower in the canopy, in shade, where stomatal conductance and [O3] are lower [80]. So the canopy structure can also modulate the effect of O3.
Generally, a strong correlation of GPP to AOT40 index was shown [81]. Among others, a tight linear decrease of whole-plant dry mass with increasing daylight AOT40 was found in Japanese larch (Larix kaempferi) and beech (Fagus crenata) seedlings [82]. Comparing to the preindustrial era, a reduction of 1–16% of GPP was reported for USA vegetation covers [83]. Similarly, Karlsson [84] reported a reduction of living biomass stock due to O3 to be 2% in northern European countries but up to 32% in central European countries [85]. One of the highest, as much as 24.8%, reduction rates of NEP were for a Norway spruce forest [28] with the highest decrease in July, the warmest month of the year.
Wang et al. [86] modelled biomass carbon stock over 500 years involving a successional series of the temperate deciduous forests. No change of carbon stock was reported due to the change of forest species over the time period with the increasing dominance of isoprene-emitting species. Isoprene acts as a shielding agent preventing O3 to enter the stomatal aperture—isoprene outside of the leaf reacts with O3 [87]. It is clear, that O3 was not an issue for half a millennium, however, it shows a possible direction of how natural ecosystems might possibly evolve and adapt in a O3-rich world by a mechanism incorporating successional dynamics.
Table 2. Effects of O3 on various carbon-related criterion. GPP—gross primary production, NEE—net ecosystem exchange, NEP—net ecosystem productivity.
| Type of Ecosystem | Dominant Plant | O3 Effect | Country | Criterion |
|---|---|---|---|---|
| Mature stand | Scots pine | neutral | Belgium | GPP |
| Plantation | mix of poplars | neutral | Belgium | NEE |
| Mature stand | Stone pine | neutral | Italy | GPP |
| Mixed hardwood/conifer forests | Red oak, Red maple | negligible | USA | GPP |
| USA vegetation | - | reduction 1–16% | USA | GPP |
| Young stand | Norway spruce | reduction | Czech Republic | NEP |
| Young stand | Norway spruce | reduction 24.8% | Czech Republic | NEP |
| Young stand | Ponderosa pine | reduction 12% | USA | GPP |
| Orchard | Orange orchard | reduction 19% | USA | GPP |
| Flux sites in Europe and USA | - | reduction 6–29% deciduous forest reduction 4–20% evergreen needle leaf forest |
Europe, USA | biomass |
References
- Granier, C.; Bessagnet, B.; Bond, T.; D’Angiola, A.; van der Gon, H.D.; Frost, G.J.; Heil, A.; Kaiser, J.W.; Kinne, S.; Klimont, Z.; et al. Evolution of anthropogenic and biomass burning emissions of air pollutants at global and regional scales during the 1980–2010 period. Clim. Chang. 2011, 109, 163.
- Parrish, D.D.; Lamarque, J.-F.; Naik, V.; Horowitz, L.; Shindell, D.T.; Staehelin, J.; Derwent, R.; Cooper, O.R.; Tanimoto, H.; Volz-Thomas, A.; et al. Long-term changes in lower tropospheric baseline ozone concentrations: Comparing chemistry-climate models and observations at northern midlatitudes. J. Geophys. Res. 2014, 119, 5719–5736.
- Royal Society. Ground-Level Ozone in the 21st Century: Future Trends, Impacts and Policy Implications; The Royal Society: London, UK, 2008; ISBN 978-0-85403-713-1.
- Cooper, O.R.; Parrish, D.D.; Ziemke, J.; Balashov, N.V.; Cupeiro, M.; Galbally, I.E.; Gilge, S.; Horowitz, L.; Jensen, N.R.; Lamarque, J.-F.; et al. Global distribution and trends of tropospheric ozone: An observation- based review. Elementa 2014, 2, 000029.
- Archibald, A.T.; Turnock, S.T.; Griffiths, P.T.; Cox, T.; Derwent, R.G.; Knote, C.; Shin, M. On the changes in surface ozone over the twenty-first century: Sensitivity to changes in surface temperature and chemical mechanisms. Phil. Trans. R. Soc. 2020, 378, 20190329.
- Luwe, M.; Heber, U. Ozone detoxification in the apoplasm and symplasm of spinach, broad bean and beech leaves at ambient and elevated concentrations of ozone in air. Planta 1995, 197, 448–455.
- Wieser, G.; Matyssek, R. Linking ozone uptake and defense towards a mechanistic risk assessment for forest trees. New Phytol. 2007, 174, 7–9.
- Volz, A.; Kley, D. Evaluation of the Montsouris series of ozone measurements made in the nineteenth century. Nature 1988, 332, 240–242.
- Marenco, A.; Gouget, H.; Nédélec, P.; Pagés, J.-P. Evidence of a long-term increase in tropospheric ozone from Pic du Midi series: Consequences: Positive radiative forcing. J. Geophys. Res. 1994, 99, 16617–16632.
- Warmbt, W. Luftchemische Untersuchungen des bodennahen Ozons 1952–1964: Methoden und Ergebnisse; Abhandlungen des Meteorologischen Dienstes der Deutschen Demokratischen Republick Nr 72 [Band X]; Akademie-Verlag: Berlin, Germany, 1964.
- Haagen-Smit, A.J. Chemistry and physiology of Los Angeles smog. Ind. Eng. Chem. Res. 1952, 44, 1342–1346.
- Tingey, D.; Hogsett, W.; Lee, E.; Laurence, J.A. Stricter ozone ambient air quality standard has beneficial effect on ponderosa pine in California. Environ. Manag. 2004, 34, 397–405.
- Lee, E.H.; Tingey, D.T.; Hogsett, W.E.; Laurence, J.A. History of tropospheric ozone for the San Bernardino Mountains of Southern California, 1963–1999. Atmos. Environ. 2003, 37, 2705–2717.
- Chang, K.-L.; Petropavlovskikh, I.; Cooper, O.R.; Schultz, M.G.; Wang, T. Regional trend analysis of surface ozone observations from monitoring networks in eastern North America, Europe and East Asia. Elementa 2017, 5, 50.
- Gaudel, A.; Cooper, O.R.; Ancellet, G.; Barret, B.; Boynard, A.; Burrows, J.P.; Clerbaux, C.; Coheur, P.-F.; Cuesta, J.; Cuevas, E.; et al. Tropospheric ozone assessment report: Present-day distribution and trends of tropospheric ozone relevant to climate and global atmospheric chemistry model evaluation. Elementa 2018, 6, 39.
- Zhang, Q.; Yuan, B.; Shao, M.; Wang, X.; Lu, S.; Lu, K.; Wang, M.; Chen, L.; Chang, C.-C.; Liu, S.C. Variations of ground-level O3 and its precursors in Beijing in summertime between 2005 and 2011. Atmos. Chem. Phys. 2014, 14, 6089–6101.
- Li, J.F.; Lu, K.; Lv, W.; Li, J.; Zhong, L.; Ou, Y.; Chen, D.; Huang, X.; Zhang, Y. Fast increasing of surface ozone concentrations in Pearl River Delta characterized by a regional air quality monitoring network during 2006–2011. J. Environ. Sci. 2014, 26, 23–36.
- Fu, Y.; Liao, H. Simulation of the interannual variations of biogenic emissions of volatile organic compounds in China: Impacts on tropospheric ozone and secondary organic aerosol. Atmos. Environ. 2012, 59, 170–185.
- Zhang, X.; Du, J.; Zhang, L.; Huang, T.; Gao, H.; Mao, X.; Ma, J. Impact of afforestation on surface ozone in the North China Plain during the three-decade period. Agric. For. Meteorol. 2020, 287, 107979.
- Lu, X.; Zhang, L.; Zhao, Y.; Jacob, D.J.; Hu, Y.; Hu, L.; Gao, M.; Liu, X.; Petropavlovskikh, I.; McClure-Begley, A.; et al. Surface and tropospheric ozone trends in the Southern Hemisphere since 1990: Possible linkages to poleward expansion of the Hadley circulation. Sci. Bull. 2019, 64, 400–409.
- Anet, J.G.; Steinbacher, M.; Gallardo, L.; Velásquez Álvarez, P.A.; Emmenegger, L.; Buchmann, B. Surface ozone in the Southern Hemisphere: 20 years of data from a site with a unique setting in El Tololo, Chile. Atmos. Chem. Phys. 2017, 17, 6477–6492.
- Xu, J.; Huang, X.; Wang, N.; Li, Y.; Ding, A. Understanding ozone pollution in the Yangtze River Delta of eastern China from the perspective of diurnal cycles. Sci. Total. Environ. 2021, 752, 141928.
- Calfapietra, C.; Fares, S.; Manes, F.; Morani, A.; Sgrigna, G.; Loreto, F. Role of Biogenic Volatile Organic Compounds (BVOC) emitted by urban trees on ozone concentration in cities: A review. Environ. Pollut. 2013, 183, 71–80.
- Young, P.J.; Archibald, A.T.; Bowman, K.W.; Lamarque, J.-F.; Naik, V.; Stevenson, D.S.; Tilmes, S.; Voulgarakis, A.; Wild, O.; Bergmann, D.; et al. Pre-industrial to end 21st century projections of tropospheric ozone from the Atmospheric Chemistry and Climate Model Intercomparison Project (ACCMIP). Atmos. Chem. Phys 2013, 13, 2063–2090.
- Akimoto, H. Global air quality and pollution. Science 2003, 302, 1716–1719.
- Logan, J.A. Tropospheric ozone: Seasonal behavior, trends, and anthropogenic influence. J. Geophys. Res. 1985, 90, 10463–10482.
- Monks, P.S. A review of the observations and origins of the spring ozone maximum. Atmos. Environ. 2000, 34, 3545–3561.
- Juráň, S.; Edwards-Jonášová, M.; Cudlín, P.; Zapletal, M.; Šigut, L.; Grace, J.; Urban, O. Prediction of ozone effects on net ecosystem production of Norway spruce forest. iForest 2018, 11, 743–750.
- Juráň, S.; Šigut, L.; Holub, P.; Fares, S.; Klem, K.; Grace, J.; Urban, O. Ozone flux and ozone deposition in a mountain spruce forest are modulated by sky conditions. Sci. Total. Environ. 2019, 672, 296–304.
- Hůnová, I.; Brabec, M.; Malý, M. Trends in ambient O3 concentrations at twelve sites in the Czech Republic over the past three decades: Close inspection of development. Sci. Total. Environ. 2020, 746, 141038.
- Tang, G.; Wang, Y.; Li, X.; Ji, D.; Hsu, S.; Gao, X. Spatial-temporal variations in surface ozone in Northern China as observed during 2009–2010 and possible implications for future air quality control strategies. Atmos. Chem. Phys. 2012, 12, 2757–2776.
- Ding, A.J.; Fu, C.B.; Yang, X.Q.; Sun, J.N.; Zheng, L.F.; Xie, Y.N.; Herrmann, E.; Nie, W.; Petäjä, T.; Kerminen, V.-M.; et al. Ozone and fine particle in the western Yangtze River Delta: An overview of 1 yr data at the SORPES station. Atmos. Chem. Phys. 2013, 13, 5813–5830.
- Jiang, J.; Aksoyoglu, S.; Ciarelli, G.; Baltensperger, U.; Prévôt, A.S.H. Changes in ozone and PM2.5 in Europe during the period of 1990–2030: Role of reductions in land and ship emissions. Sci. Total. Environ. 2020, 741, 140467.
- Parrish, D.D.; Law, K.S.; Staehelin, J.; Derwent, R.; Cooper, O.R.; Tanimoto, H.; Volz-Thomas, A.; Gilge, S.; Scheel, H.-E.; Steinbacher, M.; et al. Long-term changes in lower tropospheric baseline ozone concentrations at northern mid-latitudes. Atmos. Chem. Phys. 2012, 12, 11485–11504.
- Proietti, C.; Fornasier, M.F.; Sicard, P.; Anav, A.; Paoletti, E.; De Marco, A. Trends in tropospheric ozone concentrations and forest impact metrics in Europe over the time period 2000–2014. J. For. Res. 2020.
- Oltmans, S.J.; Lefohn, A.S.; Shadwick, D.; Harris, J.M.; Scheel, H.E.; Galbally, I.; Tarasick, D.W.; Johnosn, B.J.; Brunke, E.-G.; Claude, H. Recent tropospheric ozone changes—A pattern dominated by slow or no growth. Atmos. Environ. 2013, 67, 331–351.
- Thompson, A.M.; Balashov, N.V.; Witte, J.C.; Coetzee, J.G.R.; Thouret, V.; Posny, F. Tropospheric ozone increases over the southern Africa region: Bellwether for rapid growth in Southern Hemisphere pollution? Atmos. Chem. Phys. 2014, 14, 9855–9869.
- Staehelin, J.; Tummon, F.; Revell, L.; Stenke, A.; Peter, T. Tropospheric ozone at northern mid-latitudes: Modeled and measured long-term changes. Atmosphere 2017, 8, 163.
- Dizengremel, P.; Thiec, D.L.; Bagard, M.; Jolivet, Y. Ozone risk assessment for plants: Central role of metabolism-dependent changes in reducing power. Environ. Pollut. 2008, 156, 11–15.
- Zapletal, M.; Juráň, S.; Krpeš, V.; Michna, K.; Edwars-Jonášová, M.; Cudlín, P. Effect of ozone flux on selected structural and antioxidant characteristics of a mountain norway spruce forest. Balt. For. 2018, 24, 261–267.
- Pellegrini, E.; Hoshika, Y.; Dusart, N.; Cotrozzi, L.; Gérard, J.; Nali, C.; Vaultier, M.-N.; Jolivet, Y.; Lorenzini, G.; Paoletti, E. Antioxidative responses of three oak species under ozone and water stress conditions. Sci. Total Environ. 2019, 647, 390–399.
- Jolivet, Y.; Bagard, M.; Cabané, M.; Vaultier, M.-N.; Gandin, A.; Afif, D.; Dizengremel, P.; Le Thiec, D. Deciphering the ozone-induced changes in cellular processes: A prerequisite for ozone risk assessment at the tree and forest levels. Ann. For. Sci. 2016, 73, 923–943.
- Kivimäenpää, M.; Sutinen, S.; Calatayud, V.; Sanz, M.J. Visible and microscopic needle alterations of mature Aleppo pine (Pinus halepensis) trees growing on an ozone gradient in eastern Spain. Tree Physiol. 2010, 30, 541–554.
- Vollenweider, P.; Woodcock, H.; Kelty, M.; Hofer, R.-M. Reduction of stem growth and site dependency of leaf injury in Massachusetts black cherries exhibiting ozone symptoms. Environ. Pollut. 2003, 125, 467–480.
- Sitch, S.; Cox, P.; Collins, W.; Huntingford, C. Indirect radiative forcing of climate change through ozone effects on the land-carbon sink. Nature 2007, 448, 791–794.
- Ainsworth, E.A.; Yendrek, C.R.; Sitch, S.; Collins, W.J.; Emberson, L.D. The effects of tropospheric ozone on net primary productivity and implications for climate change. Ann. Rev. Plant Biol. 2012, 63, 637–661.
- Wittig, V.E.; Ainsworth, E.A.; Long, S.P. To what extent do current and projected increases in surface ozone affect photosynthesis and stomatal conductance of trees? A meta-analytic review of the last 3 decades of experiments. Plant Cell Environ. 2007, 30, 1150–1162.
- Matyssek, R.; Wieser, G.; Ceulemans, R.; Rennenberg, H.; Pretzsch, H.; Haberer, K.; Löw, M.; Nunn, A.J.; Werner, H.; Wipfler, P.; et al. Enhanced ozone strongly reduces carbon sink strength of adult beech (Fagus sylvatica)—Resume from the free-air fumigation study at Kranzberg Forest. Environ. Pollut. 2010, 158, 2527–2532.
- Wittig, V.E.; Ainsworth, E.A.; Naidu, S.L.; Karnosky, D.F.; Long, S.P. Quantifying the impact of current and future tropospheric ozone on tree biomass, growth, physiology and biochemistry: A quantitative meta-analysis. Glob. Chang. Biol. 2009, 15, 396–424.
- Mrak, T.; Eler, K.; Badea, O.; Hoshika, Y.; Carrari, E.; Paoletti, E.; Kraigher, H. Elevated ozone prevents acquisition of available nitrogen due to smaller root surface area in poplar. Plant Soil 2020, 450, 585–599.
- Arbaugh, M.J.; Miller, P.R.; Carroll, J.J.; Takemoto, B.; Procter, T. Relationships of ozone exposure to pine injury in the Sierra Nevada and San Bernardino Mountains of California, USA. Environ. Pollut. 1998, 101, 291–301.
- Anav, A.; De Marco, A.; Friedlingstein, P.; Savi, F.; Sicard, P.; Sitch, S.; Vitale, M.; Paoletti, E. Growing season extension affects ozone uptake by European forests. Sci. Total Environ. 2019, 669, 1043–1052.
- Nezval, O.; Krejza, J.; Světlík, J.; Šigut, L.; Horáček, P. Comparison of traditional ground-based observations and digital remote sensing of phenological transitions in a floodplain forest. Agric. For. Meteorol. 2020, 291, 108079.
- Hoshika, Y.; Carrari, E.; Mariotti, B.; Martini, S.; De Marco, A.; Sicard, P.; Paoletti, E. Flux-based ozone risk assessment for a Plant Injury Index (PII) in three european cool-temperate deciduous tree species. Forests 2020, 11, 82.
- Hůnová, I. Ambient air quality in the Czech republic: Past and present. Atmosphere 2020, 11, 214.
- UNECE, United Nations Economic Commission for Europe. Mapping Critical Levels for Vegetation. Manual on Methodologies and Criteria for Modelling and Mapping Critical Loads & Levels and Air Pollution Effects, Risks and Trends; United Nations Economic Commission for Europe (UNECE) Convention on Long Range Transboundary Air Pollution: Geneva, Switzerland, 2010.
- Paoletti, E.; Alivernini, A.; Anav, A.; Badea, O.; Carrari, E.; Chivulescu, S.; Conte, A.; Ciriani, M.L.; Dalstein-Richier, L.; De Marco, A.; et al. Toward stomatal-flux based forest protection against ozone: The MOTTLES approach. Sci. Total Environ. 2019, 691, 516–527.
- Araminienė, V.; Sicard, P.; Anav, A.; Agathokleous, E.; Stakėnas, V.; De Marco, A.; Varnagirytė-Kabašinskienė, I.; Paoletti, E.; Girgždienė, R. Trends and inter-relationships of ground-level ozone metrics and forest health in Lithuania. Sci. Total Environ. 2019, 658, 1265–1277.
- Klingberg, J.; Engardt, M.; Karlsson, P.E.; Langner, J.; Pleijel, H. Declining ozone exposure of European vegetation under climate change and reduced precursor emissions. Biogeosciences 2014, 11, 5269–5283.
- Karlsson, P.E.; Klingberg, J.; Engardt, M.; Andersson, C.; Langner, J.; Karlsson, G.P.; Pleijel, H. Past, present and future concentrations of ground-level ozone and potential impacts on ecosystems and human health in northern Europe. Sci. Total Environ. 2017, 576, 22–35.
- Hůnová, I.; Schreiberová, M. Ambient ozone phytotoxic potential over the Czech forests as assessed by AOT40. iForest 2012, 5, 153–162.
- Gerosa, G.; Vitale, M.; Finco, A.; Manes, F.; Denti, A.B.; Cieslik, S. Ozone uptake by an evergreen Mediterranean Forest (Quercus ilex) in Italy. Part I: Micrometeorological flux measurements and flux partitioning. Atmos. Environ. 2005, 39, 3255–3266.
- Sicard, P.; De Marco, A.; Carrari, E.; Dalstein-Richier, L.; Hoshika, Y.; Badea, O.; Pitar, D.; Fares, S.; Conte, A.; Popa, I.; et al. Epidemiological derivation of flux-based critical levels for visible ozone injury in European forests. J. For. Res. 2020, 31, 1509–1519.
- Fares, S.; Weber, R.; Park, J.; Gentner, D.; Karlik, J.; Goldstein, A.H. Ozone deposition to an orange orchard: Partitioning between stomatal and non-stomatal sinks. Environ. Pollut. 2012, 169, 258–266.
- Hogg, A.; Uddling, J.; Ellsworth, D.; Carroll, M.A.; Pressley, S.; Lamb, B.; Vogel, C. Stomatal and non-stomatal fluxes of ozone to a northern mixed hardwood forest. Tellus 2007, 59, 514–525.
- Li, Q.; Gabay, M.; Rubin, Y.; Raveh-Rubin, S.; Rohatyn, S.; Tatarinov, F.; Rotenberg, E.; Ramati, E.; Dicken, U.; Preisler, Y.; et al. Investigation of ozone deposition to vegetation under warm and dry conditions near the Eastern Mediterranean coast. Sci. Total Environ. 2019, 658, 1316–1333.
- Finco, A.; Marzuoli, R.; Chiesa, M.; Gerosa, G. Ozone risk assessment for an Alpine larch forest in two vegetative seasons with different approaches: Comparison of POD1 and AOT40. Environ. Sci. Pollut. Res. 2017, 24, 26238–26248.
- Verryckt, L.T.; Op De Beeck, M.; Neirynck, J.; Gielen, B.; Roland, M.; Janssens, I.A. No impact of tropospheric ozone on the gross primary productivity of a Belgian pine forest. Biogeosciences 2017, 14, 1839–1855.
- Monteith, J.L.; Unsworth, M.H. Principles of Environmental Physics; Edward Arnold: London, UK, 1973; ISBN 0713123753.
- Zeller, K.F.; Nikolov, N.T. Quantifying simultaneous fluxes of ozone, carbon dioxide and water vapor above a subalpine forest ecosystem. Environ. Pollut. 2000, 107, 1–20.
- Zapletal, M.; Cudlin, P.; Chroust, P.; Urban, O.; Pokorny, R.; Edwards-Jonasova, M.; Czerny, R.; Janous, D.; Taufarova, K.; Vecera, Z.; et al. Ozone flux over a Norway spruce forest and correlation with net ecosystem production. Environ. Pollut. 2011, 159, 1024–1034.
- Mikkelsen, T.N.; Ro-Poulsen, H.; Hovmand, M.F.; Jensen, N.O.; Pilegaard, K.; Egeløv, A.H. Five-year measurements of ozone fluxes to a Danish Norway spruce canopy. Atmos. Environ. 2004, 38, 2361–2371.
- Tingey, D.; Turner, D.; Weber, J. Factors controlling the emission of monoterpenes and other volatile organic compounds. In Trace Gas Emissions by Plants; Sharkey, T., Mooney, H., Holland, E., Eds.; Academic: San Diego, CA, USA, 1991; ISBN 012639010X.
- Juráň, S.; Pallozzi, E.; Guidolotti, G.; Fares, S.; Šigut, L.; Calfapietra, C.; Alivernini, A.; Savi, F.; Večeřová, K.; Křůmal, K.; et al. Fluxes of biogenic volatile organic compounds above temperate Norway spruce forest of the Czech Republic. Agric. For. Meteorol. 2017, 232, 500–513.
- Fares, S.; McKay, M.; Holzinger, R.; Goldstein, A.H. Ozone fluxes in a Pinus ponderosa ecosystem are dominated by non-stomatal processes: Evidence from long-term continuous measurements. Agric. For. Meteorol. 2010, 150, 420–431.
- Fowler, D.; Flechard, C.; Cape, J.N.; Storeton-West, R.L.; Coyle, M. Measurements of ozone deposition to vegetation quantifying the flux, the stomatal and non-stomatal components. Water Air Soil Pollut. 2001, 130, 63–74.
- Fares, S.; Vargas, R.; Detto, M.; Goldstein, A.H.; Karlik, J.; Paoletti, E.; Vitale, M. Tropospheric ozone reduces carbon assimilation in trees: Estimates from analysis of continuous flux measurements. Glob. Chang. Biol. 2013, 19, 2427–2443.
- Zona, D.; Gioli, B.; Fares, S.; De Groote, T.; Pilegaard, K.; Ibrom, A.; Ceulemans, R. Environmental controls on ozone fluxes in a poplar plantation in Western Europe. Environ. Pollut. 2014, 184, 201–210.
- Braun, S.; Schindler, C.; Rihm, B. Growth losses in Swiss forests caused by ozone: Epidemiological data analysis of stem increment of Fagus sylvatica L. and Picea abies Karst. Environ. Pollut. 2014, 192, 129–138.
- Yue, X.; Keenan, T.F.; Munger, W.; Unger, N. Limited effect of ozone reductions on the 20-year photosynthesis trend at Harvard forest. Glob. Chang. Biol. 2016, 22, 3750–3759.
- Holmes, C.D. Air pollution and forest water use. Nature 2014, 507, E1–E2.
- Yamaguchi, M.; Watanabe, M.; Matsumura, H.; Kohno, Y.; Izuta, T. Experimental studies on the effects of ozone on growth and photosynthetic activity of japanese forest tree species. Asian J. Atmos. Environ. 2011, 5, 65–78.
- Yue, X.; Unger, N. Ozone vegetation damage effects on gross primary productivity in the United States. Atmos. Chem. Phys. 2014, 14, 9137–9153.
- Karlsson, P.E. Ozone Impacts on Carbon Sequestration in Northern and Central European Forests; IVL Report B 2065; IVL Swedish Environmental Research Institute: Gothenburg, Sweden, 2012.
- Ducker, J.A.; Holmes, C.D.; Keenan, T.F.; Fares, S.; Goldstein, A.H.; Mammarella, I.; William Munger, J.; Schnell, J. Synthetic ozone deposition and stomatal uptake at flux tower sites. Biogeosciences 2018, 15, 5395–5413.
- Wang, B.; Shugart, H.; Shuman, J.; Lerdau, M.T. Forests and ozone: Productivity, carbon storage and feedbacks. Sci. Rep. 2016, 6, 22133.
- Loreto, F.; Velikova, V. Isoprene produced by leaves protects the photosynthetic apparatus against ozone damage, quenches ozone products, and reduces lipid peroxidation of cellular membranes. Plant Physiol. 2001, 127, 1781–1787.


