This work implements parametric tools to optimize the environmental design of urban adaptive shadings through multiobjective evolutionary algorithms that look for solutions of dynamic (time-changing) structures used in open public spaces. The proposal is located in Malecon Cancun Tajamar in the southeast part of Mexico, and the main objective is to enhance the thermal comfort of users as well as to become part of the social dynamics of the place reinforcing identity through appropriation. The proposed workflow includes four steps: (1) geometric modelling by parametric modelling tools; (2) simulation of environmental parameters by using BPS tools; (3) shape optimization by using an evolutionary algorithm; and (4) environmental verification of the results. The Universal Thermal Climate Index (UTCI) was used to assess the outdoor thermal comfort derived from the dynamic shadings. The results showed a significant improvement in the thermal comfort with absolute UTCI differences of 3.9, 7.4, and 3.1 °C at 8, 12, and 16 h, respectively, during the summer; and absolute differences of 1.4, 3.5, and 2 °C at 8, 12, and 16 h, respectively, during the winter. The proposed workflow can help to guide the early design process of dynamic shadings by finding optimal solutions that enhance outdoor thermal comfort.
1. Introduction
Urban livability refers to the quality of life and wellbeing of residents in cities
[1]. The concept includes the impact of environmental and climatic factors such as air temperature, air, and water quality, wind speed, relative humidity, solar radiation, and qualitative indicators of quality of life, pleasure, and joy
[2][3]. Among these, the consideration of thermal comfort has been a focus of interest as urban climate affects all aspects of the city including building interiors, city architecture, and open spaces
[1]. Hence, it has been seen that thermal comfort of urban open spaces promotes social life, interrelations of residents, and economic activities; or contrarily, enhances isolation and social exclusion
[4].
Urban livability is also concerned with the aesthetics and physical characteristics of buildings, streets, and development blocks: “Creating pedestrian-friendly enclosures and neighborhoods where residents can conveniently walk from home to school, and parks are central to the vision of livable cities of new urbanists
[5].” In addition to this, all the elements that configure the urban public space should contribute to the appropriation of its users; the public space is not only the place of encounter, but also the place where citizenship is built and identity is reinforced
[6]. Essentially, this means that when considering the quality of public space, it must be taken into consideration that there are also intangible factors that are key to the success of the intervention in the urban environment.
It is therefore important to create comfortable thermal environments in urban open spaces that promote an intensive use of places boosting its role not only as leisure or resting facilities but also as part of the population’s daily experience. Designers and planners require guides with a comprehensive understanding of outdoor thermal comfort to improve the living conditions of cities. It is important that these elements also take into account its symbolic possibilities.
Shadings are an important factor in urban outdoors since they can block direct solar radiation and affect thermal environments and long-term thermal comfort. The role of shadings on outdoor thermal comfort has been examined in several studies under different climatic conditions
[7][8][9][10][11][12]. Most of these studies have been conducted in temperate and cold climates, and some of them were conducted in subtropical humid climates. Their findings have provided valuable information on understanding the effects of outdoor climatic conditions on people’s thermal sensation as well as the use of outdoor spaces.
In
[13], researchers discussed the shading effect on long-term outdoor thermal comfort in a hot and humid climate, finding that different shading levels contribute to variation in the thermal perception distribution. They also found that the frequencies of hot discomfort at the shaded locations were significantly lower than that of barely shaded spaces. In the end, the authors recommended multiple shading types and different shading levels for outdoor space design to allow users to choose their preferred thermal comfort condition.
In
[14], researchers conducted an investigation in hot and humid regions, reiterating the importance of shade in outdoor environments and discussing the thermal requirements based on characteristics of local residents. They found that few people visit squares when the thermal index is high, whereas the largest number of people visiting the outdoors is when the thermal condition is close to their thermal comfort range. An interesting finding derived from this study was that solar radiation and the level of shading play more important roles than the air temperature and wind speed in outdoor spaces.
Similarly, thermal comfort in outdoor urban spaces was studied in
[15], finding that the sun sensation/solar radiation has the most significant influence on human thermal sensation in outdoor spaces in tropical climates. According to
[16], the most important parameters that determine the use of public space are air temperature and solar radiation, with differences depending on the time of day. Other authors
[17] also pointed out the importance of the shade, together with the geometry, shape, and density of urban morphology to understand the climatic conditions and thermal comfort.
In
[18], the authors examined the seasonal effects on urban street shading and long-term outdoor thermal comfort in subtropical climates. The results suggested that a certain shading level is best for urban streets; thus, some shading devices may be added in the summer and removed in the winter. Correlation analysis revealed that thermal comfort is best when a location is shaded in the spring, summer, and autumn; in the winter, thermal comfort is best when a location has little shade.
In
[19], a bus stop shade was designed for three different climates that ranged from hot to cold. The aim was to minimize the amount of shade material and to allow occupants to be comfortable. A new method named ComfortCover was proposed, consisting of three main steps. First, the method assessed the radiation falling on a person in order to calculate the solar-adjusted radiant temperature. Then, calculations of the Universal Thermal Climate Index (UTCI) were run to identify ranges of thermal stress. Lastly, sun projections from the location of a person through the shade were considered. In the end, the method demonstrated to be suitable for most design applications and flexible within the visual programming of Grasshopper through Ladybug tools.
Based on the above review, it can be seen that most of the outdoor thermal comfort studies have been traditionally developed in temperate cities
[20], but research in tropical or equatorial zones has been increasing
[21]. As much urbanization occurs in these low-latitude areas, these settlements are also enhancing their development and management of urban spaces
[22]. Therefore, it is worth carrying out a study to evaluate the outdoor thermal environment conditions and human thermal comfort in a tropical climate of Mexico. This particular climatic and geographical region was selected in this work as the first approach to assess the shading effect on outdoor thermal comfort.
From the literature review, it was also observed that many researchers have tested the role of shadings in outdoor environments as an important strategy to improve pedestrian comfort. Conclusions from these investigations indicated the advantages of using ‘different shading levels’ for outdoor spaces allow users to choose their preferred thermal condition. However, these conclusions were projections based on their findings, but neither dynamic nor movable structures were explored. Instead, different types of fixed shading devices were analyzed at representative times over the year. Therefore, it is also worth assessing the environmental and adaptive design of urban shadings through parametric modelling tools that are nowadays integrated into the architectural design process—for example, the use of movable devices that change their design parameters (e.g., rotational and folding angles) according to seasonal variation and times of day.
Today, that research gap can be fulfilled with the advantage of computational tools: (1) The outdoor thermal comfort can be studied through ‘Building Performance Simulation (BPS)’ tools that allow detailed analysis for environmentally conscious architectural designs. (2) The dynamic design (many different solutions) can be systematically tested through the variation of several design parameters by using ‘Parametric Design’. The general idea behind Parametric Design is to use mathematical algorithms to optimize certain design goals against a set of design constraints. (3) The optimization design can be accomplished with the use of ‘Evolutionary Algorithms’
[23]. Among these algorithms, the ‘multiobjective optimization’ has the advantage of running detailed analytic tools coupled with comprehensive selection methods, within the Grasshopper interface.
A large and growing body of literature has investigated the performance of shadings with BPS software. Moreover, a growing body of literature deals with Parametric Design—although most of these studies are not focused on buildings’ environmental performance but on the design of complex geometries and structures
[24]. Commonly, findings from these two types of analyses are generalizable and applicable to the projects. It is, however, a relatively small body of literature that is concerned with evolutionary algorithms (they are relatively new). These algorithms are mainly used in industry and in areas such as engineering electrical electronics, computer science artificial intelligence, and automation control systems
[23].
2. Analysis on the Results
2.1. Fitness Values and Optimization Results
Table 1 and Table 2 enlist the optimal genomes for the summer and winter, respectively. As previously explained, the best solutions were ranked according to the fitness values and the process was repeated for each specific date and time. Table 1 and Table 2 also include the simulated results for the shaded area and the UTCI averaged over the unshaded evaluation area (144 m2) to allow for the comparison between the outdoor thermal conditions with and without the shadings. To better interpret the distribution of the thermal conditions over the entire evaluation area (144 m2), the latter was subdivided into five smaller areas that achieved a specific stress category of UTCI (°C):
Table 1. Data of phenotypes of 21 June.
| |
Population |
Fitness Values |
UTCI (Stress Category) |
| Day & Hour |
Generation |
Genoma |
Shaded area (m2) |
Average UTCI (°C)—
Unshaded Area |
Shaded Area |
| No Thermal Stress (m2) |
Slight Heat Stress (m2) |
Moderate Heat Stress (m2)
UTCI (°C) |
Strong Heat Stress (m2)
UTCI (°C) |
21 June
8 h |
49 |
0 |
18.02 |
37.0 |
0 |
0 |
10.7 |
7.4 |
| 49 |
1 |
17.94 |
37.0 |
0 |
0 |
10.8 |
7.4 |
| 49 |
2 |
18.18 |
37.0 |
0 |
0 |
10.4 |
7.8 |
| 49 |
3 |
18 |
37.0 |
0 |
0 |
10.7 |
7.3 |
| 49 |
4 |
17.9 |
37.0 |
0 |
0 |
10.9
30.6 |
7.0
37.0 |
| 49 |
5 |
17.94 |
37.0 |
0 |
0 |
10.8 |
7.1 |
| 49 |
6 |
18.1 |
37.0 |
0 |
0 |
10.5 |
7.6 |
| 47 |
2 |
18.18 |
37.0 |
0 |
0 |
10.4 |
7.8 |
| 48 |
4 |
17.9 |
37.0 |
0 |
0 |
10.9 |
7.0 |
21 June
12 h |
49 |
0 |
9.13 |
41.5 |
0 |
0 |
7.8
30.2 |
1.4
39.2 |
| 49 |
1 |
9.34 |
41.5 |
0 |
0 |
7.5 |
1.4 |
| 49 |
2 |
9.26 |
41.5 |
0 |
0 |
7.8 |
1.3 |
| 49 |
3 |
9.28 |
41.5 |
0 |
0 |
7.8 |
1.3 |
| 49 |
4 |
9.22 |
41.5 |
0 |
0 |
7.8 |
1.3 |
| 49 |
5 |
9.31 |
41.5 |
0 |
0 |
7.5 |
1.5 |
| 49 |
6 |
9.3 |
41.5 |
0 |
0 |
7.6 |
1.5 |
| 49 |
7 |
9.23 |
41.5 |
0 |
0 |
7.8 |
1.4 |
| 49 |
8 |
9.28 |
41.5 |
0 |
0 |
7.8 |
1.3 |
| 49 |
9 |
9.31 |
41.5 |
0 |
0 |
7.5 |
1.5 |
| 47 |
1 |
9.34 |
41.5 |
0 |
0 |
7.5 |
1.4 |
| 48 |
1 |
9.13 |
41.5 |
0 |
0 |
7.8 |
1.4 |
21 June
16 h |
49 |
0 |
19.92 |
34.9 |
0 |
0 |
14.6
26.7 |
5.3
32.0 |
| 49 |
1 |
20.21 |
34.9 |
0 |
0 |
14.9 |
5.3 |
| 49 |
2 |
20.05 |
34.9 |
0 |
0 |
14.7 |
5.4 |
| 49 |
3 |
20.06 |
34.9 |
0 |
0 |
14.7 |
5.4 |
| 49 |
4 |
20.18 |
34.9 |
0 |
0 |
14.8 |
5.4 |
| 49 |
5 |
20.18 |
34.9 |
0 |
0 |
14.8 |
5.4 |
| 49 |
6 |
20.21 |
34.9 |
0 |
0 |
14.9 |
5.3 |
| 49 |
7 |
20.21 |
34.9 |
0 |
0 |
14.9 |
5.3 |
| 49 |
8 |
20.02 |
34.9 |
0 |
0 |
14.7 |
5.4 |
| 48 |
0 |
19.92 |
34.9 |
0 |
0 |
14.6 |
5.3 |
| 48 |
1 |
20.21 |
34.9 |
0 |
0 |
14.9 |
5.3 |
Table 2. Data of phenotypes of 21 December.
| |
Population |
Fitness Values |
UTCI (Stress Category) |
| Day & Hour |
Generation |
Genoma |
Shaded Area
(m2) |
Average UTCI (°C)—
Unshaded Area |
Shaded Area |
No Thermal Stress (m2)
UTCI (°C) |
Slight Heat Stress
(m2)
UTCI (°C) |
Moderate Heat Stress (m2)
UTCI (°C) |
Strong Heat Stress (m2) |
21 December
8 h |
49 |
0 |
25.37 |
28.1 |
15.3 |
10.1 |
0 |
0 |
| 49 |
1 |
25.37 |
28.1 |
15.3
24.7 |
10.1
27.1 |
0 |
0 |
| 49 |
2 |
25.31 |
28.1 |
15.4 |
9.9 |
0 |
0 |
| 49 |
3 |
24.56 |
28.1 |
16.2 |
8.4 |
0 |
0 |
| 49 |
4 |
25.19 |
28.1 |
15.6 |
9.6 |
0 |
0 |
| 49 |
5 |
24.76 |
28.1 |
15.9 |
8.9 |
0 |
0 |
| 49 |
6 |
25.32 |
28.1 |
15.5 |
9.8 |
0 |
0 |
| 49 |
7 |
25.31 |
28.1 |
15.4 |
9.9 |
0 |
0 |
| 49 |
8 |
25.37 |
28.1 |
15.3 |
10.1 |
0 |
0 |
| 46 |
6 |
25.37 |
28.1 |
15.31 |
10.1 |
0 |
0 |
| 47 |
8 |
24.56 |
28.1 |
16.2 |
8.4 |
0 |
0 |
21 December
12 h |
49 |
0 |
15.63 |
33.6 |
0 |
10.4
26.7 |
5.2
30.0 |
0 |
| 49 |
1 |
15.69 |
33.6 |
0 |
10.2 |
5.5 |
0 |
| 49 |
2 |
15.64 |
33.6 |
0 |
10.4 |
5.2 |
0 |
| 47 |
4 |
15.63 |
33.6 |
0 |
10.4 |
5.2 |
0 |
| 48 |
1 |
15.69 |
33.6 |
0 |
10.2 |
5.5 |
0 |
21 December
16 h |
49 |
0 |
27.87 |
27.0 |
22.4 |
5.4 |
0 |
0 |
| 49 |
1 |
27.82 |
27.0 |
22.5 |
5.4 |
0 |
0 |
| 49 |
2 |
27.79 |
27.0 |
22.4
24.8 |
5.4
26.0 |
0 |
0 |
| 49 |
3 |
27.79 |
27.0 |
22.5 |
5.3 |
0 |
0 |
| 49 |
4 |
27.84 |
27.0 |
22.5 |
5.4 |
0 |
0 |
| 49 |
5 |
27.8 |
27.0 |
22.5 |
5.3 |
0 |
0 |
| 49 |
6 |
27.76 |
27.0 |
22.4 |
5.4 |
0 |
0 |
| 49 |
7 |
27.87 |
27.0 |
22.4 |
5.4 |
0 |
0 |
| 49 |
8 |
27.8 |
27.0 |
22.4 |
5.4 |
0 |
0 |
| 45 |
0 |
27.73 |
27.0 |
22.4 |
5.4 |
0 |
0 |
| 48 |
0 |
27.87 |
27.0 |
22.4 |
5.4 |
0 |
0 |
| 49 |
0 |
25.37 |
28.1 |
22.5 |
5.3 |
0 |
0 |
| 49 |
1 |
25.37 |
28.1 |
22.5 |
5.4 |
0 |
0 |
| 49 |
2 |
25.31 |
28.1 |
22.5 |
5.3 |
0 |
0 |
| 49 |
3 |
24.56 |
28.1 |
22.4 |
5.4 |
0 |
0 |
| 49 |
4 |
25.19 |
28.1 |
22.4 |
5.4 |
0 |
0 |
-
No thermal stress (+9 to +26)
-
Slight heat stress (+26 to +28)
-
Moderate heat stress (+28 to +32)
-
Strong heat stress (+32 to +38)
It is important to notice here that the shaded areas comprised different stress categories, depending on the time of the year, as Table 1 and Table 2 indicate. During the summer, the shaded area mostly included the moderate heat stress category. During the winter, the shaded area mostly included the no thermal stress and slight heat stress categories. There were, however, specific daytimes when the shaded area reached moderate heat stress (December at midday).
Results from these tables pointed out that all the optimal genomes achieved similar shaded areas and UTCI stress categories. The most interesting aspect of the data was the considerable improvement of the outdoor thermal conditions: the average UTCI (°C) under the exposed sunlit area vs. that under the shaded areas. To better understand the results, some phenotypes were highlighted in gray shading in Table 1 and Table 2 to exemplify the UTCI improvements. In the summer at 8 h, the unshaded area achieved an UTCI of 37 °C, whereas the shaded area 30.6 °C: an absolute difference of 6.4 °C. In the summer, the maximum difference was 11.3 °C at midday and 8.2 °C at 16 h. In the winter, the maximum differences were 3.4, 6.9, and 2.2 °C at 8, 12, and 16 h, respectively.
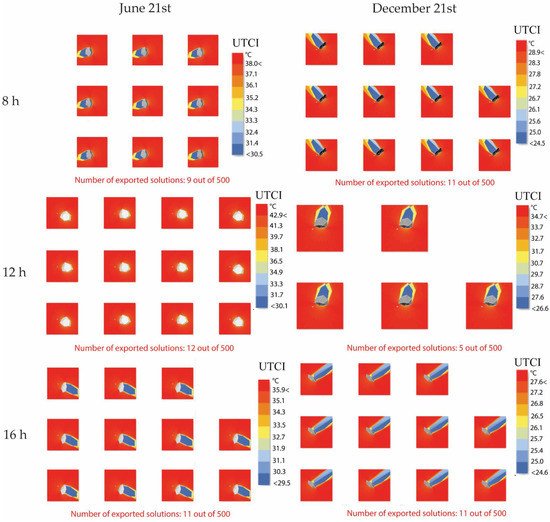
Figure 1 groups visualizations of the phenotypes listed on
Table 1 and
Table 2. From a plan view,
Figure 1 allows an overall comparison among the different shading positions at different times. For a close-up visualization of the different phenotypes, see
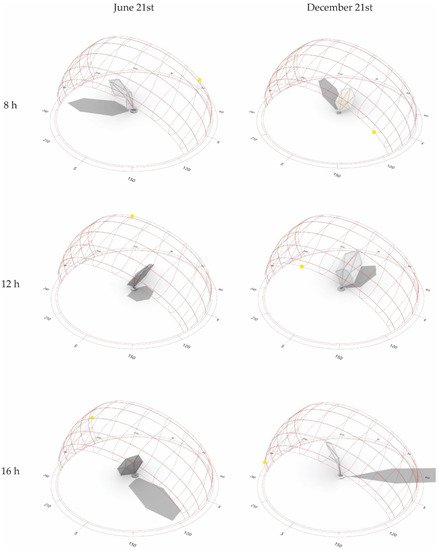
Appendix A. From the phenotypes, the time-changing positions of the dynamic shadings can be easily observed. To better visualize the variability throughout the day and seasons, some specific phenotypes are selected and presented in
Figure 2. Thus, the changes in the folding and rotational angles can be noticed. During the summer, the shading looks inclined during mornings, but almost vertically aligned at middays, and almost horizontally positioned during the afternoon. During the winter, the folding angles are similar to those displayed in the summer, but the rotational angles are different.
Figure 1. Pareto Front phenotypes: Solutions ranked as the best according to the two fitness objectives. For a close-up visualization of the different phenotypes and inputs, see
Appendix A.
Figure 2. Comparison among the phenotypes during specific times.
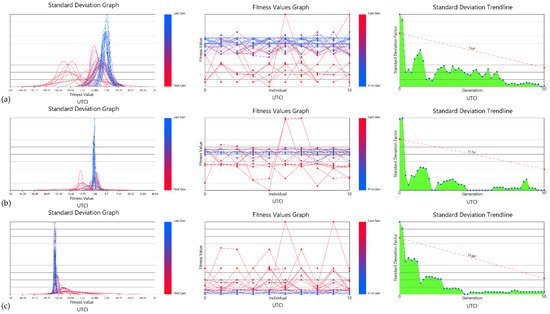
2.2. Verification of Results
In order to assess the environmental verification of the results, specific phenotypes were selected from the Pareto Front solutions (Figure 3). The selected phenotypes are listed in Table 3; they were modelled with the genes’ information taken from the Pareto Front. On average, the fitness optimization results showed a good agreement with the replicated shading results. This finding was significant for both the UTCI degrees and the shaded areas. From Table 3, it is observed that shadings affected the average outdoor thermal comfort significantly, particularly during the summer. For example, UTCI achieved 41.5 °C with no shadings but 34.1 °C with shadings, at midday. The absolute differences during the summer were 3.9, 7.4, and 3.1 °C at 8, 12, and 16 h, respectively. The absolute differences during the winter were 1.4, 3.5, and 2 °C at 8, 12, and 16 h, respectively. From here, it is confirmed that shadings contribute to enhancing the outdoor thermal comfort, which in turn influences the perception and satisfaction of the pedestrians. Thus, it is expected that the presence of the shadings in the open urban space also contributes to the overall outdoor thermal comfort due to the decreases in emitting the longwave radiation from the ground.
Figure 3. Second exercise with a population of 500 genomes. UTCI optimization graphs for 21 June: (a) 8 h, (b) 12 h, and (c) 16 h.
Table 3. Selected phenotypes.
| |
Population |
Fitness Values |
|
| Day/Hour |
Generation |
Genoma |
Shadows (m2) |
Average UTCI (°C)—Shaded Area |
Average UTCI (°C)—Unshaded Area |
| 21 June 8 h |
49 |
4 |
17.9 |
33.1 |
37.0 |
| 21 June 12 h |
49 |
0 |
9.13 |
34.1 |
41. 5 |
| 21 June 16 h |
49 |
0 |
19.92 |
31.8 |
34.9 |
| 21 December 8 h |
49 |
1 |
25.37 |
26.7 |
28.1 |
| 21 December 12 h |
49 |
0 |
15.63 |
30.1 |
33.6 |
| 21 December 16 h |
49 |
2 |
27.79 |
25.0 |
27.0 |
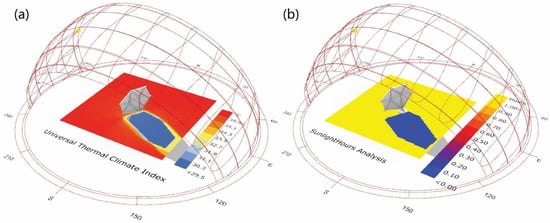
Concerning the environmental results, a specific shading configuration was included in Figure 4. Thus, the simulated results for 21 June, at 16 h, are revealed as an example of a selected phenotype performance.
Figure 4. Example of the results obtained from a selected phenotype (Generation 49, Genoma 0): (a) UTCI (°C) in 21 June at 16 h, and (b) shaded area (m2), in 21 June at 16 h.
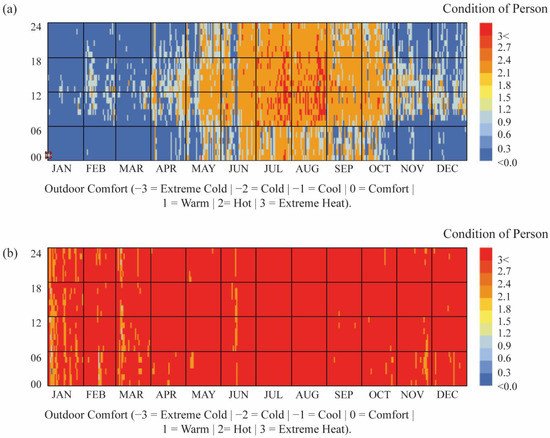
Furthermore, the yearly condition of a person under the shadings vs. under the exposed sunlit area (with no shadings) is compared. As a result, a significant improvement of the pedestrians’ thermal comfort is revealed. Figure 5b indicates a predominant stress category of extreme heat throughout the year when no shadings are placed on the site. This thermal condition is dangerous since it has been recognized as a potential public health hazard with higher-than-normal mortality rates. As observed from the temporal map, this problem would be present, even during the night hours. A possible explanation for this might be that the heat absorbed by the concrete pavement throughout the day is released to compensate for the drop in temperature.
Figure 5. Comparative of the condition of a person throughout the year: (a) Shaded conditions vs. (b) unshaded conditions. Hourly data from the EPW file of Cancun, Mexico.
Nevertheless, when the dynamic shadings are working in place, the dominant stress categories varying from comfortable to warm and hot throughout the year, as
Figure 5a depicts. According to these categories, the sensation is comfortable or warm but comfortable for short periods; moreover, no public health hazard is recognized. Here, it is important to note that these stress categories coincide with the UTCI degrees considered acceptable for this study context (please refer to
Section 3.2).
3. Discussion
This study has been successful as it was able to identify specific shadings positions (folding and rotational angles) for specific times during the year that allow enhancing the outdoor experience of pedestrians in terms of thermal comfort. Hence, the dynamic shadings responded to specific environmental conditions and contributed to reducing the thermal stress and to increasing the shaded areas. To develop a full picture of the adaptive shadings and environmental performance, additional optimizations during the hottest day of each month will be addressed in a continuation of this work.
Furthermore, it is expected that such dynamic shadings can contribute to the urban livability of the studied urban open space. This is an important issue for future research that should be undertaken to investigate how pedestrians interact with a prototype placed on site. Fabrication and assembly are now possible by using other digital electronic prototyping add-ons in Grasshopper, such as Firefly that works in conjunction with Arduino IDE and digital fabrication platforms such as RhinoCAM.
Regarding the time changing of the shadings, it not only provides more comfortable zones but also can make the public space more attractive. These structures are meant to have the potentiality to become part of the public art network of the place. This would add a sense of identity for the place and the users. In this respect, the exploration of the disposition of the structures in the public space is an interesting asset in terms of aesthetics and should be further explored.
In this work, the use of a multiobjective optimization algorithm was very important for identifying the best shading solutions. Hence, Wallacei X allows storing the results to replicate the genes and the 3D shadings for further evaluations. However, Wallacei X does not allow establishing specific ranges for the targets. This means that the function objectives should maximize or minimize a specific single fitness value. This could be considered a disadvantage when performing evaluations for temperate and cold climates, for which the condition of person could range from extreme cold to extreme hot. Other multiobjective optimization algorithms such as Octopus or Goldfish could be tested to find the option that better fits with the study objectives (although these algorithms do not allow storing the results).
From the above, the application of the proposed methodology should be further tested in other climates, unlike from the tropical one. To accomplish that, some adjustments to the fitness objectives should be carried out according to the climate studied. The final objective will be the same: the environmental adaptability of dynamic structures in open public spaces. As mentioned in the literature review, dynamic shadings represent a significant advantage, in comparison with static structures.
Different algorithms could be implemented in further investigations to test if they contribute to reducing the simulation and optimization times. By replicating the shapes derived from single-objective optimizations and comparing them with the shapes derived from multiobjective optimizations, UTCI data and shaded areas could also be compared. The continuous development of new algorithms seems to be quite promising to accomplish this task in the near future.
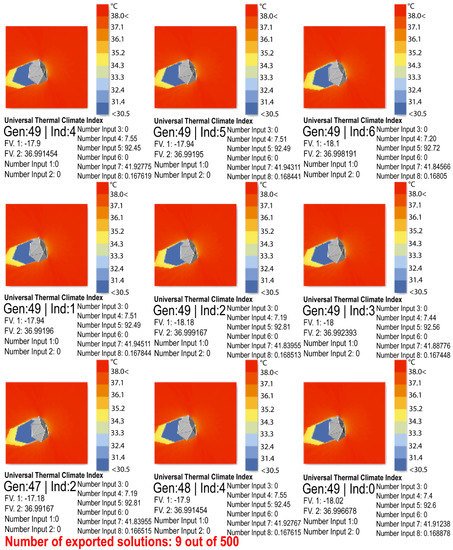
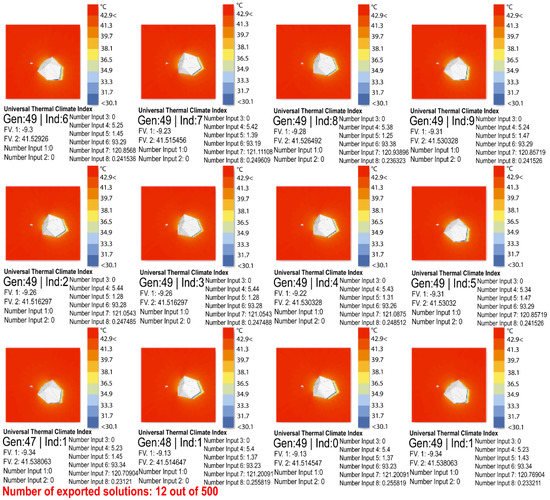
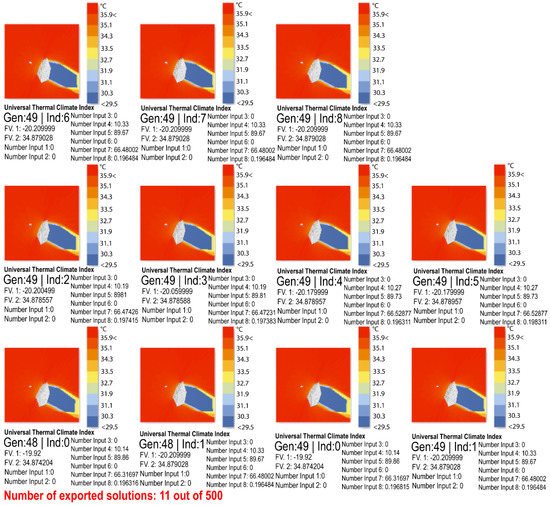
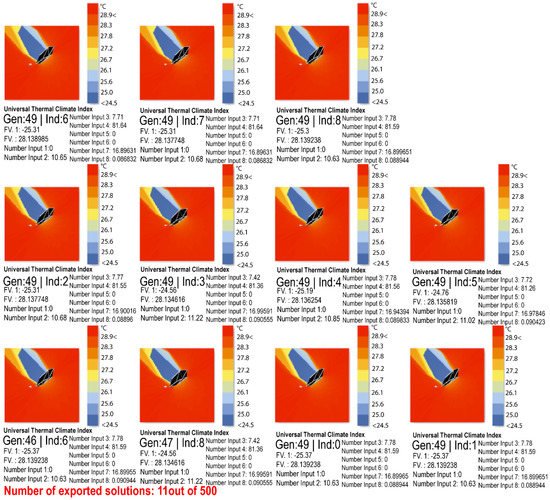
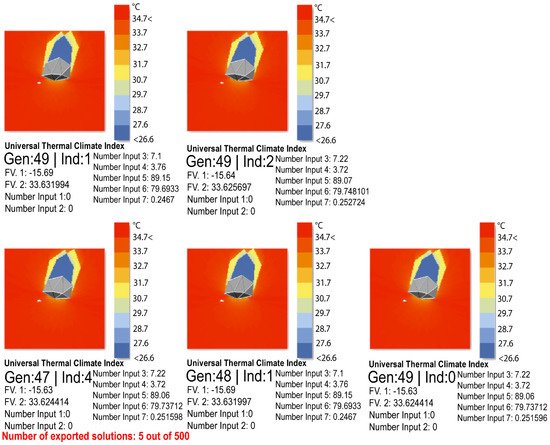
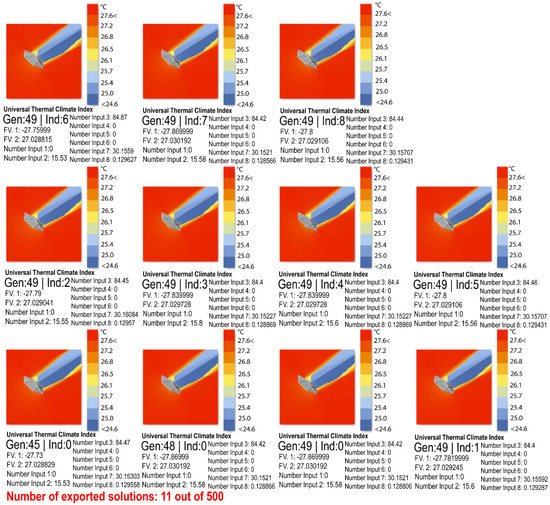
Appendix A
Figure 1 was subdivided into six parts, each containing the replicated phenotypes for the summer and winter times. Thus, the time-changing positions of the dynamic shadings can be easily observed. This appendix presents the 6 subfigures grouping the phenotypes by the daytime studied. Figure A1, Figure A2 and Figure A3 correspond to the phenotypes for the summer day at 8, 12, and 16 h, respectively. Figure A4, Figure A5 and Figure A6 correspond to the phenotypes for the winter day at 8, 12, and 16 h, respectively.
Figure A1. Pareto Front phenotypes of 21 June, 8:00 h.
Figure A2. Pareto Front phenotypes of 21 June, 12:00 h.
Figure A3. Pareto Front phenotypes of 21 June, 16:00 h.
Figure A4. Pareto Front phenotypes of 21 December, 8:00 h.
Figure A5. Pareto Front phenotypes of 21 December, 12:00 h.
Figure A6. Pareto Front phenotypes of 21 December, 16:00 h.
 +1 credit