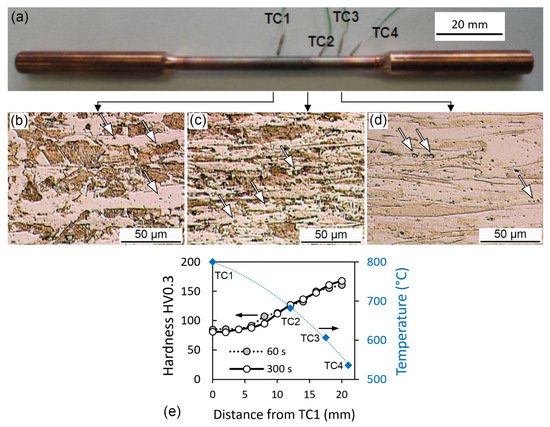
A picture of a Gleeble round tensile test specimen with thermocouples is shown in
Figure 1a. Water-cooled jaw carriers and copper grips hold the specimen in the vacuum chamber of the Gleeble 3550. The grain structure gradient (
Figure 1b–d) corresponds to the gradient of the temperature between specimen ends and the center of the gauge length (thermocouple TC1); the readout of the thermocouples is shown in
Figure 1e. It can be seen that in the middle of the specimen (TC1 position), annealing to 800 °C/60 s resulted in a partially (~50%) recrystallized microstructure with new grains about 45 μm in diameter (
Figure 1b). The recrystallized fraction at TC2 is lower (
Figure 1c), while at TC3 and TC4 the structure remains deformed (original grains approximately 175 μm in diameter are elongated along the drawing direction—
Figure 1d). Coarse Cr- and ZrCr-rich
[1] particles can also be seen inside Cu grains in
Figure 1b–d (some of them are pointed by arrows); the size of the precipitates is under the resolution limit of the light microscopy. Microhardness increases from 85 HV0.3 to 161 HV0.3 from the area heated at 800 °C for 60 s (TC1) to the area exposed to a temperature of about 540 °C (TC4). Further soaking at 800 °C for up to 300 s did not lead to a significant change in hardness (corresponding values for TC1 and TC4 are 81 HV0.3 and 168 HV0.3, respectively—
Figure 1e), nor in the grain structure. Tensile testing after heat treatment showed that the room temperature yield stress of the material is also largely impacted by the observed softening during annealing at 800°C (for details see Ref.
[1]).
2. Substructure and Precipitates
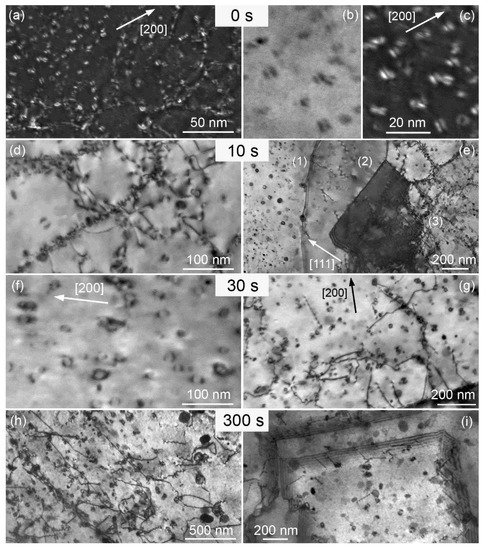
In the initial (as-delivered) hardened condition, as previously investigated in
[1], a dense distribution of tiny coherent Cr particles was found. The precipitates are evenly distributed, they appear also at subgrain and grain boundaries (the micrographs are not presented here). A general view of the dark field weak beam contrast (DFWB) is shown in
Figure 2a. From the micrographs recorded at the highest magnification (500k) available (bright field—
Figure 2b, the same area in DFWB—
Figure 2c), it can be seen that tiny Cr particles exhibit complicated, so-called coffee-bean diffraction contrast with lobes due to misfit strains, which they induce in the matrix. The diameter of the particles corresponds to the length of the zero-contrast line between the lobes, and ranges from 1 to 4 nm, the mean value being 2 nm. The average number density of these particles, estimated from three micrographs, is about 6.2 × 10
22 m
−3, and the interparticle spacing is 25 nm .
After annealing for 10 s at 800 °C, the particles have coarsened. Their shape is mostly spherical with a diameter ranging from 3 to 35 nm, the mean value being 8 nm (Figure 2d). Many of the particles are still coherent with the matrix (Figure 2d), others lost the coherency and their contrast around their circumference is regular (Figure 2e). In general, the particles remain closely spaced (average distance of 64 nm). In consequence, they pin the grain boundaries and dislocations very effectively (Figure 2e) and hinder recovery and recrystallization. Figure 2e is a very instructive micrograph showing that even after only 10 s of annealing at 800 °C, there are already recrystallization nuclei formed in the alloy. The left part of the micrograph (1) is a diffraction contrast with g = [111], no dislocation is visible in this grain although the material was deformed by drawing with an area reduction of about 70% before annealing. Therefore, this gives strong evidence for a recrystallization nucleus with a high-angle grain boundary (with a typical fringe contrast). From its bowing, it can be seen that the boundary was moving from the left to the right, and it was pinned on two coarser particles. The next grain in the middle (2) can also be taken as a recrystallization nucleus as it contains only a few dislocations, presenting a zig-zag contrast (since they are tilted to the electron beam direction). The dark grain (very close to the Bragg diffraction condition) is another recrystallization nucleus that is forming. It has a high-angle boundary with a fringe contrast on the top, left, and bottom, while on the right there is only a low-angle grain boundary—a dislocation network. Thus, this grain connects recrystallization nuclei on the left with the recovered matrix in the right part of the micrograph (3), where subgrains and isolated dislocations are pinned on fine particles.
After annealing for 30 s at 800 °C, the microstructure did not change a lot when compared to the former annealing time (10 s). The particles are spherical, 3 to 35 nm in diameter; some of them did not lose coherency, so they present a coffee-bean strain field contrast (Figure 2f), and their average distance slightly increased to 75 nm. The matrix is mostly recovered as it follows from Figure 2g, showing isolated dislocations pinned on the particles.
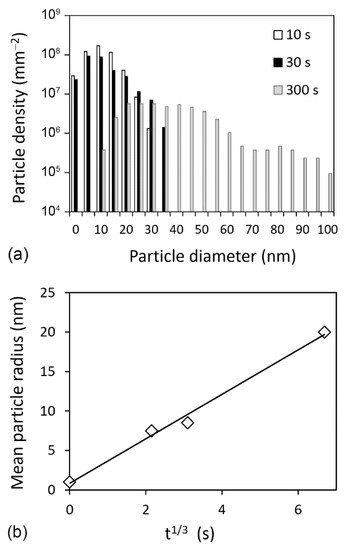
The microstructure after annealing for 300 s at 800 °C is shown in Figure 2h. The particles further coarsened, their diameter ranges from 10 to 100 nm, the mean values and average distances are 40 nm, and 163 nm, respectively (Figure 3a). Figure 2i shows annealing twins, a typical feature for Cu alloys. Their boundaries in the micrograph are tilted to the electron beam and so they present a fringe contrast.
 +1 credit