 +1 credit
| Version | Summary | Created by | Modification | Content Size | Created at | Operation |
|---|---|---|---|---|---|---|
| 1 | Escolastico Aguilera-Tejero | + 4775 word(s) | 4775 | 2020-12-31 07:51:02 | | | |
| 2 | Vivi Li | Meta information modification | 4775 | 2021-01-11 04:27:51 | | |
Video Upload Options
This study is aimed to review current knowledge about the influence of energy intake on mineral metabolism focussing on four aspects of major interest for the chronic kidney disease-metabolic bone disease (CKD-MBD) patient: (a) phosphate (P) handling, (b) fibroblast growth factor 23 (FGF23) and calcitriol synthesis and secretion, (c) metabolic bone disease, and (d) vascular calcification (VC). High caloric intake promotes P retention, while caloric restriction decreases plasma P concentrations. A direct correlation between energy intake and FGF23 has been shown in animals and humans while plasma calcitriol concentrations are inversely proportional to caloric intake. The effect of energy intake on bone is controversial. High caloric intake has been reported to increase bone mass, but the associated changes in adipokines and cytokines may as well be deleterious for bone. Low caloric intake tends to reduce bone mass but also may provide indirect beneficial effects on bone. Finally, while VC has been shown to be exacerbated by diets with high energy content, the opposite has not been demonstrated with low calorie intake. In conclusion, although prospective studies in humans are needed, when planning caloric intake for a CKD-MBD patient, it is important to take into consideration the associated changes in mineral metabolism.
1. Introduction
Caloric intake is known to influence the development and progression of renal disease. In general, diets rich in calories (due to increased fat or to increased carbohydrates) are deleterious for the kidneys. Diets with high fat content have been reported to cause renal damage in non-obese animals that did not develop type 2 diabetes, suggesting a direct effect of high fat/high calorie intake on the kidney[1]. Podocyte injury secondary to inflammasome activation[2] and down-regulation of the sirtuin type 1 (Sirt 1)–adiponectin axis[3] seem to be involved in nephrotoxicity associated with elevated caloric intake. High caloric intake is also known to alter the expression of genes related to cytoskeleton remodelling and to induce renal fibrosis[4]. In addition to promoting direct kidney damage, high caloric intake also affects renal disease indirectly (through the development of obesity and type 2 diabetes). Obesity may influence the progression of chronic kidney disease (CKD) due to its effects on renal hemodynamics that result in hyperfiltration, increased glomerular pressure, and podocyte damage[5][6]. Type 2 diabetes causes renal disease secondary to microvascular changes within the kidney and metabolic abnormalities leading to thickening of the glomerular basement membrane, expansion of the mesangial matrix, nodular glomerulosclerosis, arteriolar hyalinosis, endothelial dysfunction, and podocyte injury[7].
Conversely, caloric restriction (CR) has been shown to protect the kidneys and preserve renal function[8]. CR, defined as a reduction in daily caloric intake below the amount that would be consumed ad libitum without incurring in malnutrition, can be achieved by a variety of means including (a) reducing the total amount of food that is eaten daily, (b) changing the diet composition by decreasing energy-dense nutrients, (c) modifying eating habits with intermittent periods of fasting, or (d) by medical interventions, such as bariatric surgery[9][10]. The variety of protocols that may lead to CR makes it difficult to compare the outcomes. However, most experimental studies with animals and the few studies that have investigated the relationship between CR and mineral metabolism tend to use a reduction in the total amount of food that averages around 30% of daily intake[11]. Short-term CR decelerates renal aging by preventing increases in glomerular volume, decreasing fibrosis, and reducing senescence-associated β-galactosidase staining in aged rats[12]. Long-term CR was found to exert beneficial effects in rodents at different stages (from early onset to advanced kidney failure) of renal disease[13]. Although the exact mechanisms for the renoprotective effect of CR are not known some of the reported changes observed after CR that may be beneficial for the kidney include improving mitochondrial biogenesis and DNA repair, reducing inflammation and oxidative stress[13], increasing AMP-activated protein kinase and Sirt1, increasing autophagy, reducing molecular target of rapamycin (mTOR)[13][14][15], and lowering the soluble form of the receptor for advanced glycation end products (RAGE)[16]. CR has also been reported to ameliorate renal function resulting in decreased concentrations of serum urea nitrogen, serum creatinine, and urine protein and to increase survival rate in rodents with CKD[17].
Adjusting caloric intake in the renal patient is not straightforward, and the recommendations are related to the stage of kidney disease. CKD is commonly classified in 5 stages, according to the reduction in glomerular filtration rate (GFR): stage 1 (GFR > 90 mL/min), stage 2 (GFR = 60–89 mL/min), stage 3 (GFR = 30–59 mL/min), stage 4 (GFR = 15–29 mL/min), and stage 5 (GFR < 15 mL/min)[18]. In earlier stages (CKD stages 1 and 2), most patients (especially the obese population with type 2 diabetes) would benefit from CR. As renal deterioration progresses, patients commence losing appetite and weight. Weight loss may start early in the course of renal disease and is associated with progression of CKD and mortality[19]. Defective hypothalamic appetite regulation promotes anorexia in uremic patients[20]. Moreover, poor appetite is often aggravated by dietary restrictions that are primarily aimed at reducing phosphorus (P) and potassium intake but that negatively affect food palatability. Thus, when patients are losing weight (CKD stages 3 to 5) dietary strategies are usually shifted towards preservation of caloric intake. Nonetheless, measures to prevent a deleterious effect of high caloric intake on CKD should be installed early in the progression of the disease.
Renal disease is associated with changes in mineral metabolism, that are known collectively as chronic kidney disease/metabolic bone disease (CKD-MBD), and that include secondary hyperparathyroidism, changes in parameters of mineral metabolism, bone disorders, and extraskeletal calcification. Changes in calciotropic hormones occur early in the course of CKD. Secretion of fibroblast growth factor 23 (FGF23) and parathyroid hormone (PTH) are increased to prevent accumulation of P and hypocalcaemia. The decline in effective renal mass results in reduction in calcitriol production and therefore circulating calcitriol concentrations are low in CKD[21]. When deterioration of renal function progresses, the kidneys are not able to handle a normal P load, even with elevated FGF23 and PTH, and hyperphosphatemia ensues. Elevated concentration of extracellular P is a major factor in the development of VC[22]. In addition, changes in mineral metabolism are often accompanied by bone disease[23]. Emerging data indicate that both excessive caloric intake and reduced caloric intake may promote bone disorders[24][25][26][27], although their influence on CKD-MBD has not been sufficiently explored[28].
Accumulating evidence demonstrates an inter-relationship between energy metabolism and mineral metabolism[29][30][31]. Thus, in addition to the factors that have been classically considered as target for the control of CKD-MBD (such as calcium (Ca), P, and PTH), it may also be necessary to consider integrating adjustment of caloric intake for a more comprehensive control of mineral disorders in the CKD-MBD population.
2. Caloric Intake and P Handling
Decreased renal function results in impaired P handling leading to P retention and eventually to increased plasma P concentrations with secondary hyperparathyroidism[32]. Elevated P load, as reflected by high urinary P, is not only an outcome of poor renal function but also promotes the progression of kidney disease[33]. Thus, control of P intake is paramount in the renal patient, especially in the more advanced stages (CKD stages 4 and 5) of the disease.
P intake is related to the caloric content of food in several ways. On the one hand, high caloric intake is usually related to frequent consumption of energy-dense foods (e.g., fast food) that are typically rich in P, not only because of their intrinsic P content but also because P is widely used as a food additive. It is important to note that the inorganic P added to processed foods is more readily absorbed than the organic P naturally contained in foodstuffs[34]. Information about the actual P content of food is scant and fast food is likely to represent a hidden source of dietary P intake[35]. Additionally, a high fat content in the diet has been reported to increase P digestibility [36][37], further aggravating P load. The influence of dietary fat on intestinal P absorption seems to be secondary to the formation of Ca soaps in the intestinal lumen. Trapping of Ca in Ca soaps decreases the generation of insoluble Ca-P complexes, thus allowing more P ions to be free and able to be absorbed[36]. Diets rich in fat may also enhance paracellular transport of P by increasing intestinal permeability and they have been reported to upregulate P transporters NaPi2b and Pit1 in the small intestine[37] (Figure 1). The impact of intestinal absorption of P on serum P levels is critical at the time CKD has progressed to stages 4–5 when the kidney filtration of P is very limited and the ability to excrete P in the urine is markedly impaired despite the phosphaturic stimulus of FGF23 and PTH. Data obtained in experimental animals indicate that high caloric intake due to increased fat in the diet would contribute to P retention in individuals with reduced renal function. It has been shown that feeding high-fat diet leads to P retention when either renal function is decreased or when the P content of the diet is increased. Moreover, a tendency to increased plasma P concentration was identified both in rats with normal and decreased renal function after high-fat feeding[31].
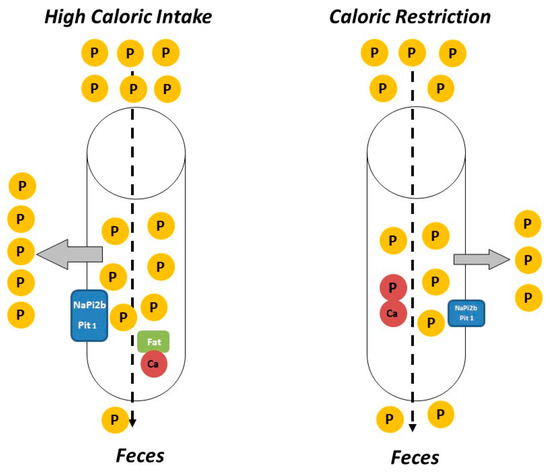
Figure 1. Caloric intake (especially fat intake) influences phosphorus (P) balance. High caloric intake (left) usually is associated with consumption of foods with higher P content than calorie-restricted foods (right). In addition, intestinal absorption of P is generally more efficient in calorie-rich/fat-rich food due to the formation of fat–calcium (Ca) soaps and to upregulation of P transporters (NaPi2b and Pit1). Thus, calorie/fat restriction tends to decrease P balance and plasma P concentrations.
The impact of CR on P homeostasis is largely unknown, although the scant available data indicate that decreasing caloric intake would help to reduce P load. Low calorie foods (e.g., vegetables) tend to have lower P content than energy-dense foods and P-containing additives are less commonly used in these types of food. Moreover, the mere fact of reducing food intake would also result in a decrease in total P intake independent of the P content of the foodstuffs. The reduction in caloric intake is also likely to further decrease intestinal P absorption (Figure 1). A recent study in non-obese rodents has shown that animals subjected to CR had lower plasma P concentrations than their non-calorie restricted counterparts even though the daily P intake was identical in both groups. Moreover, the calorie restricted animals showed a tendency to decreased P balance[11].
3. Caloric Intake, FGF23, and Calcitriol
FGF23 is a phosphaturic hormone secreted by osteocytes/osteoblasts that plays a major role in the regulation of mineral metabolism[38]. Interaction of FGF23 with its receptor, FGFR1c, and its co-receptor, α-klotho, increases phosphaturia by inducing internalization of the sodium-dependent P transporters (NaPi2a and NaPi2c)[39]. Synthesis and secretion of FGF23 is regulated mainly by dietary P and increased P balance is thought to be the main stimulus for FGF23 secretion[40]. In addition, FGF23 production is under hormonal control by calcitriol, which increases FGF23 synthesis[41]. Moreover, PTH[42], inflammation[43], and iron deficiency[44] have also been reported to influence FGF23.
Epidemiological studies have suggested that FGF23 might be regulated by calorie intake. FGF23 has been shown to be elevated in obese people[45] and increased caloric intake has been identified as a potential predictor of plasma FGF23 concentrations[46]. Experimental work has shown that feeding hypercaloric diets to rodents results in a consistent increase in plasma and bone FGF23[1][31]. In these animals, a decrease in renal α-klotho expression was also observed, and thus, it was speculated that the increase in FGF23 might be secondary to the reduction in renal α-klotho. In calorie-replete animals the decrease in α-klotho would create a state of FGF23 resistance in which more FGF23 is needed to preserve phosphaturia. Further studies in non-obese rats subjected to CR have shown a reduction in circulating concentrations of FGF23, which is accompanied by an increase in renal α-klotho[11], this α-klotho abundance would require less FGF23 to maintain P homeostasis in calorie-restricted animals. Thus, regulation of renal α-klotho by caloric intake could influence FGF23 synthesis and secretion. Studies in humans also support the role of reducing caloric intake on FGF23, e.g., a decrease in circulating FGF23 concentrations has been reported in patients subjected to bariatric surgery[47].
In addition to these in vivo studies, factors involved in energy metabolism have been reported to directly regulate FGF23 production by bone cells in vitro. Increases in both insulin and AMP-activated kinase (AMPK) have been shown to decrease FGF23 synthesis[48][49]. A recent study has demonstrated that FGF23 secretion by bone cells cultured in vitro is directly regulated by nutrient availability in the medium. Cells cultured in medium with high glucose consistently synthesized more FGF23 than cells cultured in medium with low glucose. Moreover, energy availability seemed to override the regulatory effect of P on FGF23, because cells incubated with high P concentrations only increased FGF23 expression when cultured in medium with high glucose. It is interesting to note that treatment with drugs that mimic CR (the mTOR inhibitors rapamycin and everolimus) was also able to down-regulate FGF23 expression even in the presence of high glucose in the medium[50].
Two main mechanisms seem to be implicated in the regulation of FGF23 by caloric intake: indirect mechanisms, involving regulation of renal α-klotho expression, and direct mechanisms, which affect bone cell metabolism through the mTOR pathway. In addition, other factors associated with differential energy intake, such as inflammation, may also play a role in the regulation of FGF23 by the caloric content of the diet.
FGF23 is an important metabolite in kidney patients not only for its ability to promote P excretion but also because increased levels of FGF23 have been reported as a risk factor of cardiovascular mortality[51]. Actually, the relationship between high FGF23 and mortality is not restricted to patients with kidney disease but has also been identified in the general population[52][53]. Thus, it is important to maintain FGF23 concentration within a physiologic range. On the other hand, some studies have demonstrated that, in the presence of significant renal disease, high levels of FGF23 may be necessary to control mineral metabolism and that an excessive reduction in FGF23 could be detrimental[54][55]. From a clinical perspective, given the fact that the increase in FGF23 concentrations is one of the earliest biochemical changes that can be identified in renal patients and that it precedes the increase in plasma P, the modulatory effect of the caloric content of the diet on FGF23 may be very relevant. In this context, the downregulation of FGF23 by reduced caloric intake opens a new window to control FGF23 without interfering with P balance (in fact, helping to maintain a favourable P balance, which would prevent further renal deterioration by decreasing the exposure of distal tubular cells to P).
Vitamin D is an essential micronutrient mainly involved in bone and mineral metabolism. Vitamin D is synthesized in the skin or ingested with the diet as cholecalciferol/ergocalciferol, which subsequently is metabolized in the liver to 25(OH)-cholecalciferol/ergocalciferol (calcidiol). Calcidiol is further hydroxilized in the kidney to produce 1,25(OH)2-cholecalciferol/ergocalciferol (calcitriol), which is the major active metabolite of vitamin D[56].
Calcitriol production by the kidneys decreases as a consequence of the progression of renal disease and patients with CKD typically have decreased plasma calcitriol concentrations[57][58]. Low vitamin D concentrations have been associated with cardiovascular disease[58], inflammation[59], endothelial dysfunction[60], and increased risk of bone fractures[61]. In the CKD-MBD patient, decreased vitamin D levels may have a major influence in the development of skeletal disorders (including fractures) and in long-term survival[62][63]. Thus, vitamin D replacement therapy (using calcitriol or calcitriol-analogues) is often necessary in patients with CKD-MBD, although this treatment may have significant side effects (extraskeletal calcifications)[57].
The relationship between caloric intake and vitamin D levels is not well documented and most available data relate vitamin D (usually calcidiol) with body weight. Obesity, insulin resistance, and type 2 diabetes are associated with low vitamin D levels in both humans and rodents[64][65][66][67][68]. Moreover, the bioavailability of vitamin D is decreased in obese individuals[69].
Experimental studies in rats have shown that feeding diets with high caloric concentration results in decreased plasma calcitriol even in animals that do not experience an increase in body weight[31]. When comparing rats fed high and normal fat diets with identical vitamin D content, plasma calcitriol was significantly lower in rats fed high fat[1][31]. The influence of dietary fat on intestinal absorption of vitamin D is somewhat controversial but diets with high fat content have been reported to increase vitamin D absorption by the intestine[70]; thus, decreased absorption of vitamin D is unlikely in rats fed high fat. Moreover, plasma calcidiol concentrations were not decreased in rats fed high fat diets[31]. Since calcidiol is the metabolite that best reflects nutritional status for vitamin D[71], the origin of the decreased plasma calcitriol cannot be attributed to decreased vitamin D intake.
The information relating vitamin D and CR is sparser. A recent study has identified an increase in calcidiol in obese adults subjected to ketogenic diet-induced weight loss[72]. In animal studies, plasma calcitriol concentrations have also been reported to increase in non-obese rats subjected to CR[50].
In summary, epidemiological data demonstrate an inverse relationship between vitamin D status (as assessed by circulating calcidiol concentrations) and body weight/glycaemic control. Although plasma calcidiol has been shown to accurately reflect vitamin D intake/skin synthesis, in the renal patient what is critical is the decrease in calcitriol production by the kidney. As discussed above, experimental studies in rats have shown that high-fat diets decrease calcitriol concentrations while CR increases calcitriol concentrations[31][50].
The most likely explanation for the regulation of calcitriol after modifying caloric intake is related to changes in FGF23. FGF23 down-regulates calcitriol production by the kidney through the inhibition of the enzyme that converts calcidiol to calcitriol: Cytochrome P450 Family 27 Subfamily B Member 1 (Cyp27b1), and by stimulation of the enzyme 24-hydroxylase: Cytochrome P450 Family 24 Subfamily a Member 1 (Cyp24a1) that catabolizes calcitriol[73]. Thus, the elevated FGF23 concentrations found after feeding high calories would down-regulate Cyp27b1 and upregulate Cyp24a1 to decrease calcitriol, while the reduced FGF23 observed after caloric restriction would upregulate Cyp27b1 and down-regulate Cyp24a1 to increase calcitriol.
4. Caloric Intake and Metabolic Bone Disease (MBD)
Bone abnormalities are frequent in patients with CKD and represent an important contributor to decreased quality of life because of the risk of fractures and reduced mobility[74]. Renal patients have fragile bones as a consequence of decreased bone mineral content and abnormal bone architecture. MBD encompasses alterations in bone structure characterized by abnormalities in the rate of turnover, mineralization, and bone volume[75]. Uremic toxins influence bone quality in CKD patients[76], and MBD is a more complex entity than classic osteoporosis[77]. Evidence suggests that patients with CKD have an elevated risk of bone fractures, especially in end-stage renal disease because of the high incidence of MBD[78]. The altered mechanical properties of uremic bone have been demonstrated in animal models with experimental CKD, in which elasticity of femoral bones evidenced an inverse correlation with kidney function[79]. In humans, the Kidney Disease: Improving Global Outcomes (KDIGO) guidelines encourage monitoring bone mass in the CKD patient[74], and adjusting caloric intake may help to prevent bone loss.
Caloric intake has a profound influence on bone parameters. In general, high caloric intake results in increased bone mass, while low caloric intake decreases bone mass. The effect of caloric intake on bone is in part indirect and related to changes in body weight. The relationship between obesity and bone metabolism is complex and has not yet been fully elucidated. Obesity was traditionally thought to have protective effects on the skeleton. However, this assertion has recently been challenged with studies demonstrating that obesity is associated with a lower risk of certain fractures (e.g., ankle) but with a higher risk of suffering other fractures (e.g., wrist)[80][81][82]. Increased bone mineral density (BMD) in obesity is related to the combination of a higher mechanical load and hormonal activity. However, there are other genetic and environmental factors that can also influence bone mass in obese patients, such as tobacco consumption, eating habits, and physical activity[26]. Although in older populations, it seems that obesity protects bone, it is not entirely clear whether excessive fat accumulation has beneficial or detrimental effects on bone health[73]. In fact, some evidence points out that obesity may be harmful to bone[26] due to a combination of factors, including an increase in bone marrow adipogenesis at the expense of osteoblastogenesis and adipokine (leptin and adiponectin) dysregulation[83]. In addition, increased body fat has been associated with the secretion of proinflammatory cytokines (TNF-α, IL-6, C-reactive protein) that may affect bone remodelling and could be detrimental for bone health[27][83][84][85]. Data from experimental animal models also demonstrate negative effects of high-fat diets on bone metabolism [27]. Mice fed with a high-fat diet had decreased trabecular bone volume and cortical bone growth[86]. High-fat diet also reduces BMD and promotes infiltration of adipocytes in the bone marrow[87]. In addition, cholesterol and its metabolites, which are usually elevated after high fat intake, are known to have effects on bone homeostasis through regulating differentiation and activation of osteoblasts and osteoclasts[88]. Thus, hypercholesterolemia may reduce bone mineral content (BMC) and trabecular structural parameters[89][90]. A recent study conducted in male Wistar rats fed with high-carbohydrate, high-fat diet to induce metabolic syndrome showed a deterioration in trabecular bone structure evidenced by a significant decrease in osteoblast and osteoid surfaces, osteoid volume, and significantly increased eroded surface. However, no changes in whole body BMC and BMD were found[91]. Other studies have reported both an increase[92] and a reduction[93] in BMC and BMD in rats fed with diets that induce metabolic syndrome. It has been proposed that differences in dietary fatty acids might reflect different effects on bone tissue[91]. Epidemiological studies in humans show inconclusive results on the relationship between metabolic syndrome and bone health status[94].
Weight loss induced by CR is associated with lower BMD[95][96] but does not seem to result in decreased bone quality assessed by trabecular bone microarchitecture and the surface-to-curve-ratio[97]. In fact, it has been suggested that the reduction in bone mass after CR may not be detrimental because the reduced bone mass is commensurate to reduced body weight[98]. Weight loss in obese and overweight patients was associated with a significant decrease in volumetric BMD, cortical thickness, and estimated strength[99]. An observational study involving 1723 older men reported that weight loss was associated with lower peripheral bone strength and total BMD[100]. Perhaps, the key to this controversy is whether weight loss is achieved only through CR or is also accompanied by physical exercise. A recent study has demonstrated that, while CR was detrimental to bone structure, when CR was combined with exercise it was effective in decreasing adiposity and mitigating bone structural deterioration associated with weight reduction in obese rats[101]. On the other hand, CR has been shown to have important effects on inflammation, insulin resistance, and cardiovascular disease, all known risk factors for osteoporosis and fractures[102][103][104][105] (Figure 2).
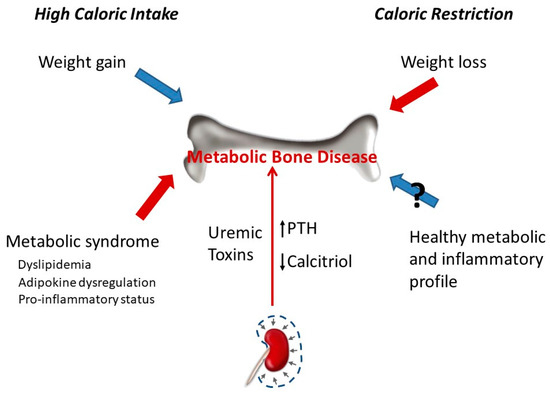
Figure 2. Chronic kidney disease leads to metabolic bone disease due to direct action of uremic toxins on bone and to associated changes in mineral metabolism (e.g., decreased calcitriol, increased parathyroid hormone (PTH)). The effect of calorie intake on bone can be differentiated in two types of mechanisms: mechanical stress associated with body weight and metabolic/inflammatory changes. The gain in body weight secondary to high calorie intake promotes bone anabolism due to increased mechanical load, and the opposite happens when body weight is lost after calorie restriction. However, the metabolic and inflammatory changes associated with high calorie intake are deleterious for bone, while the healthier metabolic and inflammatory profile observed after calorie restriction may (?) help to preserve bone mass.
Most studies on the influence of the caloric content of the diet on bone have been carried out in individuals with normal renal function. Thus, there is a need for more data on the effects of CR on the development and progression of CKD-MBD and its relationship with bone status. As previously mentioned, decreased BMD with increased osteoporosis and fracture risk may be complications of CR. In addition, in CKD patients, there is also an increased risk for osteoporosis and fracture risk associated with MBD. Bearing in mind that bone pathophysiology in CKD patients is quite different from healthy individuals, until specific studies are conducted to clarify the impact of CR on bone health in the scenario of CKD, CR should be considered with caution in CKD patients[8]. Moreover, when planning CR in a CKD patient, mostly in the earlier CKD stages, it would be necessary to assess bone status and to follow up the progression of bone parameters (e.g., BMD) in order to adjust caloric intake based on their evolution.
5. Caloric Intake and VC
VC refers to mineral deposition in the vascular system, in the form of Ca-P complexes[106]. Although VC is part of the normal aging process, some diseases such as diabetes, hypertension, and CKD can accelerate this process[106][107][108]. Vascular and other soft-tissue calcifications are a major problem in end-stage CKD. In CKD patients, medial artery calcification is the most prevalent form of VC and is associated with increased stiffness of the artery wall[109]. VC is one of the major contributors to cardiovascular mortality in these patients[106][108].
Different studies suggest that VC, as well as bone remodelling, is regulated by inductive and inhibitory processes. During pathological conditions, the balance between pro-calcification and anti-calcification mediators in the arteries is upset and leads to ectopic mineralization[99]. Hyperphosphatemia, due to the inability to eliminate P in uremic patients, promotes VC through several mechanisms, including increased serum CaxP product, and phenotypic transdifferentiation of vascular smooth muscle cells to osteochondrogenic cells[109].
Obesity and the caloric content of the diet influence uremic VC[68][110]. In experimental models of uraemia, obese Zucker rats have been shown to develop more severe VC than lean Zucker rats. Although the mechanisms are likely to be multifactorial, oxidative stress seems to play a major role in the enhancement of VC by obesity[68]. Feeding high-calorie diets has also been shown to promote VC in non-obese uremic rats both by influencing P retention, secondary to renal α-klotho and FGF23 dysregulation, and by promoting chronic inflammation and oxidative stress[31][111].
CR has been reported to improve cardiovascular health and retard vascular aging. CR attenuates the production of reactive oxygen species (ROS) and age-related increases in oxidative stress[107]. CR in young rats also prevented age-related pro-inflammatory changes in the arterial wall and preserved a more youthful aortic wall phenotype[112]. However, a recent study has failed to demonstrate a beneficial effect of CR on uremic VC. Although CR resulted in metabolic changes that could theoretically be useful to protect against VC (decrease in serum concentrations of P, glucose, lipids, leptin, etc.), it did not prevent or ameliorate VC in uremic rats[11]. Interestingly, in this study, CR resulted in increased mortality in uremic rats and an excellent direct correlation was found between body weight and survival. In these experiments, the rats subjected to CR were not obese and their reduction in body weight may have made them more vulnerable to CKD. Obesity is a risk factor to develop de novo CKD but improves survival in patients with advanced CKD, in which mortality is inversely proportional to body weight and body mass index. This is known as the obesity paradox[113]. Moreover, weight loss is associated with a poor outcome in CKD patients, so the decrease in energy stores could explain the higher mortality found in this experiment[11][19].
6. Conclusions
Caloric intake has a significant impact on mineral metabolism and adjusting energy intake may help in the management of CKD-MBD. High caloric intake promotes P retention, while low caloric intake tends to decrease P balance. Moreover, current knowledge indicates that even for a fixed P intake, CR would help to decrease P load. Reduction in caloric intake may also aid in the control of FGF23 and calcitriol concentrations in CKD-MBD patients: high caloric intake increases FGF23 and decreases calcitriol, while the opposite changes are observed with low caloric intake. Scientific evidence about the effect of caloric intake on bone in the context of CKD-MBD is insufficient to draw definitive conclusions. However, from the available data, it would seem reasonable to be careful with CR because it could have a negative impact on the skeleton. Finally, while energy-rich diets have been shown to promote VC, there is no scientific proof demonstrating a beneficial effect of CR on soft-tissue mineralization. In conclusion, (a) when planning caloric intake for a renal patient, it is important to take into consideration the associated changes in mineral metabolism, (b) reducing calorie intake could be an additional strategy for controlling mineral disorders in CKD patients, especially in the earlier stages when weight loss/malnutrition are not yet a problem.
References
- Rios, R.; Pineda, C.; Lopez, I.; Muñoz-Castañeda, J.; Rodriguez, M.; Aguilera-Tejero, E.; Raya, A.I. Phosphorus restriction does not prevent the increase in fibroblast growth factor 23 elicited by high fat diet. PLoS ONE 2018, 13, e0198481, doi:10.1371/journal.pone.0198481.
- Boini, K.M.; Xia, M.; Abais, J.M.; Li, G.; Pitzer, A.L.; Gehr, T.W.; Zhang, Y.; Li, P.L. Activation of inflammasomes in podocyte injury of mice on the high fat diet: Effects of ASC gene deletion and silencing. Biochim. Biophys. Acta 2014, 1843, 836–845, doi:10.1016/j.bbamcr.2014.01.033.
- Wickman, C.; Kramer, H. Obesity and kidney disease. Potential mechanisms. Semin. Nephrol. 2013, 33, 14–22, doi:10.1016/j.semnephrol.2012.12.006.
- Gai, Z.; Hiller, C.; Chin, S.H.; Hofstetter, L.; Stieger, B.; Konrad, D.; Kullak-Ublick, G.A. Uninephrectomy augments the effects of high fat diet induced obesity on gene expression in mouse kidney. Biochem. Biophys. Acta 2014, 1842, 1870–1878, doi:10.1016/j.bbadis.2014.07.001.
- Chagnac, A.; Weinstein, T.; Korzets, A.; Ramadan, E.; Hirsch, J.; Gafter, U. Glomerular hemodynamics in severe obesity. Am. J. Physiol. Ren. Physiol. 2000, 278, F817–F822, doi:10.1152/ajprenal.2000.278.5.F817.
- Chen, H.M.; Liu, Z.H.; Zeng, C.H.; Li, S.J.; Wang, Q.W.; Li, L.S. Podocyte lesions in patients with obesity-related glomerulopathy. Am. J. Kidney Dis. 2006, 48, 772–779, doi:10.1053/j.ajkd.2006.07.025.
- Anders, H.J.; Huber, T.B.; Isermann, B.; Schiffer, M. CKD in diabetes: Diabetic kidney disease versus nondiabetic kidney disease. Nat. Rev. Nephrol. 2018, 14, 361–377, doi:10.1038/s41581-018-0001-y.
- Afsar, B.; Afsar, R.E.; Copur, S.; Sag, A.A.; Ortiz, A.; Kanbay, M. The effect of caloric restriction on development and progression of chronic kidney disease: Review of the current evidence. Br. J. Nutr. 2020, 14, 1–42. doi:10.1017/S000711452000358X.
- Pugh, T.D.; Klopp, R.G.; Weindruch, R. Controlling caloric consumption: Protocols for rodents and rhesus monkeys. Neurobiol. Aging 1999, 20, 157–165, doi:10.1016/s0197-4580(99)00043-3.
- Koshy, A.A.; Bobe, A.M.; Brady, M.J. Potential mechanisms by which bariatric surgery improves systemic metabolism. Transl. Res. 2013, 61, 63–72, doi:10.1016/j.trsl.2012.09.004.
- Vidal, A.; Rios, R.; Pineda, C.; Lopez, I.; Rodriguez, M.; Aguilera-Tejero, E.; Raya, A.I. Effect of caloric restriction on phosphate metabolism and uremic vascular calcification. Am. J. Physiol. Ren. Physiol. 2020, 318, F1188–F1198, doi:10.1152/ajprenal.00009.2020.
- Ning, Y.C.; Cai, G.Y.; Zhuo, L.; Gao, J.J.; Dong, D.; Cui, S.; Feng, Z.; Shi, S.Z.; Bai, X.Y.; Sun, XF.; et al. Short-term calorie restriction protects against renal senescence of aged rats by increasing autophagic activity and reducing oxidative damage. Mech. Ageing Dev. 2013, 134, 570–579, doi:10.1016/j.mad.2013.11.006.
- Singh, G.; Krishan, P. Dietary restriction regimens for fighting kidney disease: Insights from rodent studies. Exp. Gerontol. 2019, 128, 110738, doi:10.1016/j.exger.2019.110738.
- Wang, S.Y.; Cai, G.Y.; Chen, X.M. Energy restriction in renal protection. Br. J. Nutr. 2018, 120, 1149–1158, doi:10.1017/S0007114518002684.
- Madeo, F.; Carmona-Gutierrez, D.; Hofer, S.J.; Kroemer, G. Caloric restriction mimetics against age-associated disease: Targets, mechanisms, and therapeutic potential. Cell Metab. 2019, 29, 592–610, doi:10.1016/j.cmet.2019.01.018.
- Malin, S.K.; Navaneethan, S.D.; Fealy, C.E.; Scelsi, A.; Huang, H.; Rocco, M.; Kirwan, J.P. Exercise plus caloric restriction lowers soluble RAGE in adults with chronic kidney disease. Obes. Sci. Pract. 2020, 6, 307–312, doi:10.1002/osp4.408.
- Xu, X.M.; Cai, G.Y.; Bu, R.; Wang, W.J.; Bai, X.Y.; Sun, X.F.; Chen, X.M. Beneficial effects of caloric restriction on chronic kidney disease in rodent models: A meta-analysis and systematic review. PLoS ONE 2015, 10, e0144442, doi:10.1371/journal.pone.0144442.
- Kidney Disease: Improving Global Outcomes (KDIGO) CKD-MBD Update Work Group. KDIGO 2017 Clinical Practice Guideline Update for the Diagnosis, Evaluation, Prevention, and Treatment of Chronic Kidney Disease-Mineral and Bone Disorder (CKD-MBD). Kidney Int. Suppl. 2017, 7, 1–59, doi:10.1016/j.kisu.2017.04.001.
- Ku, E.; Kopple, J.D.; Johansen, K.L.; McCulloch, C.E.; Go, A.S.; Xie, D.; Lin, F.; Hamm, L.L.; He, J.; Kusek, J.W.; et al. Longitudinal weight change during CKD progression and its association with subsequent mortality. Am. J. Kidney Dis. 2018, 71, 657–665, doi:10.1053/j.ajkd.2017.09.015.
- Cheung, W.; Yu, P.X.; Little, B.M.; Cone, R.D.; Marks, D.L.; Mak, R.H. Role of leptin and melanocortin signaling in uremia-associated cachexia. J. Clin. Investig. 2005, 115, 1659–1665, doi:10.1172/JCI22521.
- Rodríguez, M.; López, I.; Muñoz, J.; Aguilera-Tejero, E.; Almaden, Y. FGF23 and mineral metabolism, implications in CKD-MBD. Nefrologia 2012, 32, 275–278, doi:10.3265/Nefrologia.pre2012.Mar.11415.
- Villa-Bellosta, R.; Millan, A.; Sorribas, V. Role of calcium-phosphate deposition in vascular smooth muscle cell calcification. Am. J. Physiol. Cell Physiol. 2011, 300, C210–C220, doi:10.1152/ajpcell.00229.2010.
- Ketteler, M.; Block, G.A.; Evenepoel, P.; Fukagawa, M.; Herzog, C.A.; McCann, L.; Moe, S.M.; Shroff, R.; Tonelli, M.A.; Toussaint, N.D.; et al. Executive summary of the 2017 KDIGO Chronic Kidney Disease-Mineral and Bone Disorder (CKD-MBD) Guideline Update: What’s changed and why it matters. Kidney Int. 2017, 92, 26–36, doi:10.1016/j.kint.2017.10.001.
- Cao, J.J.; Gregoire, B.R.; Gao, H. High-fat diet decreases cancellous bone mass but has no effect on cortical bone mass in the tibia in mice. Bone 2009, 44, 1097–1104, doi:10.1016/j.bone.2009.02.017.
- Ionova-Martin, S.S.; Do, S.H.; Barth, H.D.; Szadkowska, M.; Porter, A.E.; Ager, J.W., 3rd; Ager, J.W., Jr.; Alliston, T.; Vaisse, C.; Ritchie, R.O. Reduced size-independent mechanical properties of cortical bone in high-fat diet-induced obesity. Bone 2010, 46, 217–225, doi:10.1016/j.bone.2009.10.015.
- Shapses, S.A.; Sukumar, D. Bone metabolism in obesity and weight loss. Annu. Rev. Nutr. 2012, 32, 287–309, doi:10.1146/annurev.nutr.012809.104655.
- Savvidis, C.; Tournis, S.; Dede, A.D. Obesity and bone metabolism. Hormones 2018, 17, 205–217, doi:10.1007/s42000-018-0018-4.
- Da Silva Martins, J.; Castro, J.H.; Sainz Rueda, N.A.; Dos Reis, L.M.; Jorgetti, V.; Affonso Moysés, R.M.; Caramori, J.T. Renal osteodystrophy in the obesity era: Is metabolic syndrome relevant? PLoS ONE 2017, 12, e0180387, doi:10.1371/journal.pone.0180387.
- Cheng, S.P.; Doherty, G.M.; Chang, Y.C.; Liu, C.L. Leptin: The link between overweight and primary hyperparathyroidism? Med. Hypotheses 2011, 76, 94–96, doi:10.1016/j.mehy.2010.08.039.
- Migliaccio, S.; Greco, E.A.; Fornari, R.; Donini, L.M.; Lenzi, A. Is obesity in women protective against osteoporosis? Diabetes Metab. Syndr. Obes. 2011, 4, 273–282, doi:10.2147/DMSO.S11920.
- Raya, A.I.; Rios, R.; Pineda, C.; Rodriguez-Ortiz, M.E.; Diez, E.; Almaden, Y.; Muñoz-Castañeda, J.; Rodriguez, M.; Aguilera-Tejero, E.; Lopez, I. Energy-dense diets increase FGF23, lead to phosphorus retention and promote vascular calcifications in rats. Sci. Rep. 2016, 6, 1–9, doi:10.1038/srep36881.
- Rodríguez-Ortiz, M.E.; Rodríguez, M. Recent advances in understanding and managing secondary hyperparathyroidism in chronic kidney disease. F1000Research 2020, 9, doi:10.12688/f1000research.22636.1.
- Santamaría, R.; Díaz-Tocados, J.M.; Pendón-Ruiz de Mier, M.V.; Robles, A.; Salmerón-Rodríguez, M.D.; Ruiz, E.; Vergara, N.; Aguilera-Tejero, E.; Raya, A.; Ortega, R.; et al. Increased Phosphaturia Accelerates The Decline in Renal Function: A Search for Mechanisms. Sci Rep. 2018, 8, 1–14, doi:10.1038/s41598-018-32065-2.
- Sarathy, S.; Sullivan, C.; Leon, J.B.; Sehgal, A.R. Fast food, phosphorus-containing additives, and the renal diet. J. Ren. Nutr. 2008, 18, 466–470, doi:10.1053/j.jrn.2008.05.007.
- Uribarri, J.; Calvo, M.S. Hidden sources of phosphorus in the typical American diet: Does it matter in nephrology? Semin. Dial. 2003, 16, 186–188, doi:10.1046/j.1525-139x.2003.16037.x.
- Frommelt, L.; Bielohuby, M.; Stoehr, B.J.; Menhofer, D.; Bidlingmaier, M.; Kienzle, E. Effects of low-carbohydrate, high-fat diets on apparent digestibility of minerals and trace elements in rats. Nutrition 2014, 30, 869–875, doi:10.1016/j.nut.2013.11.017.
- Kawamoto, K.; Sakuma, M.; Tanaka, S.; Masuda, M.; Nakao-Muraoka, M.; Niida, Y.; Nakamatsu, Y.; Ito, M.; Taketani, Y.; Arai, H. High-fat diets provoke phosphorus absorption from the small intestine in rats. Nutrition 2020, 72, 110694, doi:10.1016/j.nut.2019.110694.
- Vervloet, M. Renal and extrarenal effects of fibroblast growth factor 23. Nat. Rev. Nephrol. 2019, 15, 109–120, doi:10.1038/s41581-018-0087-2.
- Shimada, T.; Hasegawa, H.; Yamazaki, Y.; Muto, T.; Hino, R.; Takeuchi, Y.; Fujita, T.; Nakahara, K.; Fukumoto, S.; Yamashita, T. FGF-23 is a potent regulator of vitamin D metabolism and phosphate homeostasis. J. Bone Miner. Res. 2004, 19, 429–435, doi:10.1359/JBMR.0301264.
- Ferrari, S.L.; Bonjour, J.P.; Rizzoli, R. Fibroblast growth factor-23 relationship to dietary phosphate and renal phosphate handling in healthy young men. J. Clin. Endocrinol. Metab. 2005, 90, 1519–1524, doi:10.1210/jc.2004-1039.
- Masuyama, R.; Stockmans, I.; Torrekens, S.; Van Looveren, R.; Maes, C.; Carmeliet, P.; Bouillon, R.; Carmeliet, G. Vitamin D receptor in chondrocytes promotes osteoclastogenesis and regulates FGF23 production in osteoblasts. J. Clin. Investig. 2006, 116, 3150–3159, doi:10.1172/JCI29463.
- López, I.; Rodríguez-Ortiz, M.E.; Almadén, Y.; Guerrero, F.; de Oca, A.M.; Pineda, C.; Shalhoub, V.; Rodríguez, M.; Aguilera-Tejero, E. Direct and indirect effects of parathyroid hormone on circulating levels of fibroblast growth factor 23 in vivo. Kidney Int. 2011, 80, 475–482, doi:10.1038/ki.2011.107.
- David, V.; Martin, A.; Isakova, T.; Spaulding, C.; Qi, L.; Ramirez, V.; Zumbrennen-Bullough, K.B.; Sun, C.C.; Lin, H.Y.; Babitt, J.L.; et al. Inflammation and functional iron deficiency regulate fibroblast growth factor 23 production. Kidney Int. 2016, 89, 135–146, doi:10.1038/ki.2015.290.
- Bożentowicz-Wikarek, M.; Kocełak, P.; Owczarek, A.; Olszanecka-Glinianowicz, M.; Mossakowska, M.; Skalska, A.; Więcek, A.; Chudek, J. Plasma fibroblast growth factor 23 concentration and iron status. Does the relationship exist in the elderly population? Clin. Biochem. 2015, 48, 431–436, doi:10.1016/j.clinbiochem.2014.12.027.
- Marsell, R.; Mirza, MA.; Mallmin, H.; Karlsson, M.; Mellström, D.; Orwoll, E.; Ohlsson, C.; Jonsson, K.B.; Ljunggren, O.; Larsson, T.E. Relation between fibroblast growth factor-23, body weight and bone mineral density in elderly men. Osteoporos. Int. 2009, 20, 1167–1173, doi:10.1007/s00198-008-0780-2.
- di Giuseppe, R.; Kühn, T.; Hirche, F.; Buijsse, B.; Dierkes, J.; Fritsche, A.; Kaaks, R.; Boeing, H.; Stangl, G.I.; Weikert, C. Potential Predictors of Plasma Fibroblast Growth Factor 23 Concentrations: Cross-Sectional Analysis in the EPIC-Germany Study. PLoS ONE 2015 10, e0133580, doi:10.1371/journal.pone.0133580.
- Billington, E.O.; Murphy, R.; Gamble, G.D.; Callon, K.; Davies, N.; Plank, L.D.; Booth, M.; Reid, I.R. Fibroblast growth factor 23 levels decline following sleeve gastrectomy. Clin. Endocrinol. 2019, 91, 87–93, doi:10.1111/cen.13981.
- Bär, L.; Feger, M.; Fajol, A.; Klotz, L.O.; Zeng, S.; Lang, F.; Hocher, B.; Föller, M. Insulin suppresses the production of fibroblast growth factor 23 (FGF23). Proc. Natl. Acad. Sci. USA 2018, 115, 5804–5809, doi:10.1073/pnas.1800160115.
- Glosse, P.; Feger, M.; Mutig, K.; Chen, H.; Hirche, F.; Hasan, A.A.; Gaballa, M.M.S.; Hocher, B.; Lang, F.; Föller, M. AMP-activated kinase is a regulator of fibroblast growth factor 23 production. Kidney Int. 2018, 94, 491–501, doi:10.1016/j.kint.2018.03.006.
- Vidal, A.; Rios, R.; Pineda, C.; Lopez, I.; Muñoz-Castañeda, J.R.; Rodriguez, M.; Aguilera-Tejero, E.; Raya, A.I. Direct regulation of fibroblast growth factor 23 by energy intake through mTOR. Sci. Rep. 2020, 10, 1–10, doi:10.1038/s41598-020-58663-7.
- Scialla, J.J.; Xie, H.; Rahman, M.; Anderson, A.H.; Isakova, T.; Ojo, A.; Zhang, X.; Nessel, L.; Hamano, T.; Grunwald, J.E.; et al. Fibroblast growth factor-23 and cardiovascular events in CKD. J. Am. Soc. Nephrol. 2014, 25, 349–360, doi:10.1681/ASN.2013050465.
- Kestenbaum, B.; Sachs, M.C.; Hoofnagle, A.N.; Siscovick, D.S.; Ix, J.H.; Robinson-Cohen, C.; Lima, J.A.; Polak, J.F.; Blondon, M.; Ruzinski, J.; et al. Fibroblast growth factor-23 and cardiovascular disease in the general population: The Multi-Ethnic Study of Atherosclerosis. Circ. Heart Fail. 2014, 7, 409–417, doi:10.1161/CIRCHEARTFAILURE.113.000952.
- Panwar, B.; Jenny, N.S.; Howard, V.J.; Wadley, V.G.; Muntner, P.; Kissela, B.M.; Judd, S.E.; Gutiérrez, O.M. Fibroblast growth factor 23 and risk of incident stroke in community-living adults. Stroke 2015, 46, 322–328, doi:10.1161/STROKEAHA.114.007489.
- Shalhoub, V.; Shatzen, E.M.; Ward, S.C.; Davis, J.; Stevens, J.; Bi, V.; Renshaw, L.; Hawkins, N.; Wang, W.; et al. FGF23 neutralization improves chronic kidney disease-associated hyperparathyroidism yet increases mortality. J. Clin. Investig. 2012, 122, 2543–2553, doi:10.1172/JCI61405.
- Clinkenbeard, E.L.; Noonan, M.L.; Thomas, J.C.; Ni, P.; Hum, J.M.; Aref, M.; Swallow, E.A.; Moe, S.M.; Allen, M.R.; White, K.E. Increased FGF23 protects against detrimental cardio-renal consequences during elevated blood phosphate in CKD. JCI Insight 2019, 4, e123817, doi:10.1172/jci.insight.123817.
- Zhang, R.; Naughton, D.P. Vitamin D in health and disease: Current perspectives. Nutr. J. 2010, 9, 65, doi:10.1186/1475-2891-9-65.
- Jean, G.; Souberbielle, J.C.; Chazot, C. Vitamin D in Chronic Kidney Disease and Dialysis Patients. Nutrients 2017, 9, 328, doi:10.3390/nu9040328.
- Kaur, G.; Singh, J.; Kumar, J. Vitamin D and cardiovascular disease in chronic kidney disease. Pediatr. Nephrol. 2019, 34, 2509–2522, doi:10.1007/s00467-018-4088-y.
- Mansouri, L.; Lundwall, K.; Moshfegh, A.; Jacobson, S.H.; Lundahl, J.; Spaak, J. Vitamin D receptor activation reduces inflammatory cytokines and plasma MicroRNAs in moderate chronic kidney disease—A randomized trial. BMC Nephrol. 2017, 18, 1–7, doi:10.1186/s12882-017-0576-8.
- Vila Cuenca, M.; Ferrantelli, E.; Meinster, E.; Pouw, S.M.; Kovačević, I.; de Menezes, R.X.; Niessen, H.W.; Beelen, R.H.J.; Hordijk, P.L.; Vervloet, M.G. Vitamin D attenuates endothelial dysfunction in uremic rats and maintains human endothelial stability. J. Am. Heart Assoc. 2018, 7, e008776, doi:10.1161/JAHA.118.008776.
- van Schoor, N.M.; Visser, M.; Pluijm, S.M.; Kuchuk, N.; Smit, J.H.; Lips, P. Vitamin D deficiency as a risk factor for osteoporotic fractures. Bone 2008, 42, 260–266, doi:10.1016/j.bone.2007.11.002.
- Ambrus, C.; Almasi, C.; Berta, K.; Deak, G.; Marton, A.; Molnar, M.Z.; Nemeth, Z.; Horvath, C.; Lakatos, P.; Szathmari, M.; et al. Vitamin D insufficiency and bone fractures in patients on maintenance hemodialysis. Int. Urol. Nephrol. 2011, 43, 475–482, doi:10.1007/s11255-010-9723-x.
- Molina, P.; Carrero, J.J.; Bover, J.; Chauveau, P.; Mazzaferro, S.; Torres, P.U.; European Renal Nutrition (ERN) and Chronic Kidney Disease-Mineral and Bone Disorder (CKD-MBD) Working Groups of the European Renal Association-European Dialysis Transplant Association (ERA-EDTA). Vitamin D, a modulator of musculoskeletal health in chronic kidney disease. J. Cachexia Sarcopenia Muscle 2017, 8, 686–701, doi:10.1002/jcsm.12218.
- Forouhi, N.G.; Luan, J.; Cooper, A.; Boucher, B.J.; Wareham, N.J. Baseline serum 25-hydroxy vitamin D is predictive of future glycemic status and insulin resistance: The Medical Research Council Ely Prospective Study 1990–2000. Diabetes 2008, 57, 2619–2625, doi:10.2337/db08-0593.
- Kayaniyil, S.; Vieth, R.; Retnakaran, R.; Knight, J.A.; Qi, Y.; Gerstein, H.C.; Perkins, B.A.; Harris, S.B.; Zinman, B.; Hanley, A.J. Association of vitamin D with insulin resistance and beta-cell dysfunction in subjects at risk for type 2 diabetes. Diabetes Care 2010, 33, 1379–1381, doi:10.2337/dc09-2321.
- Kabadi, S.M.; Lee, B.K.; Liu, L. Joint effects of obesity and vitamin D insufficiency on insulin resistance and type 2 diabetes: Results from the NHANES 2001-2006. Diabetes Care 2012, 35, 2048–2054, doi:10.2337/dc12-0235.
- Vimaleswaran, K.S.; Berry, D.J.; Lu, C.; Tikkanen, E.; Pilz, S.; Hiraki, L.T.; Cooper, J.D.; Dastani, Z.; Li, R.; Houston, D.K.; et al. Causal relationship between obesity and vitamin D status: Bi-directional Mendelian randomization analysis of multiple cohorts. PLoS Med. 2013, 10, e1001383, doi:10.1371/journal.pmed.1001383.
- Peralta-Ramírez, A.; Montes de Oca, A.; Raya, A.I.; Pineda, C.; López, I.; Guerrero, F.; Diez, E.; Muñoz-Castañeda, J.R.; Martinez, J.; Almaden, Y.; et al. Vitamin E protection of obesity-enhanced vascular calcification in uremic rats. Am. J. Physiol. Ren. Physiol. 2014, 306, F422–F429, doi:10.1152/ajprenal.00355.2013.
- Wortsman, J.; Matsuoka, L.Y.; Chen, T.C.; Lu, Z.; Holick, M.F. Decreased bioavailability of vitamin D in obesity. Am. J. Clin. Nutr. 2000, 72, 690–693, doi:10.1093/ajcn/72.3.690.
- Dawson-Hughes, B.; Harris, S.S.; Lichtenstein, A.H.; Dolnikowski, G.; Palermo, N.J.; Rasmussen, H. Dietary fat increases vitamin D-3 absorption. J. Acad. Nutr. Diet. 2015, 115, 225–230, doi:10.1016/j.jand.2014.09.014.
- Holick, M.F. Vitamin D deficiency. N. Engl. J. Med. 2007, 357, 266–281, doi:10.1056/NEJMra070553.
- Perticone, M.; Maio, R.; Sciacqua, A.; Suraci, E.; Pinto, A.; Pujia, R.; Zito, R.; Gigliotti, S.; Sesti, G.; Perticone, F. Ketogenic Diet-Induced Weight Loss is Associated with an Increase in Vitamin D Levels in Obese Adults. Molecules 2019, 24, 2499, doi:10.3390/molecules24132499.
- Hasegawa, H.; Nagano, N.; Urakawa, I.; Yamazaki, Y.; Iijima, K.; Fujita, T.; Yamashita, T.; Fukumoto, S.; Shimada, T. Direct evidence for a causative role of FGF23 in the abnormal renal phosphate handling and vitamin D metabolism in rats with early-stage chronic kidney disease. Kidney Int. 2010, 78, 975–980, doi:10.1038/ki.2010.313.
- Kidney Disease: Improving Global Outcomes (KDIGO) CKD-MBD Work Group. KDIGO clinical practice guideline for the diagnosis, evaluation, prevention, and treatment of Chronic Kidney Disease-Mineral and Bone Disorder (CKD_MBD). Kidney Int. Suppl. 2009, 113, S1–S130, doi:10.1038/ki.2009.188.
- Moe, S.; Drüeke, T.; Cunningham, J.; Goodman, W.; Martin, K.; Olgaard, K.; Ott, S.; Sprague, S.; Lameire, N.; Eknoyan, G.; Kidney Disease: Improving Global Outcomes (KDIGO). Definition, evaluation, and classification of renal osteodystrophy: A position statement from Kidney Disease: Improving Global Outcomes (KDIGO). Kidney Int. 2006, 69, 1945–1953, doi:10.1038/sj.ki.5000414.
- Yamamoto, S.; Fukagawa, M. Uremic toxicity and bone in CKD. J. Nephrol. 2017, 30, 623–627, doi:10.1007/s40620-017-0406-x.
- Kazama, J.J.; Iwasaki, Y.; Fukagawa, M. Uremic osteoporosis. Kidney Int. Suppl. 2013, 3, 446–450, doi:10.1038/kisup.2013.93.
- Salam, S.N.; Eastell, R.; Khwaja, A. Fragility fractures and osteoporosis in CKD: Pathophysiology and diagnostic methods. Am. J. Kidney Dis. 2014, 63, 1049–1059, doi:10.1053/j.ajkd.2013.12.016.
- Iwasaki, Y.; Kazama, J.J.; Yamato, H.; Fukagawa, M. Changes in chemical composition of cortical bone associated with bone fragility in rat model with chronic kidney disease. Bone 2011, 48, 1260–1267, doi:10.1016/j.bone.2011.03.672.
- Gnudi, S.; Sitta, E.; Lisi, L. Relationship of body mass index with main limb fragility fractures in postmenopausal women. J. Bone Miner. Metab. 2009, 27, 479–484, doi:10.1007/s00774-009-0056-8.
- Compston, J.E.; Watts, N.B.; Chapurlat, R.; Cooper, C.; Boonen, S.; Greenspan, S.; Pfeilschifter, J.; Silverman, S.; Díez-Pérez, A.; Lindsay, R.; et al. Obesity is not protective against fracture in postmenopausal women: GLOW. Am. J. Med. 2011, 124, 1043–1050, doi:10.1016/j.amjmed.2011.06.013.
- Dimitri, P.; Bishop, N.; Walsh, J.S.; Eastell, R. Obesity is a risk factor for fracture in children but is protective against fracture in adults: A paradox. Bone 2012, 50, 457–466, doi:10.1016/j.bone.2011.05.011.
- Cao, J.J. Effects of obesity on bone metabolism. J. Orthop. Surg. Res. 2011, 6, 30, doi:10.1186/1749-799X-6-30.
- Sheu, Y.; Cauley, J.A. The role of bone marrow and visceral fat on bone metabolism. Curr. Osteoporos. Rep. 2011, 9, 67–75, doi:10.1007/s11914-011-0051-6.
- Greco, E.A.; Lenzi, A.; Migliaccio, S. The obesity of bone. Ther. Adv. Endocrinol. Metab. 2015, 6, 273–286, doi:10.1177/2042018815611004.
- Fujita, Y.; Maki, K. High-fat diet-induced obesity triggers alveolar bone loss and spontaneous periodontal disease in growing mice. BMC Obes. 2016, 3, 1–9, doi:10.11867s40608-016-0082-8.
- Xu, F.; Du, Y.; Hang, S.; Chen, A.; Guo, F.; Xu, T. Adipocytes regulate the bone marrow microenvironment in a mouse model of obesity. Mol. Med. Rep. 2013, 8, 823–828, doi:10.3892/mmr.2013.1572.
- Yin, W.; Li, Z.; Zhang, W. Modulation of bone and marrow niche by cholesterol. Nutrients 2019, 11, 1394, doi:10.3390/nu11061394.
- Graham, L.S.; Tintut, Y.; Parhami, F.; Kitchen, C.M.R.; Ivanov, Y.; Tetradis, S.; Effros, R.B. Bone density and hyperlipidemia: The T-lymphocyte connection. J. Bone Miner. Res. 2010, 25, 2460–2469, doi:10.1002/jbmr.148.
- Pelton, K.; Krieder, J.; Joiner, D.; Freeman, M.R.; Goldstein, S.A.; Solomon, K.R. Hypercholesterolemia promotes an osteoporotic phenotype. Am. J. Pathol. 2012, 181, 928–936, doi:10.1016/j.ajpath.2012.05.034.
- Wong, S.K.; Chin, K.Y.; Suhaimi, F.H.; Ahmad, F.; Ima-Nirwana, S. Effects of metabolic syndrome on bone mineral density, histomorphometry and remodelling markers in male rats. PLoS ONE 2018, 13, e0192416, doi:10.1371/journal.pone.0192416.
- Malvi, P.; Piprode, V.; Chaube, B.; Pote, S.T.; Mittal, M.; Chattopadhyay, N.; Wani, M.R.; Bhat, M.K. High fat diet promotes achievement of peak bone mass in young rats. Biochem. Biophys. Res. Commun. 2014, 455, 133–138, doi:10.1016/j.bbrc.2014.10.131.
- Demigné, C.; Bloch-Faure, M.; Picard, N.; Sabboh, H.; Besson, C.; Rémésy, C.; Geoffroy, V.; Gaston, A.T.; Nicoletti, A.; Hagège, A.; et al. Mice chronically fed a westernized experimental diet as a model of obesity, metabolic syndrome and osteoporosis. Eur. J. Nutr. 2006, 45, 298–306, doi:10.1007/s00394-006-0599-6.
- Wong, S.K.; Chin, K.Y.; Suhaimi, F.H.; Ahmad, F.; Ima-Nirwana, S. The relationship between metabolic syndrome and osteoporosis: A review. Nutrients 2016, 8, 347, doi:10.3390/nu8060347.
- Villareal, D.T.; Fontana, L.; Weiss, E.P.; Racette, S.B.; Steger-May, K.; Schechtman, K.B.; Klein, S.; Holloszy, J.O. Bone mineral density response to caloric restriction-induced weight loss or exercise-induced weight loss: A randomized controlled trial. Arch. Intern. Med. 2006, 166, 2502–2510, doi:10.1001/archinte.166.22.2502.
- Villareal, D.T.; Fontana, L.; Das, S.K.; Redman, L.; Smith, S.R.; Saltzman, E.; Bales, C.; Rochon, J.; Pieper, C.; Huang, M.; et al. Effect of two-year caloric restriction on bone metabolism and bone mineral density in non-obese younger adults: A randomized clinical trial. J. Bone Miner. Res. 2016, 31, 40–51, doi:10.1002/jbmr.2701.
- Villareal, D.T.; Kotyk, J.J.; Armamento-Villareal, R.C.; Kenguva, V.; Seaman, P.; Shahar, A.; Wald, M.J.; Kleerekoper, M.; Fontana, L. Reduced bone mineral density is not assoaciated with significantly reduced bone quality in men and women practicing long-term calorie restriction with adequate nutrition. Aging Cell 2011, 10, 96–102, doi:10.1111/j.1474-9726.2010.00643.x.
- Shapses, S.A.; Riedt, C.S. Bone, body weight, and weight reduction: What are the concerns?. J. Nutr. 2006, 136, 1453–1456, doi:10.1093/jn/136.6.1453.
- Schoell, S.L.; Weaver, A.A.; Beavers, D.P.; Lenchik, L.; Marsh, A.P.; Rejeski, W.J.; Stitzel, J.D.; Beavers, K.M. Development of subject-specific proximal femur finite element models of older adults with obesity to evaluate the effects of weight loss on bone strength. J. Osteoporos. Phys. Act. 2018, 6, 213, doi:10.4172/2329-9509.1000213.
- Ensrud, K.E.; Vo, T.N.; Burghardt, A.J.; Schousboe, J.T.; Cauley, J.A.; Taylor, B.C.; Hoffman, A.R.; Orwoll, E.S.; Lane, N.E.; Langsetmo, L.; et al. Weight loss in men in late life and bone strength and microarchitecture: A prospective study. Osteoporos. Int. 2018, 29, 1549–1558, doi:10.1007/s00198-018-4489-6.
- Cao, J.J. Caloric restriction combined with exercise is effective in reducing adiposity and mitigating bone structural deterioration in obese rats. Ann. N. Y. Acad. Sci. 2018, 1433, 41–52, doi:10.1111/nyas.13936.
- Dennison, E.M.; Syddal, H.E.; Sayer, A.A.; Craighead, S.; Phillips, D.I.W.; Cooper, C. Type 2 diabetes mellitus is associated with increased axial bone density in men and women from the Hertfordshire Cohort Study: Evidence for an indirect effect of insulin resistance? Diabetologia 2004, 47, 1963–1968, doi:10.1007/s00125-004-1560-y.
- Ding, C.; Parameswaran, V.; Udayan, R.; Burgess, J.; Jones, G. Circulatin levels of inflammatory markers predict change in bone mineral density and resorption in older adults: A longitudinal study. J. Clin. Endocrinol. Metab. 2008, 93, 1952–1958, doi:10.1210/jc.2007-2325.
- Barbour, K.E.; Lui, L.Y.; Ensrud, K.E.; Hillier, T.A.; LeBlanc, E.S.; Ing, S.W.; Hochberg, M.C.; Cauley, J.A.; Study of Osteoporotic Fractures (SOF) Research Group. Inflammatory markers and risk of hip fracture in older white women: The study of osteoporotic fractures. J. Bone Miner. Res. 2014, 29, 2057–2064, doi:10.1002/jbmr.2245.
- Veronese, N.; Stubbs, B.; Crepaldi, G.; Solmi, M.; Cooper, C.; Harvey, N.C.W.; Reginster, J.Y.; Rizzoli, R.; Civitelli, R.; Schofield, P.; et al. Relationship between low bone mineral density and fractures with incident cardiovascular disease: A systematic review and meta-analysis. J. Bone Miner. Res. 2017, 32, 1126–1135, doi:10.1002/jbmr.3089.
- Lee, S.J.; Lee, I.K.; Jeon, J.H. Vascular Calcification-New Insights into Its Mechanism. Int. J. Mol. Sci. 2020, 21, 2685; doi:10.3390/ijms21082685.
- Weiss, E.P.; Fontana, L. Caloric restriction: Powerful protection for the aging heart and vasculature. Am. J. Physiol. Heart Circ. Physiol. 2011, 301, H1205–H1219, doi:10.1152/ajpheart.00685.2011.
- Wu, M.; Rementer, C.; Giachelli, C.M. Vascular calcification: An update on mechanisms and challenges in treatment. Calcif. Tissue Int. 2013, 93, 365–373, doi:10.1007/s00223-013-9712-z.
- Giachelli, C.M. The emerging role of phosphate in vascular calcification. Kidney Int. 2009, 75, 890–897, doi:10.1038/ki.2008.644.
- Rodriguez, M.; Aguilera-Tejero, E. Energy-dense diets and mineral metabolism in the context of chronic kidney disease-metabolic bone disease (CKD-MBD). Nutrients 2018, 10, 1840, doi:10.3390/nu10121840.
- Rios, R.; Raya, A.I.; Pineda, C.; Rodríguez, M.; Lopez, I.; Aguilera-Tejero, E. Vitamin E protects against extraskeletal calcification in uremic rats fed high fat diets. BMC Nephrol. 2017, 18, 1–8, doi:10.1186/s12882-017-0790-4.
- Wang, M.; Zhang, L.; Zhu, W.; Zhang, J.; Kim, S.H.; Wang, Y.; Ni, L.; Telljohann, R.; Monticone, R.E.; McGraw, K.; et al. Calorie restriction curbs proinflammation that accompanies arterial aging, preserving a youthful phenotype. J. Am. Heart Assoc. 2018, 7, e009112, doi:10.1161/JAHA.118.009112.
- Kalantar-Zahed, K.; Rhee, C.M.; Chou, J.; Ahmadi, S.F.; Park, J.; Chen, J.L.T.; Amin, A.N. The obesity paradox in kidney disease: How to reconcile it with obesity management. Kidney Int Rep. 2017, 2, 271–281, doi:10.1016/j.ekir.2017.01.009.


