 +1 credit
| Version | Summary | Created by | Modification | Content Size | Created at | Operation |
|---|---|---|---|---|---|---|
| 1 | Carla Viegas | + 2577 word(s) | 2577 | 2020-09-24 05:09:10 | | | |
| 2 | Rita Xu | -1121 word(s) | 1456 | 2020-09-24 07:41:35 | | |
Video Upload Options
The exposure to particles and bioaerosols has been associated with the increase in health e ects in children. The objective of this study was to assess the indoor exposure to bioburden in the indoor microenvironments more frequented by children. Air particulate matter (PM) and settled dust were sampled in 33 dwellings and four schools with a medium volume sampler and with a passive method using electrostatic dust collectors (EDC), respectively. Settled dust collected by EDC was analyzed by culture-based methods (including azole resistance profile) and using qPCR.
Results showed that the PM2.5 and PM10 concentrations in classrooms were higher than in homes and highly exceeded the limit values established by the Portuguese legislation for indoor air quality. The fungal species most commonly found in bedrooms was Penicillium sp. (91.79%), whereas, in living rooms, it was Rhizopus sp. (37.95%). Aspergillus sections with toxigenic potential were found in bedrooms and living rooms and were able to grow on VOR.
1. Introduction
Children are more susceptible to air pollutants compared to adults since they breathe more air relative to their body weight, their immune system is still in development and they have a lower ability to deal with the toxicity due to their undeveloped airways [1][2]. Children spend more than 85% of their time in indoor environments, mainly at home and school [3] and therefore it is essential to assess the indoor air quality (IAQ) in these microenvironments to estimate their integrated exposure to air pollutants.
Pollutants such as particulate matter (PM) are linked to an increase in morbidity and mortality [4][5]. PM is a complex mixture of small-diameter particles with different physical and chemical characteristics. PM is classified according to their diameter (e.g., PM2.5 and PM10, which are particles with an aerodynamic diameter smaller than 2.5 and 10 μm, respectively), because this physical characteristic highly affects the penetration into the respiratory tract [6][7]. PM2.5 or fine particles reach the lower respiratory tract, while the PM2.5–10 or coarse particles can reach the upper respiratory tract. In addition, the health impact of the PM depends on its composition, which is highly determined by the emission sources.
Bioaerosols are usually defined as PM with biological origins such as microorganisms, pollen and plant fibers. The exposure to biological agents can lead to a wide range of adverse health effects, including allergies, infection diseases, breathing problems and cancer [4].
Previous studies reported a wide range of environmental factors that influence bioburden (covering bacteria and fungi) indoors, such as the occupancy of the spaces [8][9], building layout, ventilation [10] and cleaning procedures including the type of products applied [4]. Furthermore, poor maintenance of heating, ventilation and air conditioning systems can also enhance the hazardous effects of many biological and nonbiological pollutants [11]. Due to the influence of these multiple environmental variables, sampling bioburden should be performed by passive methods, together with more conventional air sampling [12][13][14][15]. Indeed, passive methods allow defining the contamination of a larger period of time (ranging from weeks to several months), whereas air samples can only replicate the load from a shorter period of time (mostly minutes) [16].
The electrostatic dust collector (EDC) is a passive collection device easy-to-use that comprises an electrostatic polypropylene cloth [17]. The use of this device is gradually increasing since it is low-cost and effective for the collection of dust [16][18][19], and it has already been applied for the bioburden assessment in several indoor environments [16][19][20][21][22][23][24][25][26][27].
The emergence worldwide of drug-resistant human pathogenic fungal species, such as Candida sp. and Aspergillus fumigatus, and the increasing reports of therapeutic failure against fungal infections caused by environmental resistant strains [28][29][30], has revealed the need of surveillance of fungal resistance in the indoor and outdoor environments, which is mostly described for Aspergillus section Fumigati [31][32][33][34][35][36].
2. Particulate Matter Assessment
The PM2.5 and PM10 average concentrations in the classrooms were 31.15 and 57.83 µg/m3, respectively, with a range between 19.47 and 52.91 µg/m3 for PM2.5 and between 32.72 and 109.02 µg/m3 for PM10. Table 1 shows that in dwellings, the concentrations ranged between 6.05 and 67.96 µg/m3 for PM2.5 and between 9.14 and 72.95 µg/m3 for PM10, with an average concentration of 15.26 µg/m3 and 18.95 µg/m3, respectively. The PM2.5 concentrations exceeded the 8-hr limit value established by the Portuguese legislation for indoor air quality (Portaria 353-A/2013, 25 μg/m3) in 50% of the schools and in 12% of the dwellings and the PM10 limit value (50 μg/m3) was exceeded in 50% of the schools and in 3% of the dwellings.
Table 1. Settled dust (g/m2/d) and PM2.5 and PM10 concentrations (µg/m3) measured in dwellings and schools.
| Settled Dust (g/m2/d) | PM2.5 (µg/m3) | PM10 (µg/m3) | ||
|---|---|---|---|---|
| Schools | Average | 1.42 | 31.15 | 57.83 |
| Range (min–max) | 1.28–1.57 | 19.47–52.91 | 32.72–109.02 | |
| Dwellings | Average | 3.36 | - | - |
| Range (min–max) | 1.27–11.16 | - | - | |
| Living Rooms | Average | 3.60 | 15.26 | 18.95 |
| Range (min–max) | 1.28–11.16 | 6.05–67.96 | 9.14–72.95 | |
| Bedrooms | Average | 3.11 | - | - |
| Range (min–max) | 1.27–10.74 | - | - |
Regarding the settled dust collected by the EDC, the schools presented an average level of 1.42 g/m2/d with a range between 1.28 and 1.57 g/m2/d and the dwellings registered an average of 3.36 g/m2/d with a range between 1.27 and 11.16 g/m2/d. In dwellings, the living room presented an average amount of 3.6 g/m2/d and the bedroom of 3.11 g/m2/d (Table 1).
3. Bacterial Contamination Assessment
From the 31 samples collected in the bedrooms, the total bacteria contamination ranged from below the detection limit to 1.42 × 10³ CFU/m2/d, with the Gram-negative bacteria contamination, ranging from below the detection limit to 3.15 × 101 CFU/m2/d.
Total bacteria contamination in the 33 EDC collected in living rooms ranged from below the detection limit to 3.42 × 10³ CFU/m2/d, with the Gram-negative bacteria contamination, ranging from below the detection limit to 4.60 × 101 CFU/m2/d.
In the 4 EDC samples collected in the classrooms, the total bacteria contamination ranged from below the detection limit to 6.2 × 101 CFU/m2/d, while there was no contamination by Gram-negative bacteria (Table 2).
Table 2. Bacteria contamination (CFU/m2/d) in each studied location.
| Location | Total Bacteria | Gram-Negative Bacteria | ||
|---|---|---|---|---|
| Average | N | CFU/m2/d | CFU/m2/d | |
| Bedrooms | Range (min–max) | 31 | *−1.42 × 10³ | *−3.15 × 101 |
| Living Rooms | Range (min–max) | 33 | *−3.42 × 10³ | *−4.60 × 101 |
| Classrooms | Range (min–max) | 4 | *−6.2 × 101 | - |
4. Fungal Contamination Assessment
A total of 31 EDC were collected from bedrooms. The fungal contamination in these samples ranged from lower the detection limit to 2.00 × 10³ CFU/m2/d (D30) in MEA, and from lower the detection limit to 2.81 × 10³ CFU/m2/d (D32) in DG18. The most commonly found fungal species in MEA was Penicillium sp. (2.00 × 10³ CFU/m2/d; 89.43%), followed by Cladosporium sp. (1.59 × 10² CFU/m2/d; 7.10%) and Chrysosporium sp. (2.56 × 101 CFU/m2/d; 1.14%; Table 3. In DG18, the most prevalent species were Cladosporium sp. (2.81 × 10³ CFU/m2/d; 90.44%), Penicillium sp. (2.07 × 10² CFU/m2/d; 6.67%) and Aspergillus sp. (1.05 × 10² CFU/m2/d; 1.23%; Table 3). Four different Aspergillus sections were identified in the EDC samples from the bedrooms, two found in MEA (Nigri and Fumigati; 1.05 × 101 CFU/m2/d), and two in DG18 (Candidi and Circumdati; 3.81 × 101 CFU/m2/d; Figure 1).
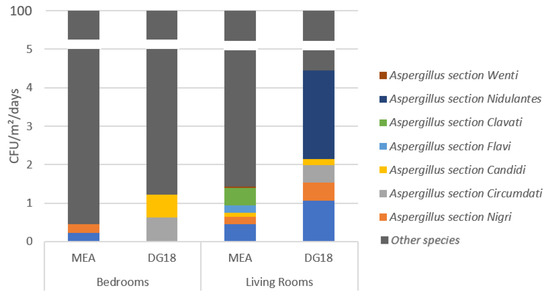
Figure 1. Aspergillus sections identified in the electrostatic dust collectors (EDC) samples from the bedrooms and the living rooms.
Table 3. Fungal species found in each studied location.
| Location | Genus/Species | MEA | DG18 | ||||
|---|---|---|---|---|---|---|---|
| N | CFU/m2/d | % | N | CFU/m2/d | % | ||
| Bedrooms | Alternaria sp. | 2 | 1.05 × 101 | 0.47 | 1 | 1.05 × 101 | 0.34 |
| Aureobasidium sp. | 1 | 5.24 × 100 | 0.23 | 1 | 5.24 × 100 | 0.17 | |
| Chrysosporium sp. | 3 | 2.56 × 101 | 1.14 | 2 | 9.49 × 100 | 0.31 | |
| Cladosporium sp. | 8 | 1.59 × 10² | 7.10 | 14 | 2.81 × 10³ | 90.44 | |
| Geotrichum sp. | 1 | 4.14 × 100 | 0.18 | 1 | 5.24 × 100 | 0.17 | |
| Penicillium sp. | 17 | 2.00 × 10³ | 89.43 | 12 | 2.07 × 10² | 6.67 | |
| Aspergillus sp. | 2 | 1.05 × 101 | 0.47 | 2 | 3.81 × 101 | 1.23 | |
| Fusarium sp. | 2 | 2.18 × 101 | 0.97 | 0 | * | * | |
| Crysonilia sitophila | 0 | * | * | 2 | 2.10 × 101 | 0.68 | |
| Living rooms | Alternaria sp. | 1 | 5.24 × 100 | 0.04 | 0 | * | * |
| Aspergillus sp. | 2 | 1.33 × 10² | 0.97 | 2 | 1.68 × 10² | 4.91 | |
| Aureobasidium sp. | 1 | 4.91 × 100 | 0.04 | 0 | * | * | |
| Chrysonilia sp. | 2 | 5.24 × 10³ | 38.11 | 1 | 2.62 × 10³ | 76.55 | |
| Chrysosporium sp. | 4 | 2.64 × 10³ | 19.19 | 8 | 6.68 × 101 | 1.95 | |
| Cladosporium sp. | 13 | 2.22 × 10² | 1.61 | 12 | 1.7 × 10² | 4.96 | |
| Fusarium sp. | 0 | * | * | 1 | 2.46 × 101 | 0.72 | |
| Geotrichum sp. | 0 | * | * | 2 | 1.48 × 101 | 0.43 | |
| Penicillium sp. | 14 | 2.65 × 10² | 1.93 | 16 | 3.54 × 10² | 10.33 | |
| Rhizopus sp. | 2 | 5.24 × 10³ | 38.11 | 0 | * | * | |
| Ulocladium sp. | 0 | * | * | 1 | 5.24 × 100 | 0.15 | |
| Classrooms | Penicillium sp. | 2 | 1.76 × 101 | 64.21 | 0 | * | * |
| Chrysonilia sp. | 1 | 4.91 × 100 | 17.90 | 1 | 4.91 × 100 | 19.74 | |
| Cladosporium sp. | 1 | 4.91 × 100 | 17.90 | 1 | 4.91 × 100 | 19.74 | |
| Aspergillus sp. | 0 | * | * | 1 | 4.91 × 100 | 19.74 | |
| Chrysosporium sp. | 0 | * | * | 1 | 1.02 × 101 | 40.79 | |
In the 33 EDC collected from the living rooms, the fungal contamination ranged from lower the detection limit to 5.24 × 10³ CFU/m2/d (D3, D6 and D28) in MEA, and from lower the detection limit to 2.62 × 10³ CFU/m2/d (D32). In MEA, the most common was Rhizopus sp. (5.24 × 10³ CFU/m2/d; 38.11%), followed by Chrysonilia sp. (5.24 × 10³ CFU/m2/d; 38.11%) and Chrysosporium sp. (2.64 × 10³ CFU/m2/d; 19.19%); in DG18, Chrysonilia sp. (2.62 × 10³ CFU/m2/d; 76.55%), followed by Penicillium sp. (3.54 × 10² CFU/m2/d; 10.33%) and Cladosporium sp. (1.7 × 10² CFU/m2/d; 4.96%) were the most prevalent (Table 3). A total of eight Aspergillus sections were identified in the samples from the living room. Five different sections were found in MEA, including Aspergillus section Fumigati (6.18 × 101 CFU/m2/d), Flavi and Nigri (2.62 × 101 CFU/m2/d; Figure 1). In DG18, six Aspergillus sections were identified, with the most prevalent being Nidulantes (7.89 × 101 CFU/m2/d), followed by Fumigati (3.67 × 101 CFU/m2/d) and Clavati (1.57 × 101 CFU/m2/d; Figure 1).
Four EDC were recovered from classrooms. The fungal contamination in the MEA samples ranged from the lower detection limit (S1) to 1.76 × 101 CFU/m2/d (in the three remaining samples), and in DG18 from the lower detection limit (S1 and S3) to 1.02 × 101 CFU/m2/d (in S4). Three different fungal species were identified in the MEA samples: Penicillium sp. (1.76 × 101 CFU/m2/d; 64.21%), Chrysonilia sp. and Cladosporium sp. (4.91 × 101 CFU/m2/d; 17.90%; Table 3). Four fungal species were found in DG18: Chrysosporium sp. (1.02 × 101 CFU/m2/d; 40.79%), Aspergillus section Nidulantes, Chrysonilia sp. and Cladosporium sp. (1.02 × 101 CFU/m2/d; 19.74%; Table 3).
References
- Selgrade, M.K.; Plopper, C.G.; Gilmour, M.I.; Conolly, R.B.; Foos, B.S.P. Assessing the health effects and risks associated with children’s inhalation exposures—Asthma and allergy. J. Toxicol. Environ. Health Part A 2008, 71, 196–207.
- WHO. Effects of Air Pollution on Children’s Health and Development–A Review of the Evidence; WHO Regional Office for Europe, WHO Press: Copenhagen, Denmark, 2005.
- Faria, T.; Martins, V.; Correia, C.; Canha, N.; Diapouli, E.; Manousakas, M.; Eleftheriadis, K.; Almeida, S.M. Children’s exposure and dose assessment to particulate matter in Lisbon. Build. Environ. 2020, 171, 106666.
- Douwes, J.; Thorne, P.; Pearce, N.; Heederik, D. Bioaerosol health effects and exposure assessment: Progress and prospects. Ann. Occup. Hyg. 2003, 47, 187–200.
- Martinelli, N.; Olivieri, O.; Girelli, D. European Journal of Internal Medicine Air particulate matter and cardiovascular disease: A narrative review. Eur. J. Intern. Med. 2013, 24, 295–302.
- Calvo, A.I.; Alves, C.; Castro, A.; Pont, V.; Vicente, A.M.; Fraile, R. Research on aerosol sources and chemical composition: Past, current and emerging issues. Atmos. Res. 2013, 120–121, 1–28.
- Seinfeld, J.H.; Pandis, S.N. Atmospheric Chemistry and Physics: From Air Pollution to Climate Change; John Wiley and Sons: Incorporated, NY, USA, 1998.
- Ekhaise, F.O.; Ogboghodo, B.I. Microbiological indoor and outdoor air quality of two major hospitals in Benin City, Nigeria. Sierra Leone J. Biomed. Res. 2011, 3, 169–174.
- Sudharsanam, S.; Swaminathan, S.; Ramalingam, A.; Thangavel, G.; Annamalai, R.; Steinberg, R.; Balakrishnan, K.; Srikanth, P. Characterization of indoor bioaerosols from a hospital ward in a tropical setting. Afr. Health Sci. 2012, 12, 217–225.
- Ekhaise, F.O.; Isitor, E.E.; Idehen, O.; Emoghene, A.O. Airborne Microflora in the Atmosphere of an Hospital Environment of University of Benin Teaching Hospital (UBTH), Benin City, Nigeria. World J. Agric. Sci. 2010, 6, 166–170.
- Salama, K.F.; Berekaa, M.M. Assessment of air quality in Dammam slaughter houses, Saudi Arabia. Int. J. Med. Sci. Public Health Online 2015, 5, 287–291.
- Klánova, K.; Hollerová, J. Hospital indoor environment: Screening for microorganisms and particulate matter. Indoor Built Environ. 2003, 12, 61–67.
- Park, D.U.; Yeom, J.K.; Lee, W.J.; Lee, K.M. Assessment of the levels of airborne bacteria, gram-negative bacteria, and fungi in hospital lobbies. Int. J. Environ. Res. Public Health 2013, 10, 541–555.
- Tang, C.S.; Wan, G.H. Air quality monitoring of the post-operative recovery room and locations surrounding operating theatres in a medical center in Taiwan. PLoS ONE 2013, 8, 61093.
- Cabo Verde, S.; Almeida, S.M.; Matos, J.; Guerreiro, D.; Meneses, M.; Faria, T.; Botelho, D.; Santos, M.; Viegas, C. Microbiological assessment of indoor air quality at different hospital sites. Res. Microbiol. 2015, 166, 557–563.
- Viegas, C.; Coggins, A.M.; Faria, T.; Caetano, L.A.; Gomes, A.Q.; Sabino, R.; Fleming, G.T. Fungal burden exposure assessment in podiatry clinics. Int. J. Environ. Health Res. 2018, 28, 167–177.
- American Conference of Governmental Industrial Hygienists (ACGIH). Threshold Limit Values for Chemical Substances and Physical Agents and Biological Exposure Indices; ACGIH: Cincinnati, OH, USA, 2009.
- Kilburg-Basnyat, B.; Metwali, N.; Thorne, P.S. Performance of electrostatic dust collectors (EDCs) for endotoxin assessment in homes: Effect of mailing, placement, heating and electrostatic charge. J. Occup. Environ. Hyg. 2016, 13, 85–93.
- Viegas, C.; Santos, P.; Almeida, B.; Monteiro, A.; Carolino, E.; Quintal Gomes, A.; Viegas, S. Electrostatic dust collector: A passive screening method to assess occupational exposure to organic dust in primary health care centers. Air Qual. Atmos. Health 2019, 12, 573–583.
- Cozen, W.; Avol, E.; Diaz-Sanchez, D.; McConnell, R.; Gauderman, W.J.; Cockburn, M.G.; Mack, T.M. Use of an electrostatic dust cloth for self-administered home allergen collection. Twin Res. Hum. Genet. 2008, 11, 150–155.
- Normand, A.C.; Vacheyrou, M.; Sudre, B.; Heederik, D.J.J.; Piarroux, R. Assessment of dust sampling methods for the study of cultivable-microorganism exposure in stables. Appl. Environ. Microbiol. 2009, 75, 7617–7623.
- Madsen, A.M.; Matthiesen, C.B.; Frederiksen, M.W.; Frederiksen, M.; Frankel, M.; Spilak, M.; Timm, M. Sampling, extraction and measurement of bacteria, endotoxin, fungi and inflammatory potential of settling indoor dust. J. Environ. Monit. 2012, 14, 3230–3239.
- Dorado-Garcia, A.; Bos, M.E.; Graveland, H.; Van Cleef, B.A.; Verstappen, K.M.; Kluytmans, J.A.; Wagenaar, J.A.; Heederik, D.J. Risk factors for persistence of livestock-associated MRSA and environmental 506 exposure in veal calf farmers and their family members: An observational longitudinal study. BMJ 2013, 3, e003272.
- Kilburg-Basnyat, B.; Metwali, N.; Thorne, P.S. Effect of deployment time on endotoxin and allergen exposure assessment using electrostatic dust collectors. Annals Occup. Hyg. 2014, 59, 104–115.
- Feld, L.; Bay, H.; Angen, Ø.; Larsen, A.R.; Madsen, A.M. Survival of LA-MRSA in Dust from Swine Farms. Ann. Work Expo. Health 2018, 62, 147–156.
- Viegas, C.; Monteiro, A.; Aranha Caetano, L.; Faria, T.; Carolino, E.; Viegas, S. Electrostatic Dust Cloth: A Passive Screening Method to Assess Occupational Exposure to Organic Dust in Bakeries. Atmosphere 2018, 9, 64.
- Viegas, C.; Twarużek, M.; Lourenço, R.; Dias, M.; Almeida, B.; Caetano, L.A.; Carolino, E.; Gomes, A.Q.; Kosicki, R.; Soszczyńska, E.; et al. Bioburden Assessment by Passive Methods on a Clinical Pathology Service in One Central Hospital from Lisbon: What Can it Tell Us Regarding Patients and Staff Exposure? Atmosphere 2020, 11, 351.
- Snelders, E.; Melchers, W.J.; Verweij, P.E. Azole resistance in Aspergillus fumigatus: A new challenge in the management of invasive aspergillosis? Future Microbiol. 2011, 6, 335–347.
- Verweij, P.E.; Chowdhary, A.; Melchers, W.J.G.; Meis, J.F. Azole resistance in Aspergillus fumigatus: Can we retain the clinical use of mold-active antifungal azoles? Clin. Infect. Dis. 2016, 62, 362–368.
- Fisher, M.C.; Hawkins, N.J.; Sanglard, D.; Gurr, S.J. Worldwide emergence of resistance to antifungal drugs challenges human health and food security. Science 2018, 18, 739–742.
- Snelders, E.; Huis in ’t Veld, R.A.G.; Rijs, A.J.M.M.; Kema, G.H.J.; Melchers, W.J.G.; Verweij, P.E. Possible Environmental Origin of Resistance of Aspergillus fumigatus to Medical Triazoles. Appl. Environ. Microbiol. 2009, 75, 4053–4057.
- Ahmad, S.; Khan, Z.; Hagen, F.; Meis, J.F. Occurrence of triazole-resistant Aspergillus fumigatus with TR34/L98H mutations in outdoor and hospital environment in Kuwait. Environ. Res. 2014, 133, 20–26.
- Loeffert, S.T.; Hénaff, L.; Dupont, D.; Bienvenu, A.L.; Dananché, C.; Cassier, P.; Bénet, T.; Wallon, M.; Gustin, M.P.; Vanhems, P. Prospective survey of azole drug resistance among environmental and clinical isolates of Aspergillus fumigatus in a French University hospital during major demolition works. J. Mycol. Méd. 2018, 28, 469–472.
- Chen, Y.; Kuo, S.; Wang, H.; Wu, C.; Lin, Y.; Li, W.; Lee, C. Azole resistance in Aspergillus species in Southern Taiwan: An epidemiological surveillance study. Mycoses 2019, 62, 1174–1181.
- Cho, S.Y.; Lee, D.G.; Kim, W.B.; Chun, H.S.; Park, C.; Myong, J.P.; Park, Y.J.; Choi, J.K.; Lee, H.J.; Kim, S.H.; et al. Epidemiology and Antifungal Susceptibility Profile of Aspergillus Species: Comparison between Environmental and Clinical Isolates from Patients with Hematologic Malignancies. J. Clin. Microbiol. 2019, 57, e02023-18.
- Monteiro, C.; Pinheiro, D.; Maia, M.; Faria, M.A.; Lameiras, C.; Pinto, E. Aspergillus species collected from environmental air samples in Portugal-molecular identification, antifungal susceptibility and sequencing of cyp51A gene on A. fumigatus sensu stricto itraconazole resistant. J. Appl. Microbiol. 2019, 126, 1140–1148.


