Submitted Successfully!
To reward your contribution, here is a gift for you: A free trial for our video production service.
Thank you for your contribution! You can also upload a video entry or images related to this topic.
Version Summary Created by Modification Content Size Created at Operation
1 + 3558 word(s) 3558 2021-08-20 11:53:24 |
2 format corrected. + 307 word(s) 3865 2021-08-27 10:26:34 | |
3 format corrected. + 307 word(s) 3865 2021-08-27 10:27:41 | |
4 format corrected. + 307 word(s) 3865 2021-08-27 10:28:49 |

Video Upload Options

Do you have a full video?

Confirm

Are you sure to Delete?
Cite
If you have any further questions, please contact Encyclopedia Editorial Office.
Ling, J. Seagrass Rhizosphere Sediment Bacteria. Encyclopedia. Available online: https://encyclopedia.pub/entry/13625 (accessed on 26 April 2024).
Ling J. Seagrass Rhizosphere Sediment Bacteria. Encyclopedia. Available at: https://encyclopedia.pub/entry/13625. Accessed April 26, 2024.
Ling, Juan. "Seagrass Rhizosphere Sediment Bacteria" Encyclopedia, https://encyclopedia.pub/entry/13625 (accessed April 26, 2024).
Ling, J. (2021, August 27). Seagrass Rhizosphere Sediment Bacteria. In Encyclopedia. https://encyclopedia.pub/entry/13625
Ling, Juan. "Seagrass Rhizosphere Sediment Bacteria." Encyclopedia. Web. 27 August, 2021.
Seagrass Rhizosphere Sediment Bacteria
Edit

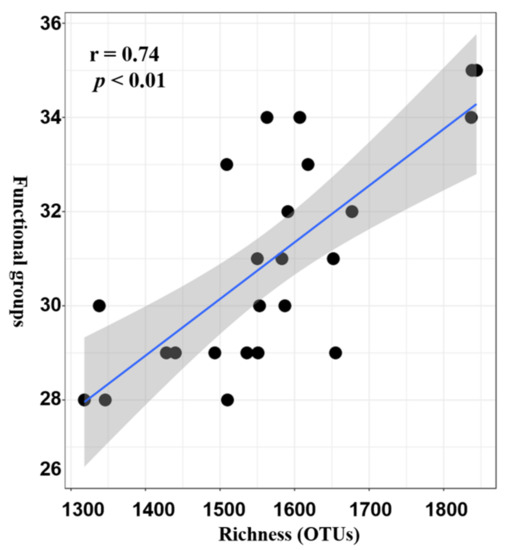
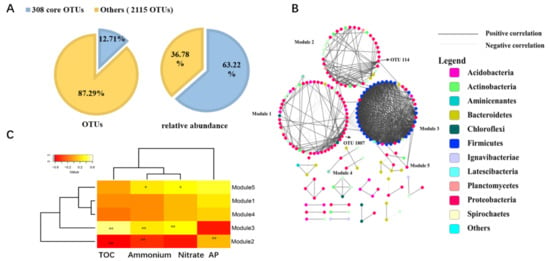
Seagrasses are an important part of the coral reef ecosystem, and their rhizosphere microbes are of great ecological importance. However, variations in diversity, composition, and potential functions of bacterial communities in the seagrass rhizosphere of coral reef ecosystems remain unclear. This study employed the high-throughput sequencing based on 16S rDNA gene sequences and functional annotation of prokaryotic taxa (FAPROTAX) analysis to investigate these variations based on seagrass species and sampling locations, respectively. Results demonstrated that the seagrass rhizosphere microbial community was mainly dominated by phylum Proteobacteria (33.47%), Bacteroidetes (23.33%), and Planctomycetes (12.47%), while functional groups were mainly composed of sulfate respiration (14.09%), respiration of sulfur compounds (14.24%), aerobic chemoheterotrophy (20.87%), and chemoheterotrophy (26.85%). Significant differences were evident in alpha diversity, taxonomical composition and putative functional groups based on seagrass species and sampling locations. Moreover, the core microbial community of all investigated samples was identified, accounting for 63.22% of all obtained sequences. Network analysis indicated that most microbes had a positive correlation (82.41%), and two module hubs (phylum Proteobacteria) were investigated. Furthermore, a significant positive correlation was found between the OTUs numbers obtained and the functional groups assigned for seagrass rhizosphere microbial communities (p < 0.01). Our result would facilitate future investigation of the function of seagrass rhizosphere microbes. 

seagrass rhizosphere bacterial communities community structure functional groups core microbial community coral reef ecosystems

1. Introduction

Seagrass holobiont could execute many functions that may benefit their hosts [1][2][3]. Its structure and function are key to seagrass productivity, health, and the biogeochemical cycle of carbon, nitrogen, and sulfur cycle [3][4][5]. The seagrass rhizosphere microbe refers to the microbe that inhabits in the narrow zone surrounding and could be influenced by seagrass roots [5][6]. Moreover, the rhizosphere microbiome plays crucial roles in affecting plant health, such as nutrient uptake, preventing colonization by pathogens, and modulating host immunity, etc. [3][5][7]. The predominant bacteria in the rhizosphere of seagrass Zostera marina, Z.noltii, and Cymodocea nodosa were Proteobacteria, Bacteroidetes, Chloroflexi, Planctomycetes, Actinobacteria, and Acidobacteria [8]. Moreover, their results also showed that rhizobiomes of different seagrass species from the same region exhibited no significant differences, while seagrass derived from distinct sampling locations had significant variations [8].
Sulfide is a highly toxic compound that can be taken up into seagrass roots due to the low oxygen level in the sediment, and is the one main reason that causes seagrass death globally [9][10]. The investigation by metagenomic analysis revealed that seagrass Z. marina’s rhizosphere harbored free-living forms of sulfur-oxidizing chemolithoautotrophic symbionts, which may contribute much to the survival of seagrass through detoxification of sulfide in seagrass rhizosphere [6]. Another essential functional microbial group was the nitrogen cycling microbe. For example, 27% of the total nitrogen demand for seagrass growth could be fulfilled by efficiently recycling organic nitrogen, nitrogen fixation, or other ways of the external source of nitrogen [11]. Biological nitrogen fixation in the phyllosphere of Posidonia oceanica of the Mediterranean Sea supplied the total N demand for seagrass P. oceanica growth [11]. Moreover, the associated microbes of the tropical seagrass Halophila stipulacea has also been reported to fix nitrogen in different conditions and has provided their required host nitrogen [12]. There existed a beneficial mutualistic relationship between the seagrasses plant and heterotrophic nitrogen-fixing microbes in the seagrass rhizosphere [13].
Core microbial community may play an essential role in the microbial community’s function from specified habits, and identifying the core microbiome is crucial for understanding the stable and consistent microbial species across different sampling locations [8][14]. The previous investigation showed that core microbes among rhizobiomes of varying seagrass species and the same seagrass species, collected from other sites and sulfur-related metabolism microbes, were a significant component of the core rhizobiome of seagrasses [8].

2. Analysis on Results

2.1. Sampling Locations and Physicochemical Properties of the Seagrass Rhizosphere

The sampling location and all the measured physicochemical parameters of investigated samples are shown in Table 1. All four seagrass species across four coral reef ecosystems were studied. There were variations in the physicochemical parameters for different samples. For instance, pH values varied between 8.14 and 8.24 ± 0.03. The salinity range was from 24.70 ± 0.3 to 34.57 ± 0.08 practical salinity unit (PSU), with the lowest value detected at SYB. The highest concentration of nitrate was recorded in the region DYB as 0.153 ± 0.004 mg/L, while SYB had the highest concentration of ammonium (0.121 ± 0.002 mg/L). The range of the DO was from 5.82 ± 0.05 to 9.64 ± 0.59 mg/L. The highest TN, TC, and TOC concentration existed in the sediment of XSC.
Table 1. Typical environmental factors of the collected samples (the standard errors in parentheses).
Sample   DYH SYT XST XSH XSC XSS NXH NXT
Latitude (° E)   22.54 18.2 16.84 16.84 16.84 16.84 9.71 10.22
Longtitude (° N)   114.45 119.47 112.34 112.34 112.34 112.34 114.29 114.2
Water pH 8.14
(0)
8.15
(0.01)
8.24
(0.01)
8.24
(0.03)
8.24
(0.03)
8.24
(0.01)
8.15
(0.01)
8.21 (0.01)
Salinity 28.37
(0.07)
24.7
(0.3)
34.52
(0.05)
34.52
(0.15)
34.57
(0.08)
34.52
(0.05)
34.31
(0)
34.54 (0.09)
DO (mg/L) 5.82
(0.05)
6.7
(0.2)
9.47
(0.17)
9.47
(0.51)
9.64
(0.59)
9.47
(0.17)
7.64
(0.03)
8.36 (0.13)
Nitrate (mg/L) 0.153 (0.004) 0.044 (0.002) 0.049 (0.002) 0.049 (0.005) 0.046 (0.001) 0.049 (0.002) 0.06
(0.001)
0.035
(0)
Nitrite (mg/L) 0.001
(0)
0.025 (0.001) 0.016
(0)
0.016 (0.001) 0.016 (0.001) 0.016
(0)
0.001
(0)
0.001
(0)
Ammonium (mg/L) 0.069
(0)
0.121 (0.002) 0.094 (0.002) 0.094 (0.005) 0.091 (0.006) 0.094 (0.002) 0.048 (0.001) 0.032 (0.001)
Phosphate (mg/L) 0.007 (0.001) 0.015
(0)
0.01
(0.001)
0.01
(0.002)
0.01
(0.001)
0.01
(0.001)
0.006
(0)
0.006
(0)
Sediment Ammonium (mg/kg) 3.02
(0.01)
5.97
(0.02)
4.37
(0.01)
2.91
(0.03)
1.45
(0.01)
4.78
(0.02)
6.39
(0.03)
5.48
(0.12)
Nitrate (mg/kg) 22.3
(2.63)
24.4
(3.68)
44.0
(2.10)
62.4
(3.26)
69.4
(4.06)
44.0
(2.24)
32.60
(1.12)
45.60 (1.56)
AP (mg/kg) 18.0
(2.01)
15.0
(1.28)
14.0
(3.06)
11.0
(1.85)
15.0
(2.30)
15.0
(1.60)
18
(2.45)
17
(3.01)
TOC (%) 18.4% (1.89) 32.5%
(2.36)
43.4%
(1.03)
33.2%
(2.64)
40.3% (3.12) 21.8%
(3.56)
36.80
(2.63)
42.06 (3.42)
Note: DYH indicates seagrass Halophila ovalis from Daya Bay; SYT indicates seagrass Thalassia hemprichii from Sanya Bay, XST, XSH, XSC, and XSS indicate T. hemprichii, H. ovalis, Cymodocea nodos and Syringodium isoetifolium collected from the Xisha Islands, and NSH and NST indicates seagrass H. ovalis and T. hemprichii collected from the Nansha Islands.


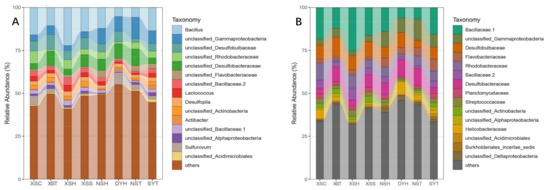
2.2. Taxonomy, Phylogenetic Diversity, and Composition of Rhizosphere Bacterial Communities of the Seagrass

Total sequences assigned to all samples were 1,601,000. After removing chimeric and singleton, the remaining sequences were 1,332,470 belonging to 2423 OTUs, and the minimum read of all samples was 33,987. Then, sixteen OTUs related to chloroplast/mitochondria were removed. The resampling depth was 33,980 merged sequences, with 2405 OTUs left after resampling. All OTUs were grouped into 33 phyla and 290 genera. The rarefaction curves showed that the sequencing depth was relatively enough to cover bacterial diversity as all the rarefaction curves almost reached saturation plateaus (Figure S1), and the minimum coverage of the samples was 98.96% (Table S1). The phylum Proteobacteria accounted for 33.47% of bacterial communities, followed by phylum Bacteroidetes (23.33%) and Planctomycetes (12.47%). At the genus level, the dominant genera were Bacillus (phylum Firmicutes), and the range of its relative abundance for each sample was from 4.61% to 24.04%. The highest abundance was detected in sample XSH (the Xisha Islands), while the lowest sample was DYH (Daya Bay). The other dominant genera were unclassified Desulfobulbaceae (class Deltaproteobacteria), unclassified Rhodobacteraceae (class Alphaproteobacteria), unclassified Bacillaceae 2 (phylum Firmicutes), Lactococcus (phylum Firmicutes), and unclassified Desulfobacteraceae (class Deltaproteobacteria and Desulfopila (class Deltaproteobacteria) (Figure 1).
Figure 1. The relative abundance of the microbial composition of seagrass rhizosphere samples across four coral reef ecosystems at the family (A) and genus (B) level, respectively (DYH indicates seagrass Halophila ovalis from Daya Bay; SYT indicates seagrass Thalassia hemprichii from Sanya Bay, XST, XSH, XSC, and XSS indicate T. hemprichii, H. ovalis, Cymodocea nodos and Syringodium isoetifolium collected from the Xisha Islands, and NSH and NST indicates seagrass H. ovalis and T. hemprichii collected from the Nansha Islands).
The alpha diversity, including PD, Chao1, Richness (Observed OTUs), Shannon, and Simpson index of all samples, was calculated, and is shown in Figure S2. The highest Faith’s PD value was detected in the samples of NST with a value of 80.92 ± 7.95, while the lowest Faith’s PD was 59.3 ± 5.13 for the samples of DYH. Meanwhile, the highest value of Chao1, Richness, Shannon, and Simpson index also existed in the samples of NST. Based on seagrass species (C. nodosa, T. hemprichii, H. ovalis and S. isoetifolium) collected from XS, the alpha index of PD, Richness, Shannon, and Simpson demonstrated significant differences with the p-value below 0.05 (Table 2). For different sampling locations, seagrass H. ovalis from Daya Bay, the Xisha Islands, and the Nansha Islands showed significant variations in Richness, Shannon, and Simpson (p < 0.05), while for seagrass T. hemprichii from Sanya Bay, the Xisha Islands and the Nansha Islands exhibited significant in Richness and Shannon (p < 0.05). The beta diversity analyzed by MRPP based on bray-cutis dissimilarity, Euclidean distance, and Sorensen distance demonstrated that there were significant variations (p < 0.05) for four seagrass species from the same location, while no significant variations were detected for seagrass T. hemprichii and H. ovalis from different sampling locations (p > 0.05) (Table 3).
Table 2. The comparison analysis of phylogenetic and taxonomy alpha diversity based on different seagrass species of same sampling location and the same seagrass species of different sampling locations, respectively.
  Microbial
Communities
Microbial
Communities
Phylogenetic
Composition (PD)
Taxonomic
Alpha Diversity
Richness Shannon Simpson
Species   p p p p
  XSC XST 0.9420 0.6700 0.5250 0.3240
  XSC XSH 0.4550 0.3870 0.7380 0.7380
  XSC XSS 0.5250 0.6700 0.3240 0.5250
  XST XSH 0.0802 0.9690 0.0810 0.0330
  XST XSS 0.2180 0.1060 0.9870 0.9870
  XSS XSH 0.0240 0.0330 0.0330 0.0810
Location            
H. ovalis XSH DYH 0.9500 0.3700 0.0200 0.0200
  XSH CGX 0.2300 0.3700 0.3700 0.3700
  DYH CGX 0.1300 0.0200 0.3700 0.3700
T. hemprichii            
  XST SYT 0.5490 0.5500 0.3700 0.8960
  XST NXT 0.5490 0.3000 0.0370 0.0650
  SYT NXT 0.0930 0.0300 0.0200 0.1730
Note: DYH indicates seagrass Halophila ovalis from Daya Bay; SYT indicates seagrass Thalassia hemprichii from Sanya Bay, XST, XSH, XSC, and XSS indicate T. hemprichii, H. ovalis, Cymodocea nodos and Syringodium isoetifolium collected from the Xisha Islands, and NSH and NST indicates seagrass H. ovalis and T. hemprichii collected from the Nansha Islands; The p value lower than 0.05 (threshold for significance) is shown in italic.
 
Table 3. The comparison analysis of beta diversity based on seagrass species and sampling locations, respectively.
  Microbial
Community
Microbial
Community
Delta
Unifrac
P
Unifrac
Delta
Bray
P
Bray
Delta
Euclidean
P
Euclidean
Delta
Sorensen
P
Sorensen
Species                    
  XSC XST 0.184 0.087 0.294 0.016 1.260 0.156 0.099 0.293
  XSC XSH 0.177 0.084 0.308 0.109 1.590 0.294 0.152 0.282
  XSC XSS 0.049 0.100 0.088 0.100 1.040 0.500 0.061 0.300
  XST XSH 0.219 0.025 * 0.366 0.015 * 1.429 0.017 * 0.136 0.124
  XST XSS 0.176 0.035 * 0.284 0.017 * 1.073 0.009 ** 0.083 0.016 *
  XSH XSS 0.169 0.011 * 0.299 0.012 * 1.403 0.037 * 0.135 0.109
Location                    
H. ovalis XSH NSH 0.039 0.100 0.088 0.100 1.024 0.100 0.111 0.100
  XSH DYH 0.035 0.100 0.125 0.100 1.024 0.100 0.114 0.100
  NSH DYH 0.033 0.100 0.122 0.100 0.667 0.100 0.042 0.100
T. hemprichii XST NST 0.070 0.100 0.110 0.100 20.104 0.100 0.130 0.100
  XST SYT 0.064 0.100 0.112 0.100 19.395 0.100 0.132 0.100
  NST SYT 0.026 0.100 0.105 0.100 18.762 0.100 0.121 0.100
Note: (Values values in the table represent p values (* p < 0.05, ** p < 0.01) (DYH indicates seagrass Halophila ovalis from Daya Bay; SYT indicates seagrass Thalassia hemprichii from Sanya Bay, XST, XSH, XSC, and XSS indicate T. hemprichii, H. ovalis, Cymodocea nodos and Syringodium isoetifolium collected from the Nansha Islands) (The p value lower than 0.05 (threshold for significance) is shown in italic).


2.3. Potential Functional Roles of Microbial Played in Seagrass Rhizosphere

The FAPROTAX database comprises 7820 members (4724 unique members) belonging to 90 groups. The results of this study showed that there were 920 assignment records to groups, and 427 out of 2405 records (17.75%) were assigned to at least one group. In total, 36 functional groups were represented (i.e., associated with at least one record). As illustrated in Figure S3, the top four dominant functional groups were sulfate respiration (129 records), respiration of sulfur compounds (131 records), aerobic chemoheterotrophy (192 records), and chemoheterotrophy (247 records), respectively. The ranges of relative abundance of these four groups in all the samples were 11.75–21.44%, 11.75–21.48%, 7.72–11.34%, and 3.29–8.20%. Further analysis revealed that the sulfate respiration group mainly consists of nine genera, including Desulfatiglans, Desulfobulbus, Desulfocarbo, Desulfomonile, Desulfopila, Desulfosarcina, Desulfovibrio, unclassified Desulfobacteraceae, and unclassified Desulfobulbacea, while for the respiration of sulfur compounds, 11 genera had participated in this process. The diversity of microbes that participated in the procedure of chemoheterotrophy and aerobic chemoheterotrophy is very high. Ninety and sixty-eight genera of microbes were identified, respectively. Spearman’s correlation was employed to test the relationship between alpha diversity (richness) and functional groups obtained, and results showed that there was a positive correlation (r = 0.74, p < 0.01) (Figure 2).
Figure 2. Spearman’s correlation of community species diversity (richness) and functional diversity of all functional groups.

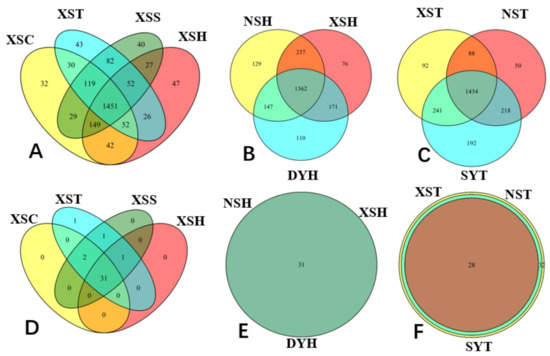
2.4. Venn Diagram Analysis of the Variations in Taxonomy Species and Functional Groups

Based on the seagrass species, the OTUs shared by four seagrass species collected in XS were 1451, and each species had its unique OTUs (Figure 3). Among them, sample XSH had the highest unique OTUs with 47, followed by XSC. Meanwhile, seagrass H. ovalis shared 1362 OTUs with the same species from three sampling locations based on the sampling location. Moreover, for seagrass T. hemprichii, the shared OTUs were 1434, with sample NST possessing 192 unique OTUs. As for the functional structure, from the seagrass species perspective, the functional groups they shared were 31, and no unique functional groups were detected. XST had 33 functional groups and followed by NST having 31 functional groups. Moreover, for seagrass H. ovalis, samples from three sampling locations shared all their functional groups (31), while for seagrass T. hemprichii, they shared 28 functional groups. Furthermore, for seagrass T. hemprichii, the lowest number of functional groups is 28 detected in seagrass SYT, and the highest value is 33 from samples XST (Figure 3).
Figure 3. Venn diagrams analysis of the microbial OTUs and putative functional groups. Venn diagrams showing the unique and shared OTUs numbers (A) between four seagrass species in the Xisha Islands; (B) three sampling locations of seagrass H. ovalis; (C) three sampling locations of seagrass T. hemprichii. Venn diagram showing the unique and shared functional groups (D) between four seagrass species in the Xisha Islands; (E) three sampling locations of seagrass H. ovalis; (F) three sampling locations of seagrass T. hemprichii. DYH indicates seagrass H. ovalis from Daya Bay; SYT indicates seagrass Thalassia hemprichii from Sanya Bay, XST, XSH, XSC, and XSS indicate T. hemprichii, H. ovalis, Cymodocea nodos and Syringodium isoetifolium collected from the Nansha Islands.
Variations in seagrass rhizosphere microbial communities at taxonomical and functional levels were analyzed based on species and locations, respectively. The top abundant 50 genera were included for further taxonomical structure analysis (Tables S2–S4), and all detected functional groups (36) were included for analysis (Tables S5–S7). Most of the investigated genera demonstrated significant differences between different species based on seagrass species (Table S2). Several genera for species’ comparison between two seagrass species from the Xisha Islands, such as Desulfopila, unclassified Bacteroidales, and Eudoraea, which showed no significant differences (p > 0.05). For site-based analysis, many of those genera exhibited substantial variations among the sampling sites, such as genus unclassified Desulfobulbaceae and unclassified Chloroflexi. In contrast, Desulfopila, Oceanobacillus, unclassified Syntrophobacterales, Desulfobulbus of seagrass T. hemprichii (p < 0.05), and Desulfosarcina of seagrass H. ovalis showed no significant differences (p > 0.05).
All investigated samples shared many of the functional groups, but significant differences were also detected in the samples at both species-based and location-based levels. For instance, methanogenesis’s functional groups, by reducing methyl compounds with H2, Hydrogenotrophic methanogenesis, and methanogenesis, could be found in all the seagrass species samples collected from the Xisha Islands. However, none of the analyzed genera and detected functional groups showed both species differences and location differences.

2.5. Core Microbial Community in Seagrass Microbial Rhizosphere

The co-occurrence network method was used to explore the interaction between the rhizosphere microbes and to identify the keystone species. In all, 308 of 2405 OTUs were identified as core OTUs shared by all samples. They accounted for 12.81% of all obtained OTUs, and their relative abundance was 61.83% (Figure 4A). The core OTUs belonged to 14 phyla and 89 genera, and the predominant phyla were Proteobacteria (24.37%), Firmicutes (21.03%), and Bacteroidetes (3.37%). Afterward, 197 OTUs were selected for network analysis, and the correlation network was generated with a coefficient cutoff of 0.760, as determined by the RMT-based algorithm. There was a total of 773 edges (136 negative correlations and 637 positive correlations), and most of the correlation was positive (82.41%) (Figure 4B). In all, 19 modules were constructed, and the biggest module was Module 1, consisting of 58 OTUs, followed by Module 3 with 44 OTUs. The OTU 114 and OTU 1807 (phylum Proteobacteria) were identified as module hubs (OTU highly connected in the own module) in Figure S4. Modules with more than five OTUs were included for correlation analysis of module eigengenes and environmental factors. The modules’ responses to the environment were different, and Figure 4C showed that the measured physiochemical factors were significantly correlated with module eigengenes of Module 2, 3, and 5. TOC, ammonium, and nitrate were negatively correlated with Module 2 while positively correlated with Module 3. However, Module 1 and 4 were not significantly correlated with the environmental parameters.
Figure 4. The core community composition and its network analysis of the core microbial community of all seagrass rhizosphere microbial communities. (A) the core OTUs number and its relative abundance; (B) Modules (groups of OTUs) and only module more than five OTUs are shown with module numbers. The colored circles indicate those OTUs affiliated with phyla (the color code’s legend on the right). OTU114 and OTU1807 are module hubs. Black links represent positive correlations, and grey links represent negative correlations; (C) The correlations between five modules eigengenes and environmental factors (* indicates a statistically significant correlation: * p < 0.05, and ** p < 0.01).

3. Current Insights

3.1. Variations in the Taxonomical, Phylogenetical Diversity and Composition of Bacterial Communities

Significant variations in PD and taxonomical diversity of bacterial communities could be detected based on seagrass species within a coral reef ecosystem, but only significant variations in taxonomical diversity for the same seagrass species from different sampling locations (Table 2). Moreover, significant taxonomical and phylogenetic variations only existed among different seagrass species collected from the Xisha Islands. Therefore, the coral reef ecosystem’s seagrass species may be one important factor in shaping the rhizosphere bacterial communities.
We also found significant differences in the taxonomy composition of rhizosphere bacterial communities at the genus level based on different seagrass sampling locations. This was partly consistent with the investigation result of Cúcio et al. (2016) [8], the result of which demonstrated that significant differences were detected for the same seagrass species from different sampling locations, but no significant differences existed between the rhizobiomes of different seagrass species from the same sampling location. The reason for this phenomenon may be that different seagrass species were included in each study. Three different seagrass species, namely Z. marina, Z. noltii, and Cymodocea nodos, were studied for Cúcio et al. (2016) [8], while four seagrass species (C. nodos, T. hemprichii, H. ovalis, and S. isoetifolium) were examined in our investigation. Another reason for this discrepancy may be the different growth habits. The seagrass habitats for their study was in the intertidal regions, while all the seagrasses in this study were collected from the coral reef ecosystem [8]. Moreover, previous studies have highlighted the importance of temperature in constructing the rhizosphere bacterial community anwhich exhibited seasonal variations [15][16]. Therefore, there may also be seasonal variations in the seagrass rhizosphere bacterial community. More investigation on the temporal scale in the future needs to be performed.
Proteobacteria (class alpha-, beta-, delta-, gamma-, and epsilon-proteobacteria) and the Firmicutes were the two most predominant phyla across the four coral reef ecosystems. Besides, class Deltaproteobacteria accounted for over 20% of all investigated bacterial communities. Cúcio et al. (2016) also reported that the phylum Proteobacteria was the most dominant in the rhizomes of seagrass Z. marina, Z. noltii, and Cymodocea nodosa, with the proportion ranging from 65% to 68%. The existence of plants played a crucial role in shaping the microbial community in the rhizosphere of seagrasses as the seagrass rhizosphere bacterial community composition was quite different from that of the surrounding water and bulk sediment [8]. Besides, seagrass (Z. marina) colonization increased the abundance of the nitrogen fixation bacteria and other bacteria involved in benthic carbon and sulfur cycling [17].
Moreover, some OTUs were peculiar to one coral reef ecosystem, and each coral reef had its own individual OTUs in our study. For instance, OTU1109 was affiliated to class Phycisphaerae SHA-43 belonging to the phylum Planctomycetes and could only be discovered at XS. It may play an important role in the nitrogen cycle by participating in the anammox process, which was assumed as a predominant source of N2 production in anoxic marine environments [18][19][20]. Moreover, bacteria from the family Rhodothermaceae (phylum Bacteroidetes) were specially retrieved from Sanya Bay, and microorganisms from this family were usually isolated from the extreme environments and exhibited extreme thermophilic or halophilic characteristics [21][22].

3.2. The Functional Structure of Microbial Communities in Seagrass Rhizosphere

Seagrass holobionts have been reported to play essential roles in the cycle of sulfur, nitrogen, and carbon, at both microbial structural and functional levels [3][5], and Ugarelli et al. (2019) [23] reported that the seagrass plant and its microbiome were highly interlinked in the cycle of sulfur, nitrogen, and carbon. Likewise, FAPROTAX analysis revealed that many microbes in the seagrass rhizosphere of coral reef ecosystems participated in these processes (Figure S3).
Previous studies showed that increased sulfide concentration in the sediment caused by the activity of sulfate-reducing prokaryotes was one of the main reasons for seagrass death all over the world [3][5]. However, seagrass could oxygenate their roots [24] and lose radial oxygen in the rhizosphere of young roots to lower the concentration of sulfide to protect themselves [25]. What is more, sulfur-oxidizing bacteria in this ecosystem may also alleviate the sulfide stress for seagrass by oxidation of sulfide [26]. A higher abundance of genes was found to participate in the process of sulfur oxidation than sulfate reduction in the rhizosphere of the seagrass Z. marina [6]. We also found a high percentage of sulfate respiration (129 records) and respiration of sulfur compounds (131 records) in the FAPROTAX analysis result. This may indicate that microbes in the seagrass rhizosphere also play an important role in the sulfur-related cycle in the coral reef ecosystem.
Bioavailable nitrogen is crucial to all living organisms, but it is still a limiting nutrient globally [27]. The nitrogen enters the ecosystem from the air in the form of ammonia by the microbial nitrogen fixation, which is an essential link of the nitrogen cycle due to nitrogen usually acting as the limiting factor for productivity in the oligotrophic seagrass meadow and coral reef ecosystems [28]. Welsh et al. (2002) found that the microbes capable of sulfate-reducing are the significant component of the diazotrophs in many seagrass ecosystems [29]. Besides, the microbes involved in the nitrogen cycle, as revealed by FAPROTAX analysis in this study, mainly involved in the process of nitrification, aerobic ammonia oxidation, nitrate reduction, nitrate respiration, and nitrogen respiration.
Furthermore, the microbes conducted of nitrification activity mainly came from the genus Nitrosopumilus, Nitrososphaera, and Nitrospira. Nitrification is a process of oxidizing ammonia via nitrite to nitrate, which was assumed as a two-step process catalyzed by chemolithoautotrophic microorganisms before 2015 [30][31]. Daims et al. (2015) have reported that a completely nitrifying bacterium from the genus Nitrospira, which was present in diverse environments, and those findings confirmed that completely nitrifying Nitrospira played important roles in the nitrogen cycle-related microbial functional groups [31]. Although the ammonia available concentrations in most ocean waters are low, this is suitable for the living of comammox organisms. However, no comammox gene has been found in ocean waters until now. To explore microbes capable of comammox, a future research hotspot for environmental microbiologists is underway [27].
The diversity of carbon metabolism found in this study was very high, such as aerobic chemoheterotrophy, chemoheterotrophy, fermentation, aromatic compound degradation, photoautotrophy, methanogenesis, and methylotrophy (Figure S3). Many microbes of the phylum Planctomycetes were involved in the process of aerobic chemoheterotrophy. Like the genus Blastopirellula, a dominant chemoorganotrophic genus in the Black Sea sediments, are chemoheterotrophic [32][33], and their the major carbon and energy sources are carbohydrates [32]. Eight OTUs were detected in the methylotrophy from the genus Methanomassiliicoccus, unclassified Methylophilaceae, and Methylophaga, which accounted for 0.87% of all detected functional groups. Moreover, the putative methylotrophic bacteria, such as Methylotenera and Methylophaga, were more abundant in healthy seagrasses and could be used as indicators of seagrass health root microbiomes [34]. Besides, the microbes involved in sulfur-cycling, including sulfide-oxidizing (e.g., Candidatus Thiodiazotropha and Candidatus Electrothrix) and sulfate-reducing (e.g., SEEP-SRB1, Desulfomonile, and Desulfonema), were more abundant in stressed seagrass [34]. Hence, there is a need to investigate the relationship between the composition and functions of rhizosphere microbes and seagrass health.

3.3. The Core Microbial Community in Seagrass Rhizosphere across the Four Coral Reef Ecosystems

Identification of the core microbial community may provide the cues for understanding the key players in sustaining the growth and health of the seagrass, regardless of the seagrass species and locations. The taxonomy of the predominant core microbial community in this study was Desulfobulbaceae (phylum Proteobacteria), Bacillaceae 1 (phylum Firmicutes), Rhodobacteraceae (phylum Proteobacteria), and Streptococcaceae (phylum Firmicutes). While for seagrass Z. marina, Z. noltii, and Cymodocea nodosa [8], the core seagrass rhizobiome consisted of 0.2% of all OTUs, about 12.81% of all obtained OTUs were identified as core OTUs for the sample investigated in this study. The core microbial communities of different seagrass species and distributing locations may have different community composition and species specialty. The effect of the different environmental factors in the different sampling sites could one of the reasons contributing to this phenomenon [23].

References

  1. Fraser, M.W.; Gleeson, D.B.; Grierson, P.F.; Laverock, B.; Kendrick, G.A. Metagenomic Evidence of Microbial Community Responsiveness to Phosphorus and Salinity Gradients in Seagrass Sediments. Front. Microbiol. 2018, 9, 1703.
  2. Hurtado-McCormick, V.; Kahlke, T.; Petrou, K.; Jeffries, T.; Ralph, P.J.; Seymour, J.R. Regional and Microenvironmental Scale Characterization of the Zostera muelleri Seagrass Microbiome. Front. Microbiol. 2019, 10, 1011.
  3. Conte, C.; Rotini, A.; Manfra, L.; D’Andrea, M.M.; Winters, G.; Migliore, L. The Seagrass Holobiont: What We Know and What We Still Need to Disclose for Its Possible Use as an Ecological Indicator. Water 2021, 13, 406.
  4. Garcias-Bonet, N.; Eguiluz, V.M.; Diaz-Rua, R.; Duarte, C.M. Host-association as major driver of microbiome structure and composition in Red Sea seagrass ecosystems. Environ. Microbiol. 2021, 23, 2021–2034.
  5. Ugarelli, K.; Chakrabarti, S.; Laas, P.; Stingl, U. The Seagrass Holobiont and Its Microbiome. Microorganisms 2017, 5, 81.
  6. Cúcio, C.; Overmars, L.; Engelen, A.H.; Muyzer, G. Metagenomic Analysis Shows the Presence of Bacteria Related to Free-Living Forms of Sulfur-Oxidizing Chemolithoautotrophic Symbionts in the Rhizosphere of the Seagrass Zostera marina. Front. Mar. Sci. 2018, 5, 171.
  7. Mendes, R.; Garbeva, P.; Raaijmakers, J.M. The rhizosphere microbiome: Significance of plant beneficial, plant pathogenic, and human pathogenic microorganisms. FEMS Microbiol. Rev. 2013, 37, 634–663.
  8. Cúcio, C.; Engelen, A.H.; Costa, R.; Muyzer, G. Rhizosphere Microbiomes of European Seagrasses Are Selected by the Plant, But Are Not Species Specific. Front. Microbiol. 2016, 7, 440.
  9. Borum, J.; Pedersen, O.; Greve, T.M.; Frankovich, T.A.; Zieman, J.C.; Fourqurean, J.W.; Madden, C.J. The potential role of plant oxygen and sulphide dynamics in die-off events of the tropical seagrass, Thalassia testudinum. J. Ecol. 2005, 93, 148–158.
  10. Pedersen, M.F.; Borum, J. Nitrogen Dynamics of Eelgrass Zostera-Marina during a Late Summer Period of High Growth and Low Nutrient Availability. Mar. Ecol. Prog. Ser. 1992, 80, 65–73.
  11. Agawin, N.S.R.; Ferriol, P.; Sintes, E.; Moya, G. Temporal and spatial variability of in situ nitrogen fixation activities associated with the Mediterranean seagrass Posidonia oceanica meadows. Limnol. Oceanogr. 2017, 62, 2575–2592.
  12. Pereg, L.L.; Lipkin, Y.; Sar, N. Different Niches of the Halophila-Stipulacea Seagrass Bed Harbor Distinct Populations of Nitrogen-Fixing Bacteria. Mar. Biol. 1994, 119, 327–333.
  13. Brodersen, K.E.; Siboni, N.; Nielsen, D.A.; Pernice, M.; Ralph, P.J.; Seymour, J.; Kuhl, M. Seagrass rhizosphere microenvironment alters plant-associated microbial community composition. Environ. Microbiol. 2018, 20, 2854–2864.
  14. Shade, A.; Handelsman, J. Beyond the Venn diagram: The hunt for a core microbiome. Environ. Microbiol. 2012, 14, 4–12.
  15. Jia, X.; Li, X.D.; Zhao, Y.H.; Wang, L.; Zhang, C.Y. Soil microbial community structure in the rhizosphere of Robinia pseudoacacia L. seedlings exposed to elevated air temperature and cadmium-contaminated soils for 4 years. Sci. Total Environ. 2019, 650, 2355–2363.
  16. Li, J.; Luo, Z.; Zhang, C.; Qu, X.; Chen, M.; Song, T.; Yuan, J. Seasonal Variation in the Rhizosphere and Non-Rhizosphere Microbial Community Structures and Functions of Camellia yuhsienensis Hu. Microorganisms 2020, 8, 1385.
  17. Sun, F.; Zhang, X.; Zhang, Q.; Liu, F.; Zhang, J.; Gong, J. Seagrass (Zostera marina) Colonization Promotes the Accumulation of Diazotrophic Bacteria and Alters the Relative Abundances of Specific Bacterial Lineages Involved in Benthic Carbon and Sulfur Cycling. Appl. Environ. Microbiol. 2015, 81, 6901–6914.
  18. Spring, S.; Bunk, B.; Sproer, C.; Rohde, M.; Klenk, H.P. Genome biology of a novel lineage of planctomycetes widespread in anoxic aquatic environments. Environ. Microbiol. 2018, 20, 2438–2455.
  19. Zhang, X.L.; Zhang, Q.Q.; Yang, A.J.; Hou, L.J.; Zheng, Y.L.; Zhai, W.D.; Gong, J. Incorporation of Microbial Functional Traits in Biogeochemistry Models Provides Better Estimations of Benthic Denitrification and Anammox Rates in Coastal Oceans. J. Geophys. Res. Biogeosci. 2018, 123, 3331–3352.
  20. Zhang, Y.; Ling, J.; Yang, Q.; Wen, C.; Yan, Q.; Sun, H.; Van Nostrand, J.D.; Shi, Z.; Zhou, J.; Dong, J. The functional gene composition and metabolic potential of coral-associated microbial communities. Sci. Rep. 2015, 5, 16191.
  21. Jiang, Y.F.; Ling, J.; Wang, Y.S.; Chen, B.; Zhang, Y.Y.; Dong, J.D. Cultivation-dependent analysis of the microbial diversity associated with the seagrass meadows in Xincun Bay, South China Sea. Ecotoxicology 2015, 24, 1540–1547.
  22. Park, S.; Yoshizawa, S.; Kogure, K.; Yokota, A. Rubricoccus marinus gen. nov., sp nov., of the family ‘Rhodothermaceae’, isolated from seawater. Int. J. Syst. Evol. Microbiol. 2011, 61, 2069–2072.
  23. Ugarelli, K.; Laas, P.; Stingl, U. The Microbial Communities of Leaves and Roots Associated with Turtle Grass (Thalassia testudinum) and Manatee Grass (Syringodium filliforme) are Distinct from Seawater and Sediment Communities, but Are Similar between Species and Sampling Sites. Microorganisms 2019, 7, 4.
  24. Deng, Y.; Jiang, Y.H.; Yang, Y.F.; He, Z.L.; Luo, F.; Zhou, J.Z. Molecular ecological network analyses. BMC Bioinform. 2012, 13, 113.
  25. Brodersen, K.E.; Nielsen, D.A.; Ralph, P.J.; Kuhl, M. Oxic microshield and local pH enhancement protects Zostera muelleri from sediment derived hydrogen sulphide. New Phytol. 2015, 205, 1264–1276.
  26. Martin, B.C.; Bougoure, J.; Ryan, M.H.; Bennett, W.W.; Colmer, T.D.; Joyce, N.K.; Olsen, Y.S.; Kendrick, G.A. Oxygen loss from seagrass roots coincides with colonisation of sulphide-oxidising cable bacteria and reduces sulphide stress. ISME J. 2018, 13, 707–719.
  27. Kuypers, M.M. Microbiology: A division of labour combined. Nature 2015, 528, 487–488.
  28. Radecker, N.; Pogoreutz, C.; Voolstra, C.R.; Wiedenmann, J.; Wild, C. Nitrogen cycling in corals: The key to understanding holobiont functioning? Trends Microbiol. 2015, 23, 490–497.
  29. Welsh, D.T. Nitrogen fixation in seagrass meadows: Regulation, plant-bacteria interactions and significance to primary productivity. Ecol. Lett. 2000, 3, 58–71.
  30. van Kessel, M.A.; Speth, D.R.; Albertsen, M.; Nielsen, P.H.; Op den Camp, H.J.; Kartal, B.; Jetten, M.S.; Lucker, S. Complete nitrification by a single microorganism. Nature 2015, 528, 555–559.
  31. Daims, H.; Lebedeva, E.V.; Pjevac, P.; Han, P.; Herbold, C.; Albertsen, M.; Jehmlich, N.; Palatinszky, M.; Vierheilig, J.; Bulaev, A.; et al. Complete nitrification by Nitrospira bacteria. Nature 2015, 528, 504–509.
  32. Schlesner, H. Blastopirellula. In Bergey’s Manual of Systematics of Archaea and Bacteria; Wiley: Hoboken, NJ, USA, 2015; pp. 1–13.
  33. More, K.D.; Giosan, L.; Grice, K.; Coolen, M.J.L. Holocene paleodepositional changes reflected in the sedimentary microbiome of the Black Sea. Geobiology 2019, 17, 436–448.
  34. Martin, B.C.; Alarcon, M.S.; Gleeson, D.; Middleton, J.A.; Fraser, M.W.; Ryan, M.H.; Holmer, M.; Kilminster, K. Root microbiomes as indicators of seagrass health. FEMS Microbiol. Ecol. 2019, 96, fiz201.
More
Information
Subjects: Microbiology
Contributor MDPI registered users' name will be linked to their SciProfiles pages. To register with us, please refer to https://encyclopedia.pub/register :
View Times: 514
Revisions: 4 times (View History)
Update Date: 27 Aug 2021
1000/1000