 +1 credit
| Version | Summary | Created by | Modification | Content Size | Created at | Operation |
|---|---|---|---|---|---|---|
| 1 | Yogeswaran Lokanathan | + 6676 word(s) | 6676 | 2021-07-27 03:04:15 | | | |
| 2 | Bruce Ren | -21 word(s) | 6655 | 2021-07-27 11:30:33 | | |
Video Upload Options
Metabolic syndrome (MetS) is the physiological clustering of hypertension, hyperglycemia, hyperinsulinemia, dyslipidemia, and insulin resistance. The MetS-related chronic illnesses encompass obesity, the cardiovascular system, renal operation, hepatic function, oncology, and mortality. To perform pre-clinical research, it is imperative that these symptoms be successfully induced and optimized in lower taxonomy. Therefore, novel and future applications for a disease model, if proven valid, can be extrapolated to humans. MetS model establishment is evaluated based on the significance of selected test parameters, paradigm shifts from new discoveries, and the accessibility of the latest technology or advanced methodologies. Ultimately, the outcome of animal studies should be advantageous for human clinical trials and solidify their position in advanced medicine for clinicians to treat and adapt to serious or specific medical situations. Rodents (Rattus norvegicus and Mus musculus) have been ideal models for mammalian studies since the 18th century and have been mapped extensively.
1. Introduction
1.1. Metabolic Syndrome
1.2. Fructose as a Dietary Choice
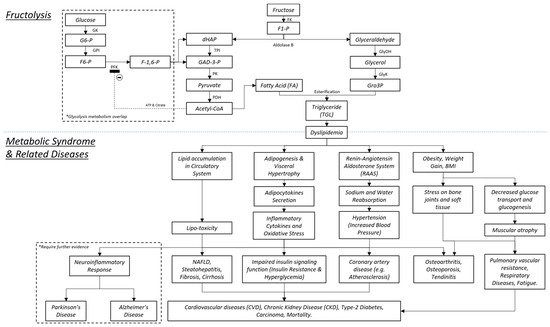
1.3. Fructolysis
1.4. The Bone and MetS
1.5. The Brain and MetS
2. Rodent Selection Criteria
2.1. Susceptibility of Specific Rodent Strains
2.2. Sex as a Limitation of MetS
| No. | Author and Year of Publication | Rodent Species/Subtype, Sex, Age, Weight Sample Size (n) * n/a = Undisclosed |
Fructose Dosage (Solution or Pellet) and MetS Induction Duration | Observed Physiological and Biochemical Parameters for Establishing MetS | Outcomes and Conflicts of Establishing MetS in Animal Model | Remarks and Implications of Study Outcomes |
|---|---|---|---|---|---|---|
| 1. | Zemančiková et al. (2016) [33] | Wistar rats and SHR
|
10% fructose solution for 8 weeks | Physiological: BW; SBP; relative weight of left heart ventricle (LVH), liver, kidney; abdominal fat (rWAT, mWAT, eWAT) Blood biochemistry: GLU, TGL |
BW and BP increased significantly in SHR, but not in Wistar rats. Both groups had increased liver weight, GLU, and TGL compared to respective controls | Comparative analysis of SHR to Wistar rats displayed better MetS prognosis in the former, denoting that species selection plays a vital role in being controlled or selected for modelling a disease |
| 2. | Rattanavichit et al. (2016) [34] | SD rats
|
10% fructose solution for 6 weeks | Physiological: BW, food and water intake, BP (SBP, DBP, MAP), wet weight (visceral fat and heart) Blood biochemistry: OGTT (plasma GLU and INS), TGL |
BW, tissue weight, food and water intake, and INS were significantly different between the sexes and respective controls. INS resistance was not induced in the skeletal muscles of the female and OVX rats, while it was impaired in the male rats | The presence of female reproductive organs (more specifically female hormones) prevented MetS development. Thus, sex needs to be a controlled variable to that ensure pathophysiological outcomes are not misrepresented. This is nullified if the study involves female-specific explorations |
| 3. | Hsieh et al. (2016) [35] | SD rats
|
60% fructose pellets for 16 weeks |
Physiological: BW, BP Blood biochemistry: OGTT (GLU and INS), TGL, CHOL, TBARS |
BW was visibly increased but was not statistically significantly different. However, BP, GLU, INS, TGL, CHOL, and TBARS increased significantly (p < 0.05) in comparison to rats on control chow diet | MetS establishment was successful despite missing BW results, cited as a component in MetS development |
| 4. | Lirio et al. (2016) [36] | Wistar rats and SHR
|
10% fructose solution for 6 weeks | Physiological: BW, BP, food and water intake, urine volume, organ weight (heart, lung, liver, kidney), abdominal fat mass (rWAT, mWAT, scWAT) Blood Biochemistry: IPGTT (GLU and INS), total CHOL, HDL, TGL, AST, ALT |
Both groups had increased fasting GLU and TGL levels. SHR had lower TGL levels; abdominal mass increased in Wistar rats, but not in SHR. ALT and AST were higher in SHR than in Wistar rats. Unexpectedly, SHR fasting GLU was slightly lower than in Wistar rats | Hyperglycemia, hypertriglyceridemia, and increased abdominal fat mass was comparatively more significant in the Wistar rat model versus the SHR model |
| 5. | Bargut et al. (2017) [20] | CB57BL/6 mice
|
46.43% fructose pellets for 3 weeks | Physiological: BW, BP, food and water intake, eWAT Blood biochemistry: OGTT, TGL, CHOL, INS, HOMA-IR, Adipo, LEP |
BP, TGL, CHOL, INS, HOMA-IR, and LEP were increased significantly; Adipo was decreased in the Hfru group compared to control group | Although physical aspects such as BW and fat mass were not statistically significantly differentiated, Hfru induced hypertension, hypertriglyceridemia, hypercholesterolemia, and INS resistance |
| 6. | Bratoeva et al. (2018) [52] | Wistar rats
|
35% fructose solution for 16 weeks | Physiological: BW, organ weight Blood biochemistry: GLU, TGL, TP, Urea, UA, CREA, electrolyte (Na and K), GSH, MDA, CRP |
BW, kidney weight, GLUC, TGL, MDA, GSH, UA, and CRP increased significantly | BW increased, hyperglycemia, hypertriglyceridemia, hyperuricemia, and oxidative stress were achieved. The addition of HOMA-IR could be considered, as INS resistance is a notable hallmark of MetS |
| 7. | Ramos et al. (2017) [37] | Wistar rats
|
20% fructose solution for 30, 60, and 90 days | Physiological: BW, food and water intake, energy intake, feed efficiency, fat mass (eWAT, mWAT, rWAT), total adipose mass Blood biochemistry: GLU, TGL |
Increased BW, fat mass, TGL levels. Total fat mass and eWAT and rWAT deposits were significantly greater in the fructose-fed groups Food and water intake were lower in the Hfru group upon the induction period |
Overall, Hfru induced increased BW and adipogenesis, and hypertriglyceridemia Only hyperglycemia was not achieved |
| 8. | Abdelrahman et al. (2018) [21] | Wistar rats
|
60% fructose pellets for 5 weeks | Physiological: BW, BW change, water intake, urine output, BP, heart rate, weight of abdominal aorta Blood biochemistry: GLU, INS, HOMA-IR, TGL, CHOL, HDL, LDL, UA |
Water intake and output decreased significantly. Fructose diet incited hypertension, hyperinsulinemia, hypertriglyceridemia, and hypercholesterolemia | MetS was successfully induced in the model, with the exception of BW, which was maintained throughout the experimental phase |
| 9. | Ng et al. (2018) [38] | SD rats
|
60% fructose pellets for 3 and 5 months (FR-3 and FR-5, respectively) | Physiological: BW, tissue weight, BP, urine output Blood biochemistry: Plasma GLU, UA, CHOL, TGL, CREA, electrolytes (Na and K) |
BW and UA were significantly higher in both FR-3 and FR-5 as compared to the control only. BP, UA, TGL, and CHOL were higher in FR-5 compared to FR-3 and the control. Conversely, fasting GLU was higher at 3 months than 5 months | Overall, fructose feeding enabled increased BP and proteinuria, but only hypercholesterolemia was significant by 5 months. This study highlights the importance of the duration in inducing MetS to be acceptably significant for research purposes. In comparison to other studies, this duration is deemed overtly lengthy, possibly allowing age to be a confounding factor in MetS development |
| 10. | Chen et al. (2018) [39] | SD rats
|
60% fructose pellet for 9 weeks | Physiological: BW, BP Blood biochemistry: Plasma GLU, INS, CHOL, TGL |
Fructose-fed rats exhibited increased BW, GLUC, and BP (p < 0.01). Similarly, INS, CHOL, and TGL levels increased significantly (p < 0.001) | Long-term 9-week feeding induced significant levels of obesity, hyperglycemia, hyperinsulinemia, hypertension, and hyperlipidemia |
| 11. | Gambaro et al. (2018) [22] | Swiss mice
|
20% fructose solution for 6 and 10 weeks | Physiological: BW, food and water intake, BP, adipose tissue weight (iWAT, eWAT, rWAT), liver weight Blood biochemistry: GLU, OGTT, AUC, TGL, LEP, ALT, AST |
During both durations, BW, AUC, TGL, and LEP were significantly increased; food intake decreased. Hfru plasma LEP and only ALT were significantly higher at 10 weeks than 6 weeks | Food intake was superseded despite being decreased, as Hfru would have larger feed efficiency due to a hypercaloric diet. The results of induction were substantially reliable by week 10. Hyperglycemia was not achieved in either induction period when compared to the control |
| 12. | Subramani et al. (2019) [40] | SD rats
|
66% Hfru pellets for 6 weeks | Physiological: BW, body length, BMI, BP Blood biochemistry: Fasting GLU, serum lipid profile (CHOL, TGL, HDL, LDL) |
After 6 weeks, Hfru feeding increased BMI, GLU, MAP, TGL, CHOL, and LDL compared to the control. Expectedly, HDL decreased compared to the control | Hfru feeding successfully induced weight gain, hypertension, hyperglycemia, and hyperlipidemia |
| 13. | Fakhoury-Sayegh et al. (2019) [23] | Wistar rats
|
10%, 20%, and 30% fructose pellets for 16 weeks | Physiological: BW, food intake, energy intake, organ weight (liver, kidney, pancreas, eWAT) Blood biochemistry: Fasting GLU, INS, TGL, ALT, AST |
After 16 weeks, serum GLU increased in Hfru groups compared to the control. AST decreased in 20% and 30% Hfru groups only but INS levels were increased in the 10% Hfru group. ALT only increased in the control and 10% Hfru groups | This study utilized the lowest concentrations of fructose in pellet diet paired with the longest induction duration to establish the minimum threshold for NAFLD, a MetS-related disease. For a long-term study, this may perhaps be applicable, but in most studies, it is desirable to achieve effects in an optimal duration |
| 14. | Zhang et al. (2020) [48] | C57BL/6J, DBA/2 J (DBA), FVB/NJ (FVB) mice
|
8% fructose solution for 12 weeks | Physiological: BW; food intake; caloric intake; organ weight (hypothalamus and liver); lean and fat mass of rWAT, mWAT, and scWAT. Blood biochemistry: IPGTT, plasma INS, GLU, lipids |
Only DBA mice gained significant BW, fat mass, and fat mass percentage; percentage of lean mass was decreased (increased fat mass ratio); rWAT, mWAT and scWAT weight was increase; GLU homeostasis levels were impaired compared to the C57BL/6J and FVB mice. Plasma INS was significantly elevated in DBA and FVB mice. All groups had increased fructose/water intake and decreased food intake but maintained caloric intake | This study elucidated the comparison between M. musculus strains; the final outcome was that DBA mice demonstrated greater susceptibility to chronic fructose ingestion than a SHR model. |
| 15. | Mustafa et al. (2020) [41] | SD rats
|
20% (F20%) and 40% fructose (F40%) solution for 6 weeks | Physiological: BW, body length, abdominal circumference, BMI Blood biochemistry: GLU, INS, HOMA-IR, TP, Alb, Gb, urea, CREA, ALT, AST, BIL, lipid profile (TGL, VLDL, HDL, LDL) |
BW, BW gained (%), and BMI were statistically significantly increased compared to the control. Urea and CREA were increased significantly in the F40% group only. AST, BIL, TGL, and HDL were reduced; VLDL and LDL were increased significantly compared to the control | The MetS diet-induced model was successful through 40% fructose solution for 6 weeks while 20% fructose solution was insufficient. The animal model demonstrated insulin resistance, obesity, dyslipidemia, metabolic imbalance, and inflammation |
| 16. | Ferreira-Santos et al. (2020) [46] | Wistar rats
|
20% fructose solution for 12 weeks | Physiological: BW, caloric intake, organ weight (heart, liver, abdominal fat, mesenteric, aorta artery), tibia length, SBP Blood biochemistry: OGTT, fasting blood GLU, INS, AUC, HOMA-IR, lipid profile (TGL CHOL, HDL, LDL), AST, ALT |
SBP, GLUC, AUC, INS, HOMA-IR, abdominal fat mass, TGL, CHOL, ALT, AST, and BMI were increased significantly in the fructose group compared to the control | The Wistar model struggled to gain physical weight although increased organ weight, fat mass accumulation, hyperglycemia, dyslipidemia, and inflammation were achieved |
| 17. | Kitagawa et al. (2020) [47] | Wistar rats
|
60% fructose pellets for 2, 4, and 6 weeks | Physiological: BW, organ weight (liver, kidney, heart, biceps femoris, eWAT) Blood biochemistry: HOMA-IR (GLU and INS), TGL, CHOL, FFA |
HOMA-IR, TGL, CHOL, and FFA increased during week 2 and continued the increasing trajectory during week 4 and further by 6 weeks of feeding | Weight gain and hyperglycemia were not achieved. However, IR, hyperinsulinemia, and dyslipidemia were achieved in this animal model |
| 18. | Kim et al. (2020) [42] | SD rats
|
20% fructose solution for 2 weeks | Physiological: BW, food intake, water intake, BP, urine volume Blood biochemistry: GTT (fasting GLU, AUC), TGL, CHOL |
BW, daily water intake, BP, GLUC, AUC, and water retention increased significantly after 2 weeks of 20% fructose. Urine volume was decreased compared to the control | The SD rat model achieved MetS. However, the food and water intake did not differ. The 2-week induction duration is considerably short and may be a factor |
3. Test Parameter Optimization and Selection
3.1. Physiological and Biochemical Parameters
3.2. Additional Parameters of MetS-Related Diseases
| No. | First author, Year of Publication, and Main Study Objective (Cardiac, Diabetes, Bone, Cancer) |
Additional Biological Parameters (Inflammatory Markers, Genes, Proteins) |
Outcomes of Additional Biological Parameters |
|---|---|---|---|
| 1. | Zemančiková et al. (2016) [33] MetS and cardiovascular function |
Isometric tension endothelium-dependent vasorelaxation, adrenergic contractions in endothelium-intact mesenteric arteries | Impaired relaxation of the aorta in both SHR and Wistar rats but not in nitric oxide (NO)-deficient Wistar rats. Diminution of adrenergic contractions was observed in SHR mesenteric arteries, but not in the Wistar rat counterparts. Contractile response in K+ concentrated bath solution was not altered between groups |
| 2. | Rattanavichit et al. (2016) [34] MetS and ovarian hormone function |
Wet weight of uterus and skeletal muscle (soleus). INS-mediated muscle GLU transport activity. Analysis of signaling elements in skeletal muscle (IRS-1 Tyr989, IRS-1 Ser307, Akt Ser451, AS160 Ser588, JNK Thr183/Tyr185, p38 MAPK Thr180/Tyr182) | INS resistance was not induced in the skeletal muscles of non-OVX and OVX female rats, while male rats exhibited the following changes:
|
| 3. | Hsieh et al. (2016) [35] MetS and liver function |
2D gel-based proteomics. MALDI-TOF/MS-MS to identify hepatic protein expression patterns in rat liver | Analysis identified proteins that were:
|
| 4. | Lirio et al. (2016) [36] MetS and NAFLD |
Histology of liver tissue | There was interstitial fat deposition and fibrosis in the liver of SHR only |
| 5. | Bargut et al. (2017) [20] MetS and WAT |
Histology of eWAT (adipocyte area), RT-qPCR, Western blotting | Hfru-treated rats displayed adipocyte area increase by 21%, implying hypertrophy, inflammation, and uncontrolled lipolysis compared to control groups Inflammatory markers:
|
| 6. | Bratoeva et al. (2018) [52] MetS and renal function |
Histological study of the kidney | Proximal and distal section of the tubular region revealed signs of vacuolization and degeneration, respectively. Vascular rupture, scarring, and atherosclerotic manifestations were apparent, but not in the control. The glomeruli and subendothelial layers of blood vessels had nodule formation, shown by positive amyloid stains. These traits show the loss of glomeruli function and vascular deterioration that matched MetS symptoms |
| 7. | Ramos et al. (2017) [37] MetS |
No additional parameters were observed | No additional findings were made |
| 8. | Abdelrahman et al. (2018) [21] MetS and inflammatory and oxidative markers |
Inflammatory markers, oxidative stress and NO in fructose-fed rats: Aortic endothelin-1, plasma and aortic NO, plasma TNF-α, IL-6, plasma superoxide dismutase (SOD), plasma catalase, plasma MDA. Abdominal aorta removed and weighed | When compared to the control, the Hfru group displayed significant levels of:
|
| 9. | Ng et al. (2018) [38] MetS and renal function |
Gene expression study and immunohistochemistry of the liver and kidney | The FR-5 group expressed lower GLUT1, compensated by increased GLUT2 and GLUT9 compared to the FR-3 group. Both groups had equally increased SGLT1, SGLT2, renal UA expression, and FA deposition. Increased GLUT9 and UA are correlated to signs of hyperuricemia; SGLT1:SGLT2 imbalance is identified as ineffective sodium–glucose reabsorption function of the kidney. These findings also describe the loss of INS function compensated by SGLT2 INS-independent function of GLU reabsorption |
| 10. | Chen et al. (2018) [39] MetS and bladder function |
Rat bladder was processed into individual muscle strips for organ bath pharmacological studies. RT-PCR and Western blot analysis of bladder control via genetic and protein expressions of cannabinoid receptor (CB)1/CB2 receptors | Acetylcholine bladder muscle strip contraction showed statistically insignificant differences between Hfru and control groups. Western blotting showed decreased CB1/CB2 protein levels following MetS diet induction. Similarly, RT-PCR showed that CB1/CB2 mRNA was decreased significantly in the fructose group. These outcomes signify the loss of the homeostatic role of CB1 and CB2, affecting the parasympathetic stimulus for bladder function, as observed in the MetS model |
| 11. | Gambaro et al. (2018) [22] MetS and adipocyte function |
Metabolic mRNA analysis of adipose tissue. Histological analysis of adipose tissue | In both periods (6 and 10 weeks), there was increased eWAT; decreased adiponectin, IL-6, IL-10, TNF-α, CD206; and hypertrophy and parenchymatous degeneration of hepatocytes. Only the 10-week group had decreased Il-10 and Il-1b, with instances of lipid accumulation foci in histological sections compared to the 6-week group. These findings show that the accumulation of fat mass increased proportionally to the feeding duration. It stimulated inflammatory macrophages (M1) and decreased the anti-inflammatory response, leading to liver damage and loss of function in the diet-induced MetS model |
| 12. | Subramani et al. (2019) [40] MetS |
Oxidative stress measurement (TBARS, SOD). Rat nuclear factor kappa B (NF-κB). Histopathology of the liver and heart | The Hfru group had significantly increased TBARS and decreased SOD but non-significantly increased NF-κB compared to the control diet groups. The Hfru group had fatty infiltration, with micro- and macrovesicular hepatic steatosis and hypertrophied heart compared to the control groups. These results show the effect of MetS that leads to a hypertrophic heart to circulate and compensate for atherosclerosis and other loss of function. Fructose feeding accumulated fatty deposition and ROS and inflammatory cytokine secretion, leading to dyslipidemia of the liver |
| 13. | Fakhoury-Sayegh et al. (2019) [23] MetS with hepatic, renal, and pancreatic function |
Oxidative stress (MDA). Serum adiponectin levels. Inflammatory markers (TNF-α and IL-6). Histopathology examinations of the liver, kidney, pancreas, and epididymal fat pads | Adiponectin levels decreased in group 2 and 3 (20% and 30% Hfru, respectively). MDA levels decreased in all groups except group 2. TGL, TNF-α, and IL-6 were not significant between the fructose groups and control after 16 weeks. The control and group 2 and 3 had minor signs of microvesicular steatosis. Only group 4 (30% Hfru) presented milder microvacuolar steatosis. Necroinflammation and fibrosis were absent from all groups, but perisinusoidal fibrosis was apparent (>20%) in group 3 and 4. Group 3 and 4 kidneys showed mild renal inflammation (>60%) and lower glomerulosclerosis and interstitial renal fibrosis. The pancreas did not show hyperplasia or hypertrophy of the islets of Langerhans. Islet distribution, size, and shape were not altered or fibrotic. After 16-week Hfru intervention, the onset of liver fibrosis and kidney failure were proportional to Hfru dosage. INS function and histopathology of the pancreas were unchanged, thus remaining functional |
| 14. | Zhang et al. (2020) [48] MetS and genetically different M. musculus strains |
RNA sequencing of the hypothalamus, liver, and mWAT to determine the key drivers in liver function to validate strain individuality properties. Subsequently, deduce differentially expressed genes (DEGs) in the hypothalamus, liver, and WATs | Strain-specific DEGs were discovered, as DBA mice represented the largest volumes in all three tissues for lipid metabolism. However, some overlapping DEGs did not show strain specificity but were affected by fructose metabolism. The categories were:
|
| 15. | Mustafa et al. (2020) [41] MetS |
No additional parameters were observed | No additional findings were made |
| 16. | Ferreira-Santos et al. (2020) [46] MetS |
Morphometric determinations (LVH, liver, adiposity measurement). Histological studies (liver and rWAT). Vascular reactivity. Oxidative stress (superoxide anion and lipid peroxidation) | LVH, liver index, oxidative stress, and adiposity increased significantly in the fructose group compared to the control. Histological staining showed morphological alterations in hepatocytes and adipocytes. The liver of fructose-fed rats had lipid accumulation. Endothelial dysfunction manifested from the reduced relaxation in response to acetylcholine (Ach) in the aortic and mesenteric rings of the fructose group. A Hfru diet facilitated liver steatosis and hypertension due to stiff endothelial contraction and lipid-derived oxidative damage to metabolic organs |
| 17. | Kitagawa et al. (2020) [47] MetS |
Serum vitamin E; relative vitamin E and lipid peroxide (LPO) concentrations of the heart, liver, kidney, skeletal muscle (SM); WAT | Liver, kidney, heart, and SM vitamin E content were significantly higher in the fructose group than in the control by 2 weeks. However, vitamin E in WAT was significantly lower in the fructose group, which continued on a downward trend until 6 weeks. Heart, WAT, and liver LPO increased and achieved statistical significance by 6 weeks. Vitamin E plays a pivotal role in antioxidative responses, which was hampered by MetS induced by a Hfru diet. This accrued damage in the heart, liver, and organs surrounded by WAT |
| 18. | Kim et al. (2020) [42] MetS and adrenal function |
Hormone levels (serum renin, angiotensin [Ang] II, aldosterone). Histological analysis of the kidney and adrenal gland. RT-qPCR (Ren, At1ar, At1br, Ace, At2, Agt, Gapdh) | Serum levels of renin and Ang II were significantly elevated by fructose supplementation. Fructose intake increased expression of Agt in the liver and Ace in the lungs. Fructose intake increased AT1R and Ang I protein levels in the kidney. Histological examination showed no significant effect on collagen deposition and fibrosis, which would have appeared blue upon trichrome staining. The fluctuation of the adrenal metabolites above affected the lung, kidney, and liver functions. Hence, the fructose diet disrupted pulmonary, hepatic, and renal function by altering the adrenal maintenance of vascular properties crucial for biochemical homeostasis and nutrient supplementation |
| Duration of MetS Induction (weeks) | References of Study(s) | Physiological and Biochemical Parameters of MetS | ||||||
|---|---|---|---|---|---|---|---|---|
| Increased BW, Length or Abdominal Circumference |
Increased Organ or Tissue Mass |
Increased Caloric Intake (Hyperphagia, Hyperleptinemia) |
High Blood Pressure (Hypertension) |
High Blood Glucose Levels (Hyperglycemia) |
Dyslipidemia (Hypertriglyceridemia, Hypercholesterolemia) | Hyperinsulinemia or Insulin Resistance |
||
| 2 | [42][47] | / | / | X | O | O | O | / |
| 3 | [20] | X | X | O | / | O | / | / |
| 4 | [37][47] | / | O | O | O | O | / | / |
| 5 | [21] | X | O | O | / | O | / | / |
| 6 | [22][34][36][40][41][47] | / | / | / | / | / | / | / |
| 8 | [33][37] | / | / | O | / | / | / | / |
| 10 | [22] | / | O | O | O | X | / | / |
| 12 | [37][38][48][46] | / | / | X | O | X | O | / |
| 13 | [38] | / | O | O | / | O | / | O |
| 16 | [23][35][52] | X | X | X | / | / | / | / |
| 21 | [38] | / | / | O | O | X | / | O |
| Conc. of Fructose (%) | References of Study(s) | Physiological and Biochemical Parameters of MetS | |||||||
|---|---|---|---|---|---|---|---|---|---|
| Solution | Pellet | Increased BW, Length or Abdominal Circumference |
Increased Organ or Tissue Mass |
Increased Caloric Intake (Hyperphagia, Hyperleptinemia) |
High Blood Pressure (Hypertension) |
High Blood Glucose Levels (Hyperglycemia) |
Dyslipidemia (Hypertriglyceridemia, Hypercholesterolemia) |
Hyperinsulinemia or Insulin Resistance | |
| 8 | [48] | - | / | / | X | O | X | O | O |
| 10 | [33][34][36] | [23] | / | O | / | / | O | / | / |
| 20 | [22][37] | [23] | / | / | X | O | O | / | O |
| 30 | - | [23] | X | X | X | O | / | / | / |
| 40 | [41] | - | / | O | O | O | / | / | / |
| 45.43 | - | [20] | X | X | O | / | O | / | / |
| 60 | - | [21][35][38][39][40][47] | X | / | / | / | / | / | / |
| 66 | - | [40] | / | O | O | / | / | / | O |
4. Duration and Dosage of High-Fructose Diet
4.1. Period of MetS Induction in Animal Models
4.2. Concentration of Fructose Diet for Inducing MetS
References
- Vague, J.; Jouve, A.; Delaage, M.; Teitelbaum, M. Les Relations de L’obesite et de L’arteriosclerose; Documentation scientifique Guigoz: Basel, Germany, 1958; Volume 41, pp. 1–20.
- Haller, H.; Hanefeld, M. Synoptische Betrachtung Metabolischer Risikofaktoren. In Lipidstoffwechselstörungen; Haller, H., Hanefeld, M., Jaross, W., Eds.; Gustav Fischer Verlag: Jena, Germany, 1975; pp. 254–264.
- World Health Organization: Obesity and Overweight. April 2020. Available online: (accessed on 18 January 2021).
- International Diabetes Federation: Diabetes Facts and Figures. 2 February 2020. Available online: (accessed on 18 January 2021).
- Li, Y.; Zhao, L.; Yu, D.; Wang, Z.; Ding, G. MetS prevalence and its risk factors among adults in China: A nationally representative cross-sectional study. PLoS ONE 2018, 13, e0199293.
- Cordain, L.; Eaton, S.B.; Sebastian, A.; Mann, N.; Lindeberg, S.; Watkins, B.A.; O’Keefe, J.H.; Brand-Miller, J. Origins and evolution of the Western diet: Health implications for the 21st century. Am. J. Clin. Nutr. 2005, 81, 341–354.
- Roche, H.M.; Phillips, C.; Gibney, M.J. The MetS: The crossroads of diet and genetics. Proc. Nutr. Soc. 2005, 64, 371–377.
- Punthakee, Z.; Goldenberg, R.; Katz, P. Definition, Classification and Diagnosis of Diabetes, Prediabetes and MetS. Can. J. Diabetes 2018, 42, S10–S15.
- Carvajal, K.; Rodríguez-Correa, E.; González-Pérez, I.; Clavel-Pérez, P.I.; Contreras-Vargas, Y. Biochemical and nutritional overview of diet-induced MetS models in rats: What is the best choice? Nutr. Diabetes 2020, 10, 24.
- Fontvieille, A.M.; Faurion, A.; Helal, I.; Rizkalla, S.W.; Falgon, S.; Letanoux, M.; Slama, G. Relative Sweetness of Fructose Compared With Sucrose in Healthy and Diabetic Subjects. Diabetes Care 1989, 12, 481–486.
- Bantle, J.P. Dietary Fructose and MetS and Diabetes. J. Nutr. 2009, 139, 1263S–1268S.
- Zargaraan, A.; Kamaliroosta, L.; Seyed Yagoubi, A.; Mirmoghtadaie, L. Effect of Substitution of Sugar by High Fructose Corn Syrup on the Physicochemical Properties of Bakery and Dairy Products: A Review. Nutr. Food Sci. Res. 2016, 3, 3–11.
- Avena, N.M.; Rada, P.; Hoebel, B.G. Evidence for sugar addiction: Behavioral and neurochemical effects of intermittent, excessive sugar intake. Neurosci. Biobehav. Rev. 2008, 32, 20–39.
- Hannou, S.A.; Haslam, D.E.; McKeown, N.M.; Herman, M.A. Fructose metabolism and metabolic disease. J. Clin. Investig. 2018, 128, 545–555.
- Kolderup, A.; Svihus, B. Fructose Metabolism and Relation to Atherosclerosis, Type 2 Diabetes, and Obesity. J. Nutr. Metab. 2015, 2015, 823081.
- Tappy, L.; Rosset, R. Health outcomes of a high fructose intake: The importance of physical activity. J. Physiol. 2019, 597, 3561–3571.
- Sanders, F.W.B.; Griffin, J.L. De novolipogenesis in the liver in health and disease: More than just a shunting yard for glucose. Biol. Rev. 2019, 91, 452–468.
- Herman, M.A.; Samuel, V.T. The Sweet Path to Metabolic Demise: Fructose and Lipid Synthesis. Trends Endocrinol. Metab. 2016, 27, 719–730.
- Rizkalla, S.W. Health implications of fructose consumption: A review of recent data. Nutr. Metab. 2010, 7, 82.
- Bargut, T.C.L.; Santos, L.P.; Machado, D.G.L.; Aguila, M.B.; Mandarim-de-Lacerda, C.A. Eicosapentaenoic acid (EPA) vs. Docosahexaenoic acid (DHA): Effects in epididymal white adipose tissue of mice fed a high-fructose diet. Prostaglandins Leukot. Essent. Fat. Acids (PLEFA) 2017, 123, 14–24.
- Abdelrahman, A.M.; Al-Suleimani, Y.M.; Ashique, M.; Manoj, P.; Ali, B.H. Effect of infliximab and tocilizumab on fructose-induced hyperinsulinemia and hypertension in rats. Biomed. Pharmacother. 2018, 105, 182–186.
- Gambaro, S.; Zubiria, M.; Portales, A.; Rey, M.; Rumbo, M.; Giovambattista, A. M1 macrophage subtypes activation and adipocyte dysfunction worsen during prolonged consumption of a fructose rich diet. J. Nutr. Biochem. 2018, 61, 173–182.
- Fakhoury-Sayegh, N.; Trak-Smayra, V.; Sayegh, R.; Haidar, F.; Obeid, O.; Asmar, S.; Khazzaka, A. Fructose threshold for inducing organ damage in a rat model of non-alcoholic fatty liver disease. Nutr. Res. 2018, 62, 101–112.
- Zhou, J.; Zhang, Q.; Yuan, X.; Wang, J.; Li, C.; Sheng, H.; Qu, S.; Li, H. Association between Metabolic Syndrome and osteoporosis: A meta-analysis. Bone 2013, 57, 30–35.
- Wong, S.K.; Chin, K.Y.; Suhaimi, F.H.; Ahmad, F.; Ima-Nirwana, S. Effects of Metabolic Syndrome on bone mineral density, histomorphometry and remodelling markers in male rats. PLoS ONE 2018, 13, e0192416.
- Wong, S.K.; Chin, K.Y.; Suhaimi, F.H.; Ahmad, F.; Ima-Nirwana, S. The Relationship between Metabolic Syndrome and Osteoporosis: A Review. Nutrients 2016, 8, 347.
- Chin, K.Y.; Chan, C.Y.; Subramaniam, S.; Muhammad, N.; Fairus, A.; Ng, P.Y.; Jamil, N.A.; Aziz, N.A.; Ima-Nirwana, S.; Mohamed, N. Positive association between Metabolic Syndrome and bone mineral density among Malaysians. Int. J. Med. Sci. 2020, 17, 2585–2593.
- Chow, Y.Y.; Chin, K.Y. The Role of Inflammation in the Pathogenesis of Osteoarthritis. Mediat. Inflamm. 2020, 2020, 8293921.
- Nur-Vaizura, M.; Soelaiman, I.M.; Chin, K.Y. Are oxidative stress and inflammation mediators of bone loss due to estrogen deficiency? A review of current evidence. Endocr. Metab. Immune Disord. Drug Targets 2020, 20, 1478–1487.
- Hoyer, S. The aging brain. Changes in the neuronal insulin/insulin receptor signal transduction cascade trigger late-onset sporadic Alzheimer disease (SAD). A Mini-Review. J. Neural Transm. 2002, 109, 991–1002.
- Moreira, P.I.; Santos, M.S.; Seiça, R.; Oliveira, C.R. Brain mitochondrial dysfunction as a link between Alzheimer’s disease and diabetes. J. Neurol. Sci. 2007, 257, 206–214.
- Zhou, C.; Huang, Y.; Przedborski, S. Oxidative Stress in Parkinson’s Disease. Ann. N. Y. Acad. Sci. 2008, 1147, 93–104.
- Zemančiková, A.; Torok, J. Comparison of high fructose-induced cardiometabolic impairments in two different rat hypertensive models. Curr. Top. Toxicol. 2016, 12, 25–32.
- Rattanavichit, Y.; Chukijrungroat, N.; Saengsirisuwan, V. Sex differences in the metabolic dysfunction and insulin resistance of skeletal muscle glucose transport following high fructose ingestion. Am. J. Physiol. -Regul. Integr. Comp. Physiol. 2016, 311, R1200–R1212.
- Hsieh, C.C.; Liao, C.C.; Liao, Y.C.; Hwang, L.S.; Wu, L.Y.; Hsieh, S.C. Proteomic changes associated with Metabolic Syndromein a fructose-fed rat model. J. Food Drug Anal. 2016, 24, 754–761.
- Lírio, L.M.; Forechi, L.; Zanardo, T.C.; Batista, H.M.; Meira, E.F.; Nogueira, B.V.; Mill, J.G.; Baldo, M.P. Chronic fructose intake accelerates non-alcoholic fatty liver disease in the presence of essential hypertension. J. Diabetes Its Complicat. 2016, 30, 85–92.
- Ramos, V.W.; Batista, L.O.; Albuquerque, K.T. Effects of fructose consumption on food intake and biochemical and body parameters in Wistar rats. Efeitos do consumo de frutose sobre ingestão alimentar, parâmetros bioquímicos e corporais em ratos Wistar. Revista portuguesa de cardiologia: Orgao oficial da Sociedade Portuguesa de Cardiologia = Portuguese journal of cardiology: An official journal of the Portuguese Society of Cardiology. Rev. Port Cardiol. 2017, 36, 937–941.
- Ng, H.Y.; Lee, Y.T.; Kuo, W.H.; Huang, P.C.; Lee, W.C.; Lee, C.T. Alterations of Renal Epithelial Glucose and Uric Acid Transporters in Fructose Induced Metabolic Syndrome. Kidney Blood Press. Res. 2018, 43, 1822–1831.
- Chen, I.H.; Cheng, J.T.; Tong, Y.C. Metabolic Syndrome Induced Bladder Cannabinoid Receptor Changes in the Fructose-Fed Rats. LUTS Low. Urin. Tract Symptoms 2017, 10, 198–203.
- Subramani, B.; Krishnamurthy, B. Effects of Momordica Charantia (Bitter gourd) on Oxidative Stress and Pro-Inflammatory Marker in Metabolic Syndrome Using a High-Fructose Diet Induced Rat Model. Biomed. Pharmacol. J. 2019, 11, 305–324.
- Mustafa, N.G.; Hasan, M.K. Biochemical investigation of an experimentally induced Metabolic Syndrome in rats. Indian J. Anim. Res. 2020, 52, 168–172.
- Kim, M.; Do, G.Y.; Kim, I. Activation of renin-angiotensin system in high fructose-induced Metabolic Syndrome. Korean J. Physiol. Pharmacol. 2020, 24, 319–328.
- Marques, C.; Meireles, M.; Norberto, S.; Leite, J.; Freitas, J.; Pestana, D.; Faria, A.; Calhau, C. High-fat diet-induced obesity Rat model: A comparison between Wistar and Sprague Dawley Rat. Adipocyte 2015, 5, 11–21.
- Giles, E.D.; Jackman, M.R.; MacLean, P.S. Modeling Diet-Induced Obesity with Obesity-Prone Rats: Implications for Studies in Females. Front. Nutr. 2016, 3, 50.
- Rojas, J.M.; Bolze, F.; Thorup, I.; Nowak, J.; Dalsgaard, C.M.; Skydsgaard, M.; Berthelsen, L.O.; Keane, K.A.; Søeborg, H.; Sjögren, I.; et al. The Effect of Diet-induced Obesity on Toxicological Parameters in the Polygenic Sprague Dawley Rat Model. Toxicol. Pathol. 2018.
- Ferreira-Santos, P.; Aparicio, R.; Carrón, R.; Montero, M.J.; Sevilla, M.Á. Lycopene-supplemented diet ameliorates MetS induced by fructose in rats. J. Funct. Foods 2020, 73, 104098.
- Kitagawa, A.; Ohta, Y.; Ohashi, K.; Yashiro, K.; Fukuzawa, K. Effect of High Fructose-Induced Metabolic Syndrome on Tissue Vitamin E and Lipid Peroxide Levels in Rats. J. Nutr. Sci. Vitaminol. 2020, 66, 200–206.
- Zhang, G.; Byun, H.R.; Ying, Z.; Blencowe, M.; Zhao, Y.; Hong, J.; Shu, L.; Krishnan, K.C.; Gomez-Pinilla, F.; Yang, X. Differential metabolic and multi-tissue Transcriptomic responses to fructose consumption among genetically diverse mice. Biochim. Biophys. Acta (BBA) Mol. Basis Dis. 2019, 1866, 165569.
- Leeners, B.; Geary, N.; Tobler, P.N.; Asarian, L. Ovarian hormones and obesity. Hum. Reprod. Update 2017, 23, 300–321.
- Zhu, J.; Ji, M.; Xing, L.; Yu, Z.; Guo, X.; Chen, X.; Shu, J. Ovarian Hormonal Change-Related Energy Metabolism and Obesity in Menopausal Women. Horm. Ther. Replace. Cancer Aging-Relat. Dis. 2020.
- Boonyaratanakornkit, V.; Pateetin, P. The Role of Ovarian Sex Steroids in Metabolic Homeostasis, Obesity, and Postmenopausal Breast Cancer: Molecular Mechanisms and Therapeutic Implications. BioMed Res. Int. 2015, 2015, 140196.
- Bratoeva, K.; Nikolova, S.; Merdzhanova, A.; Stoyanov, G.S.; Dimitrova, E.; Kashlov, J.; Radanova, M. Association between Serum CK-18 Levels and the Degree of Liver Damage in Fructose-Induced Metabolic Syndrome. Metab. Syndr. Relat. Disord. 2018, 16, 350–357.
- Toth, L.A.; Gardiner, T.W. Food and water restriction protocols: Physiological and behavioral considerations. Contemp. Top. Lab. Anim. Sci. 2020, 39, 9–17.
- Corwin, R.L.; Avena, N.M.; Boggiano, M.M. Feeding and reward: Perspectives from three rat models of binge eating. Physiol. Behav. 2011, 104, 87–97.


