 +1 credit
| Version | Summary | Created by | Modification | Content Size | Created at | Operation |
|---|---|---|---|---|---|---|
| 1 | Anubhav Pratap-Singh | + 3426 word(s) | 3426 | 2020-05-12 08:00:30 | | | |
| 2 | Rita Xu | -423 word(s) | 3003 | 2020-05-20 10:37:37 | | | | |
| 3 | Rita Xu | -126 word(s) | 2877 | 2020-10-28 10:12:07 | | |
Video Upload Options
Brewers' spent grains (BSGs) are the most important by-product of the brewing industry and are rich in protein and fiber. However, abundant amounts of BSGs are discarded annually worldwide. This project aimed to employ and compare innovative drying techniques to introduce snacks with protein sources derived from leftover BSGs. This study explored the dehydration kinetics of BSGs and the effect of three different drying methods—oven drying (OD), freeze drying (FD), and vacuum microwave drying (VMD)—on their protein content and functionality. Then, an energy and exergy analysis for the drying methods was given. Accordingly, a snack product (baked chips) using the dehydrated BSGs was developed by a sensory panel study to assess consumer acceptability of the final products. It was found that the VMD process took less drying time (48 min) compared to OD (50 min), with higher effectiveness as a drying process. VMD-treated BSG also showed moderate protein functionality and the highest overall acceptability when used in baked chips. Thus, VMD might be used as a sustainable drying technology for thermal treatment and valorization of BSG. In addition to having implications for dietary health, findings can help improve the economy of the breweries and other industries that deal with the processing of grains by valorizing their process waste and contributing to sustainability.
1. Moisture Content and Water Activity
The BSGs had a high moisture content (77.35 ± 0.484% on wet basis) with water activity (aw) of 0.99 ± 0.003. High moisture content and water activity values for the samples show their susceptibility to microbial and biochemical degradation. Thus, there is a need to dry the BSGs for longer shelf life and usage. Further, the storage and transport of BSG from the breweries to the processing center might often result in microbial growth, particularly when fresh BSG has such a higher moisture content and water activity. To use such a product as a food ingredient, it is not only necessary to lower the water content by drying, but also to ensure that the minimum pasteurization conditions have been met. Final moisture content of the dried BSGs ranged from 4.3–4.7% on wet basis.
2. Dehydration Kinetics and Process Modeling
2.1. Drying Behavior
The Figure 1 shows the dehydration moisture removal rate. For conventional oven-drying, temperature significantly affected the drying process time, with the lowest drying time recorded at 70 °C. The drying time for the VMD sample also was similar to that of the 70 °C OD dried sample. This can also be ascertained from the drying rate curves for the experimental data, as shown in Figure 1a, wherein the drying rates were calculated from the drying data by taking change in moisture content for each interval and expressed as g H2O/ g dry matter /min. As expected, drying rates of OD at the three temperatures followed the order 70 °C > 65 °C > 60 °C during the entire drying process. During the initial constant rate drying period at high moisture content, VMD’s drying rate was 33–67% faster than OD at the three temperatures studied. At moisture content below 100% db moisture content, the curves made a slope with x-axis depicting a falling rate period. The falling rates of drying for all samples indicate an increase in resistance to moisture migration from inside to the surface. The dimensionless moisture content, or the moisture ration MR, kept on decreasing for all the drying processes with drying time. This has been illustrated in Figure 1b. Decreasing MR with drying time is in agreement with the drying of most biological materials and spent grain drying [1][2]. In this zone, VMD drying rates and slopes were similar to that of OD at 65 °C, with 70 °C OD depicting a faster drying phenomenon.
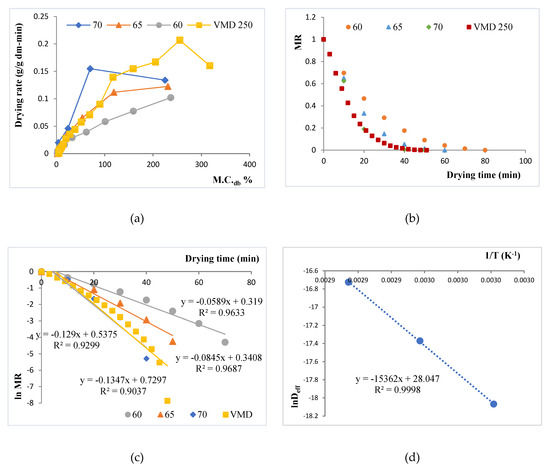
Figure 1. Plots for drying kinetics of vacuum microwave drying (VMD) and oven drying (OD) at 60 °C, 65 °C, and 70 °C. (a) Drying rate curve for brewers’ spent grains (BSG) samples for different OD temperatures (60 °C, 65 °C, and 70 °C) and for VMD; (b) Moisture Ratio (MR) versus drying time for the samples; (c) plotting ln MR versus drying time for the samples at 60 °C, 65 °C, and 70 °C oven drying and VMD treatment; (d) ln Deff versus 1/T.
This relative slowing of the VMD drying process during the falling rate period may be attributed to the relatively higher-pressure levels (180 torr, as compared to lower than 40 torr used in other works like Kwok et al. [3], Wojdyło et al. [4]) used during the VMD process in this study to maintain the product temperature in the critical zone. A higher level of VMD pressure was used in this study to raise the critical temperature to 65 °C for simultaneous pasteurization of the BSG waste. At 180 torr, as confirmed by the temperature collected from the VMD drier, a greater than 40 min of equivalent lethality at 65 °C was recorded for the BSGs. This would tend to pasteurize the product by the generated heating.
2.2. Effect of Drying Conditions on Moisture Diffusivity
A continuous decrease in MR with time shows that kinetics could be established based on Fick’s diffusion model, as diffusion governs the falling rate period. As already discussed, Equation (5) was obtained after solving the diffusion equation, considering a constant moisture diffusivity. When the experimental data were plotted as ln MR against time (Figure 1c), the data conformed to be linear with R2 > 0.9. This allowed for linear regression analysis to use the slope (b) in Equation (6) to evaluate the effective diffusivity (Deff), shown in Table 1. As evident, the Deff values were profoundly affected by drying temperatures. The value of Deff for the VMD was also within range of OD, with VMD values being slightly lower than OD at 70 °C, and larger than OD at 60 °C and 65 °C. Overall, the Deff varied from 1.42 × 10−08 to 5.45 × 10−08 m2/s. The values lie well within the Deff values of most food materials (between 10−08 and 10−12 m2/s) [5], like apricots [6] and pomegranate [7]. Using the Arrhenius relationship, the values of ln Deff at each temperature were plotted against 1/T and showed a straight line with high linearity (R2 > 0.99) (Figure 1d). The activation energy (Ea) was found to be 7095.5 J/g, whereas the pre-exponential factor for effective diffusivity (Do) was evaluated to be 1.52 × 10¹² m2/s.
Table 1. Calculation of effective diffusivity (Deff) values for the drying treatments.
| Treatment | t (min) | Slope, b | Deff (m2/s) | ||
|---|---|---|---|---|---|
| Drying Technique | T (°C) | Power (W) | |||
| OD | 60 | - | 70 | 0.059 | 1.42 × 10−08 |
| 65 | - | 50 | 0.085 | 2.86 × 10−08 | |
| 70 | - | 40 | 0.13 | 5.45 × 10−08 | |
| VMD | - | 250 | 48 | 0.14 | 4.74 × 10−08 |
2.3. Drying Process Modeling
Since MR was a function of drying time, and it decreased continuously, the drying data were fitted to seven different thin-layer drying models. The fitness of the model to approximate the drying data was determined by using R2, χ2, SEE, and ERMS values. In general, the R2 value has to be close to 1, and χ2, SEE, and ERMS values needed to be minimized. Table 2 shows these values for various model with their parameters. The page model was seen to fit the experimental data better than other models with the highest value of R2 (0.9996–0.9999) and lower values of χ2 (0.0018–0.0141), SEE (0.0034–0.0143), and ERMS (<0.0001). Figure 2a shows the fitting of the Page model on the experimental MR values for each drying treatment. The Page model had also been reported to fit drying data for several food materials, like raw mango slices [8] and bay leaves [9]. Nevertheless, Figure 2b shows a highly positive correlation between experimental and predicted MR values. Thus, the Page model was found to best represent the thin-layer drying behavior of BSGs.
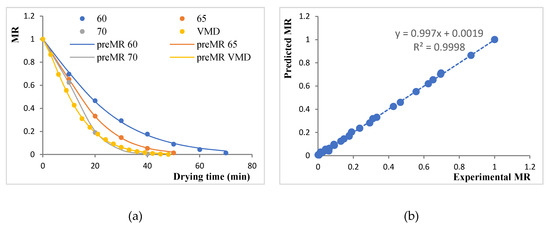
Figure 2. Plots for modeling the moisture ratio (MR): (a) Experimental MR versus drying time fitted with the Page model for various drying treatments; (b) correlation between experimental and predicted MR values as per the Page model.
Table 2. Values of various model constants and statistical parameters.
| Model | Expression | Drying Condition | Model Constants | Statistical Parameters | |||||||
|---|---|---|---|---|---|---|---|---|---|---|---|
| a | k | n | b | c | R2 | χ2 | SEE | ERMS | |||
| Exponential | MR = exp(−kt) | 60 | _ | 0.042 | _ | _ | _ | 0.9977 | 0.062 | 0.025 | 0.001 |
| 65 | _ | 0.057 | _ | _ | _ | 0.9942 | 0.078 | 0.043 | 0.002 | ||
| 70 | _ | 0.070 | _ | _ | _ | 0.9856 | 0.127 | 0.075 | 0.005 | ||
| VMD | _ | 0.077 | _ | _ | _ | 0.9972 | 0.182 | 0.023 | 0.001 | ||
| Page | MR = exp[−ktn] | 60 | _ | 0.022 | 1.20 | _ | _ | 0.9995 | 0.014 | 0.012 | 0.000 |
| 65 | _ | 0.018 | 1.38 | _ | _ | 1.0000 | 0.002 | 0.003 | 0.000 | ||
| 70 | _ | 0.009 | 1.73 | _ | _ | 0.9996 | 0.012 | 0.014 | 0.000 | ||
| VMD | _ | 0.036 | 1.28 | _ | _ | 0.9999 | 0.013 | 0.005 | 0.000 | ||
| Modified Page | MR = exp[−kt]n | 60 | _ | 0.028 | 1.52 | _ | _ | 0.9977 | 0.062 | 0.025 | 0.001 |
| 65 | _ | 0.027 | 2.10 | _ | _ | 0.9942 | 0.078 | 0.043 | 0.002 | ||
| 70 | _ | 0.019 | 3.69 | _ | _ | 0.9856 | 0.127 | 0.075 | 0.005 | ||
| VMD | _ | 0.047 | 1.66 | _ | _ | 0.9972 | 0.182 | 0.023 | 0.001 | ||
| Henderson–Pabis | MR = a exp(−kt) | 60 | 1.025 | 0.043 | _ | _ | _ | 0.9971 | 0.056 | 0.028 | 0.001 |
| 65 | 1.032 | 0.058 | _ | _ | _ | 0.9934 | 0.071 | 0.048 | 0.002 | ||
| 70 | 1.036 | 0.072 | _ | _ | _ | 0.9847 | 0.119 | 0.080 | 0.005 | ||
| VMD | 1.065 | 0.082 | _ | _ | _ | 0.9961 | 0.137 | 0.029 | 0.001 | ||
| Logarithmic | MR = a exp(−kt) + c | 60 | 1.025 | 0.043 | _ | _ | 0.00 | 0.9971 | 0.056 | 0.028 | 0.001 |
| 65 | 1.032 | 0.058 | _ | _ | 0.00 | 0.9934 | 0.071 | 0.048 | 0.002 | ||
| 70 | 1.036 | 0.072 | _ | _ | 0.00 | 0.9847 | 0.119 | 0.080 | 0.005 | ||
| VMD | 1.065 | 0.082 | _ | _ | 0.00 | 0.9961 | 0.137 | 0.029 | 0.001 | ||
| Power law | MR = at−b | 60 | 7.997 | _ | _ | 1.04 | _ | 0.9829 | 0.184 | 0.066 | 0.004 |
| 65 | 15.723 | _ | _ | 1.37 | _ | 0.9929 | 0.091 | 0.050 | 0.002 | ||
| 70 | 56.095 | _ | _ | 1.95 | _ | 0.9986 | 0.039 | 0.026 | 0.001 | ||
| VMD | 2.520 | _ | _ | 0.85 | _ | 0.9591 | 0.750 | 0.085 | 0.009 | ||
| Wang and Singh | MR = 1 + at + bt2 | 60 | −0.030 | _ | _ | 0.00024 | _ | 0.9990 | 0.026 | 0.017 | 0.000 |
| 65 | −0.041 | _ | _ | 0.00042 | _ | 0.9994 | 0.005 | 0.014 | 0.000 | ||
| 70 | −0.051 | _ | _ | 0.00064 | _ | 0.9952 | −0.004 | 0.047 | 0.002 | ||
| VMD | −0.053 | _ | __ | 0.00069 | __ | 0.9961 | 0.037 | 0.030 | 0.001 | ||
3. Energy and Exergy Analyses
Energy and exergy analyses have been extensively carried out for conventional drying methods like hot air oven drying, vacuum drying, and microwave drying treatments. There have been studies related to energy efficiency analysis for vacuum-microwave drying [10]. However, no previous work has been done discussing the exergy analysis related to vacuum-microwave drying as compared to conventional thermal processes. In order to suggest effective ways of valorizing the breweries wastes, an energy and effectiveness analysis is always handy. This study is the first to discuss the energy and exergy analyses for drying brewers’ spent grains by different techniques like oven drying and vacuum microwave drying. Figure 3a–d shows the variation in SMER, SEC, ηen, and ηex among all the treatments. The values of SMER varied from 0.165 to 0.388 kg/kWh, with the highest value for the VMD 250 W treatment. This was due to more moisture expulsion and drying for a given energy consumption in vacuum microwave drying. Previous work suggests higher SMER values for the microwave drying of carpet as compared to conventional drying [11].
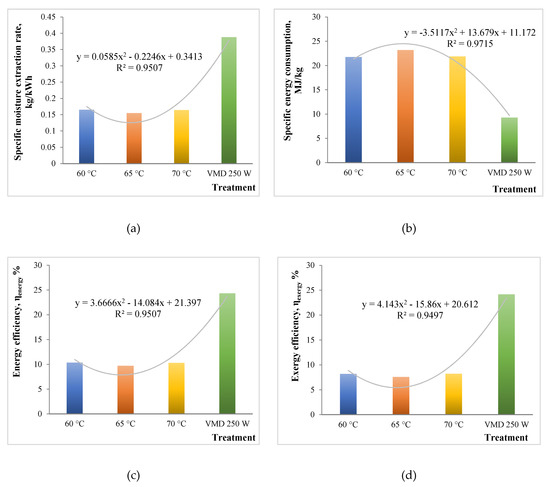
Figure 3. Energy and exergy analyses plots for different drying treatments: (a) Specfic Moisture Extraction Rate; (b) Specific Energy Consumption; (c) Energy efficiency, ηen; (d) Exergy efficiency, ηex.
SEC values represent reciprocation of SMER values, with a range from 9.274 to 23.201 MJ/kg. The lowest value was obtained for the VMD 250 W process. Apparently, a 60% reduction was observed in SEC by microwave application. This was in close agreement with the study by Sharma and Prasad [12], who obtained 70% reduction in microwave drying as compared to convective drying processes.
Efficiencies (ηen, and ηex) were observed to be contrasting between the different drying processes. The ηen ranged from 9.7% to 24.3%, with a significantly higher value in the case of VMD. Similarly, the ηex also seemed to be in line with the former, ranging from 7.6% to 24.2%. It was apparent that the values of ηen and ηex were low, which could be due to the smaller quantity of sample taken for the drying (around 5 g) [13]. Overall, VMD seemed to be better in terms of efficiency and energy saving for the drying of BSGs.
4. Protein Content
The protein content of the dried BSGs, as well as fresh sample, are shown in Table 3. The result showed that only drying method generally had no significant effect on the protein content of the sample, as the protein contents of VMD, FD, and oven drying 60 °C were not significantly different (p > 0.05) from each other. This is consistent with other findings about the impact of drying on total protein content [14]. Mostly the protein content of 22–24% on dry basis for the BSGs indicated the need to extract this valuable food by-product for utilization in product development.
Table 3. The protein content and functionality of BSG samples.
| Drying Technique | Protein Content (%, dba) | WHC (g/g) | OHC (g/g) | FC (mL) | FS (mL) |
|---|---|---|---|---|---|
| VMD | 22.676 x,a ± 1.107 | 1.31 a,c ± 0.002 | 3.14 a,c ± 0.003 | 1.5 a,c ± 0.005 | 0.5 a,d ± 0.002 |
| FD | 23.948 x,a± 0.264 | 1.18 a,d ± 0.002 | 2.27 a,d ± 0.004 | 1.5 a,c ± 0.005 | 0.5 a,d ± 0.003 |
| OD-60 °C | 20.203 x,a,b ± 2.636 | - | - | - | - |
| OD-65 °C | 23.710 x,a ± 1.051 | 1.52 a,e ± 0.005 | 3.33 a,e ± 0.003 | 1.5 a,c ± 0.004 | 0.5 a,d ± 0.002 |
| OD-70 °C | 20.912 x,a,b ± 4.333 | - | - | - | - |
| Fresh samples | 23.298 x,a ± 0.961 | - | - | - | - |
5. Protein Functionality
The interactions of water and oil with proteins are significant in food systems because of their effects on food flavor and texture [15]. Water/oil holding capacity values for all dried BSGs with three different techniques are presented in Table 3.
5.1. Water Holding Capacity and Oil Holding Capacity
The data showed that grains dried by OD at 65 °C had the highest WHC (1.52 g/g), followed by VMD (1.31 g/g) and FD (1.18 g/g). The range of oil holding capacity was from 2.27 g/g (FD) to 3.33 g/g (OD-65 °C). The values of WHC and OHC were statistically significantly higher (p < 0.05) for OD-65 °C and VMD than FD samples. Since air drying and VMD involve the application of heat for dehydration process, it can be deduced that heat application may lead to denaturation and conformational changes in protein structure, which might affect the functional properties [16]. Lesser values in the case of FD might be reflective of the fact that the proteins would still be in their native state, allowing minimum functionality. WHC and OHC in BSG flour varied based on the BSGs compositions after mashing process in the breweries. Replacement of wheat flour with barley flour significantly increased the water absorption capacity. Increasing the levels of barley flour in wheat flour blend insignificantly increased the oil absorption capacity of the blends [17]. Although the BSGs are a rich in fiber, they too affect the functionality of BSG products. Öztürk et al. [18] used BSGs for making cookies and observed the spread ratio (width/thickness) of cookies. This suggests that the fiber could bind the matrix together and lessen the spread. The impact of fibers of BSG chips could be a topic of further research.
5.2. Foaming Capacity and Foaming Stability
Table 3 also illustrates the relevant data for foaming capacity and stability. There was no significant difference (p < 0.05) for these values in all the three different samples. The foaming capacity and foaming stability of BSG flours from three different techniques at pH 7.00 was not very noticeable and was almost the same value (1.5 mL), and the stability of foaming for all samples was low and nearly at the same value (0.5 mL). Foaming capacity and stability were affected by drying at high temperatures of 105 °C, as shown earlier [19]. However, no differences were observed between oven drying at 80 °C and vacuum drying by them, which supports our results. Intensity of the drying treatment affects the interfacial properties of proteins. Similarity with the FD samples meant that the treatment conditions were not so intense to affect these properties.
6. Sensory Analysis of Baked Chips
Baked chips were prepared by incorporating the dried BSG flours obtained using OD-65 °C, VMD and FD (Figure 4) The sensory profiles for the baked chips made by using different dried BSGs are given in Figure 5. The diagram shows mean scores of each sensory attribute (namely appearance, texture, taste, smell, aftertaste, and overall acceptability) on a scale of 1 to 9 for all the types of chips on a cobweb plot radiating from the center point. The results showed (also statistical analysis) that there was no significant difference (p > 0.05) between the appearance of baked chips made using dried BSG obtained from any technique. In fact, there was no visual difference between the chip samples of each type. The appearance was “liked slightly” according to the mean score by panelists. What is more, the sensory characters like smell and aftertaste were also not significantly different (p > 0.05) and indistinguishable for all types of chips. However, VMD samples still got slightly higher mean scores for these characteristics than OD and FD chips. Also, these characteristics were “like moderately” for all types. For texture, the mean score for OD chips sample was slightly higher than VMD and FD samples, which did not differ much. The taste characteristics for the FD sample were significantly lower (p < 0.05) than both VMD and OD samples. This suggests that heat treatment during drying in the case of VMD and OD enhances the taste of BSG greatly. The taste of VMD and OD chips was “liked very much” by panelists. This also affected the overall acceptability of the chips. FD chips obtained the lowest mean scores compared to both the VMD and OD chips. Overall, the VMD chips attained the highest mean scores and were liked very much by panelists.
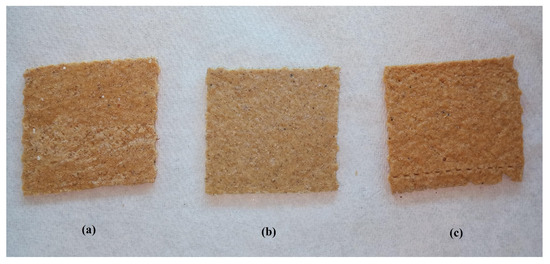
Figure 4. Images of the prepared baked chips: (a) OD; (b) VMD; (c) FD.
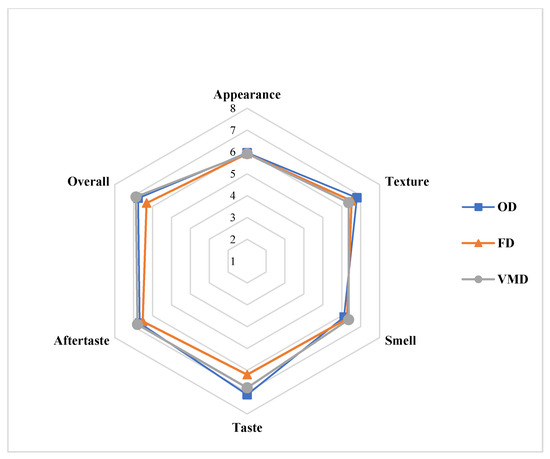
Figure 5. Cobweb plots for sensory profiles of baked chips using different dried BSG samples.
7. Conclusions
This study aimed to convert wasted brewers’ grains into some value-added product by drying and grinding them to be added to baked chip formulations. The study could be summarized into the following points:
-
Drying times were reduced using the VMD process;
-
Drying curves showed a good fit to the Page model;
-
The VMD process showed high effectiveness while drying;
-
Chips made with VMD-treated BSGs attained high overall acceptability.
The drying behavior of BSG showed that with increasing temperature from 60 °C to 70 °C, the drying time reduced from 70 during OD-60 °C to 48 min during VMD and OD-70 °C. Also, the falling rate period persisted during drying, with effective moisture diffusivity of the order 10−08 m2/s. Drying data for all drying treatment fitted the Page model at high R2 value. The effectiveness of drying methods analyzed in terms of SMER, SEC, ηen and ηex revealed that the VMD treatment had the best results as compared to OD. In terms of protein functionality of dried BSGs, there was a significant difference (p < 0.05) between different dried samples for WHC and OHC. On the contrary, FS and FC were almost the same for each. For the sensory analyses of baked chips, the OD (65 °C) samples attained higher scores for taste and texture. However, highest score for overall acceptability was achieved by the VMD sample. In total, it can be said that owing to the higher overall acceptability, lower drying time of 48 min (VMD) as compared to 50 min (OD-65 °C), and also moderate values of OHC, WHC, the VMD may prove to be a remarkable technology for drying BSGs and thereby for waste valorization and sustainability strategies.
References
- Piga, A.; Pinna, I.; Özer, K.B.; Agabbio, M.; Aksoy, U. Hot air dehydration of figs (Ficus carica L.): Drying kinetics and quality loss. Int. J. Food Sci. Technol. 2004, 39, 793–799.
- Zhongwei Tang; Stefan Cenkowski; Marta Izydorczyk; Thin-layer drying of spent grains in superheated steam. Journal of Food Engineering 2005, 67, 457-465, 10.1016/j.jfoodeng.2004.04.040.
- Kwok, B.H.L.; Hu, C.; Durance, T.; Kitts, D.D. Dehydration techniques affect phytochemical contents and free radical scavenging activities of Saskatoon berries (Amelanchier alnifolia Nutt.). J. Food Sci. 2004, 69, SNQ122–SNQ126.
- Landymore, C.; Durance, T.D.; Singh, A.; Pratap Singh, A.; Kitts, D.D. Comparing different dehydration methods on protein quality of krill (Euphausia Pacifica). Food Res. Int. 2019, 119, 276–282.
- W.A.M. McMINN; T.R.A. Magee; Principles, Methods and Applications of the Convective Drying of Foodstuffs. Food and Bioproducts Processing 1999, 77, 175-193, 10.1205/096030899532466.
- Marco Riva; Stefano Campolongo; Alexa Avitabile Leva; Andrea Maestrelli; Danila Torreggiani; Structure–property relationships in osmo-air-dehydrated apricot cubes. Food Research International 2005, 38, 533-542, 10.1016/j.foodres.2004.10.018.
- Manoj Mundada; Bahadur Singh; Swati Maske; Convective dehydration kinetics of osmotically pretreated pomegranate arils. Biosystems Engineering 2010, 107, 307-316, 10.1016/j.biosystemseng.2010.09.002.
- R.K. Goyal; A.R.P. Kingsly; M.R. Manikantan; S.M. Ilyas; Thin-layer Drying Kinetics of Raw Mango Slices. Biosystems Engineering 2006, 95, 43-49, 10.1016/j.biosystemseng.2006.05.001.
- V. Demir; T. Gunhan; A.K. Yagcioglu; A. Degirmencioglu; Mathematical Modelling and the Determination of Some Quality Parameters of Air-dried Bay Leaves. Biosystems Engineering 2004, 88, 325-335, 10.1016/j.biosystemseng.2004.04.005.
- M. Leiker; M. A. Adamska; Energy efficiency and drying rates during vacuum microwave drying of wood. European Journal of Wood and Wood Products 2004, 62, 203-208, 10.1007/s00107-004-0479-9.
- A. K. Haghi; Thermal analysis of drying process. Journal of Thermal Analysis and Calorimetry 2003, 74, 827-842, 10.1023/b:jtan.0000011015.19916.bf.
- G Sharma; S Prasad; Specific energy consumption in microwave drying of garlic cloves. Energy 2006, 31, 1921-1926, 10.1016/j.energy.2005.08.006.
- A. Surendhar; V. Sivasubramanian; D. Vidhyeswari; Balakrishnan Deepanraj; Energy and exergy analysis, drying kinetics, modeling and quality parameters of microwave-dried turmeric slices. Journal of Thermal Analysis and Calorimetry 2019, 136, 185-197, 10.1007/s10973-018-7791-9.
- M. S. Kaldy; M. R. Hanna; S. Smoliak; INFLUENCE OF DRYING METHODS ON PROTEIN CONTENT AND AMINO ACID COMPOSITION OF THREE FORAGE LEGUMES. Canadian Journal of Plant Science 1979, 59, 707-712, 10.4141/cjps79-110.
- Amza, T.; Amadou, I.; Kamara, M.T.; Zhu, K.X.; Zhou, H.M. Nutritional and functional characteristics of gingerbread plum (Neocarya macrophylla): An underutilized oilseed. Grasas Aceites 2011, 62, 290–298.
- Anubhav Pratap Singh; Anika Singh; Hosahalli S. Ramaswamy; Heat transfer phenomena during thermal processing of liquid particulate mixtures—A review. Critical Reviews in Food Science and Nutrition 2017, 57, 1350-1364, 10.1080/10408398.2014.989425.
- Paras Sharma; Hardeep Singh Gujral; Cookie making behavior of wheat–barley flour blends and effects on antioxidant properties. LWT 2014, 55, 301-307, 10.1016/j.lwt.2013.08.019.
- S. Ozturk; Ö. Özboy; H. Köksel; I Cavidoğlu; Effects of Brewer's Spent Grain on the Quality and Dietary Fibre Content of Cookies. Journal of the Institute of Brewing 2002, 108, 23-27, 10.1002/j.2050-0416.2002.tb00116.x.
- Yong Wang; Dong Li; Li-Jun Wang; Shu-Jun Li; Benu Adhikari; Effects of drying methods on the functional properties of flaxseed gum powders. Carbohydrate Polymers 2010, 81, 128-133, 10.1016/j.carbpol.2010.02.005.


