Highlights
-
Video Abstracts (VAs) have evolved from experimental novelties into essential tools for research dissemination, significantly enhancing scholarly communication in a digital-first era, offering a repeatable model for maximizing impact in a competitive digital landscape.
-
The MDPI Video Service produced 118 professional VAs in collaboration with 68 journals across 11 disciplines, serving 1,149 researchers and fostering a vibrant academic community in 2025.
-
Video abstracts produced by MDPI's Video Service significantly boost article visibility, downloads, and citations, with case studies showing marked increases across journals such as Remote Sensing, Animals, Nutrients, and Entropy.
1. Introduction
In 2011, quantum physicist Barry Sanders and his team at the University of Calgary broke new ground by publishing a video abstract (VA) alongside their pioneering research on qubits [1]. This four-minute visual summary, shared on YouTube amid viral content of cats and pop music, demonstrated a transformative idea: complex science could be communicated dynamically, reaching audiences far beyond traditional academic circles.
Over a decade later, video abstracts (VAs) have evolved from experimental novelties into essential tools for research dissemination. As digital platforms dominate how knowledge is consumed and shared, the question is no longer whether video abstracts will endure, but how they redefine scholarly impact.
In 2025, MDPI launched its Academic Video Service, aiming to support scholars through the production of Video Abstracts, Short Takes, Scholar Interviews, and Profile Videos. MDPI’s Video Service has witnessed a remarkable surge in interest from researchers worldwide. A growing community of scholars has progressed from discovering video abstracts for the first time to actively embracing their production, recognizing their power to transform specialized research into accessible knowledge.
This report compiles and analyzes most of the data from the MDPI video service, with a focus on evaluating the role of VAs in enhancing scholarly communication.
2. Background and Market Context
2.1. The Visual Turn in Scholarly Communication
The global video streaming market is projected to grow from USD 131.44 billion in 2024 to approximately USD 599.2 billion in 2033 [2], and many findings have indicated that this will be progressively accompanied by the use of social networking tools for informal scholarly communication [3], reflecting the increasing social reliance on video-based content. Within this context, scholarly communication is undergoing a “visual shift,” leading to the rise of VAs.
The evolution of academic video publication—from early initiatives such as Screenworks (distributed alongside The Journal of Media Practice on DVD in 2006) to established platforms like JoVE (Journal of Visualized Experiments)—reflects the formal recognition of video as a legitimate form of scholarly output, now indexed in major academic databases [4]. This institutional acceptance aligns with a broader shift in research practices, as scholars increasingly utilize social media as a professional platform to amplify the reach and impact of their work [5].
2.2. Core Value Proposition of VAs
By combining dynamic visuals and narration, VAs distill and visualize the core concepts, methods, and contributions of academic papers. A growing body of research indicates that video content can contribute to an increase in various research metrics, such as citations and views [6]. They fulfill key roles in several communication scenarios:
- For broader research audiences (e.g., policymakers, industry R&D personnel, advanced students): VAs expand the reach and social visibility of academic work.
- For domain experts: VAs provide a more intuitive and information-dense overview than textual abstracts, improving literature screening efficiency.
- For interdisciplinary scholars: VAs reduce comprehension barriers and foster cross-disciplinary innovation.
Within this expanding ecosystem, a growing number of academic service providers—including established players such as Springer Nature’s Video Abstract services, Wiley’s Research Video initiatives, and Taylor & Francis’s multimedia publishing programs—have entered the field, recognizing the potential of video to enhance research communication.
3. VA Production and Dissemination Data from MDPI's Academic Video Service, 2025
This section presents data sourced from MDPI’s Academic Video Service’s internal database and public analytics from third-party services, including YouTube, Facebook, and LinkedIn, reflecting the performance of the service throughout 2025. Where relevant, results are benchmarked against 2024 to illustrate year-over-year growth and trends.
3.1. Production Scale and Scholarly Coverage
The inaugural year of MDPI's Academic Video Service has established a robust foundation for video abstract production and distribution. The service has successfully engaged a broad academic community while developing specialized content across multiple disciplines. The following data outlines the scope and reach achieved during the reporting period.
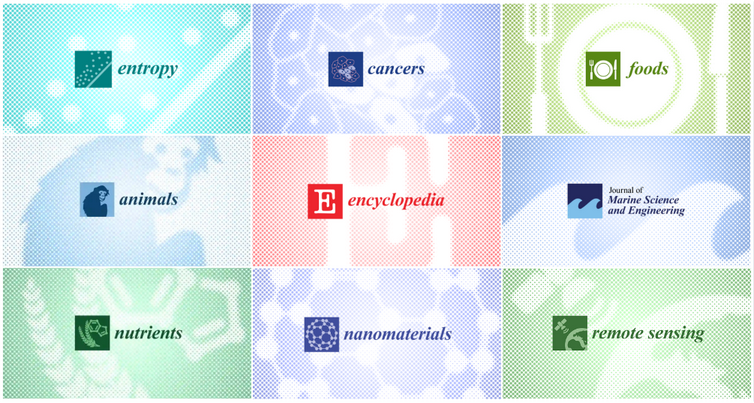
Some of the partner journal series.
- The service produced 118 professional VAs and maintained 13 active VA-related video series.
- Collaborative partnerships with 68 leading academic journals spanned 10 major disciplines, including Medicine & Pharmacology, Biology & Life Sciences, Engineering, Environmental & Earth Sciences, Computer Science & Mathematics, Chemistry & Materials Science, Public Health & Healthcare, Social Sciences, Business & Economics, and Arts & Humanities.
- A total of 1,149 researchers have used the service, including 60 scholars who participated in customized VA production, with all content distributed through social media channels (Figure 1).
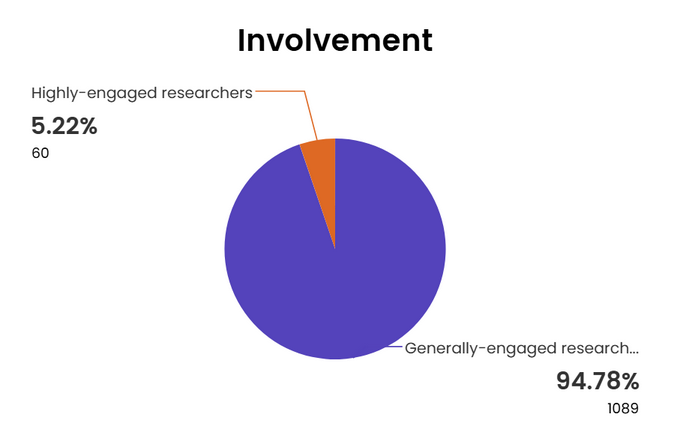
Figure 1. Researchers who used MDPI’s Academic Video Service. All data was obtained from Encyclopedia.
3.2. Multi-Platform Dissemination and Performance
VAs demonstrated strong performance across multiple distribution channels, showing substantial growth in reach and engagement metrics during the reporting period. In total, the produced VAs achieved 782,478 views across the Encyclopedia platform, Facebook, and YouTube, with 48,295,814 impressions recorded on the Encyclopedia platform and YouTube.
A. VA Performance on Encyclopedia Platform
As one of MDPI's key academic initiatives, Encyclopedia serves as MDPI’s primary platform for delivering integrated academic services. All the VAs produced through MDPI’s Academic Video Service were published through this platform.
The year-over-year data reveals a story of validated success.
- The video content generated a monumental 47,834,514 total impressions, 41,240 total views, and 9,988 unique viewers.
- The number of unique viewers grew from 5,235 to 9,988, an unprecedented 90.8% year-over-year increase, demonstrating the efficient capture of audience interest at scale.
B. VA Performance on YouTube
The VAs produced were simultaneously released on MDPI’s YouTube channel. MDPI’s YouTube channel serves as a critical engine for global discoverability, showing strong year-over-year growth across all key metrics (Table 1). The following are the browsing-related data for VAs hosted on the YouTube channel.
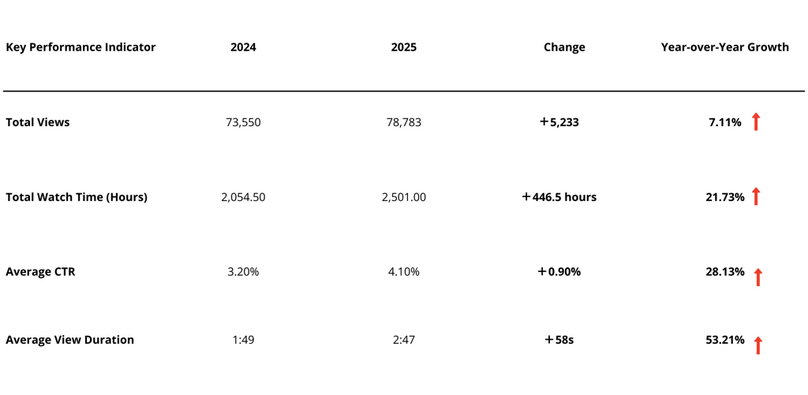
Table 1. Year-over-Year (YoY) Performance—video abstract channel metrics. All data was obtained from YouTube.
-
Given that the VAs that are produced and published are generally around 4 minutes long, a watch time of 2:57 is equivalent to viewing nearly 73.75% of a VA.
3.3. Disciplinary Distribution of VA Engagement
By analyzing and structuring VA browsing data across disciplines and research fields, we identified pronounced variations in the level of interest in VAs among scholars. These variations are evident in both scholars’ propensity to create VAs and their degree of engagement in consuming VA content.
As shown in Figure 1, life sciences demonstrate the strongest participation, with Biology & Life Sciences recording the highest views (10,203) and attracting the largest viewer base (2,285). Medicine & Pharmacology and Engineering offer solid mid-tier performance with 9,948 and 5,149 views, respectively. Environmental & Earth Sciences (3,940 views) and Computer Science & Mathematics (3,337 views) show established audience interest, and Chemistry & Materials Science (3,125 views) also demonstrates consistent engagement (Figure 2). The findings indicate that scholars in biological, medical, and engineering fields are most active in watching video abstracts.
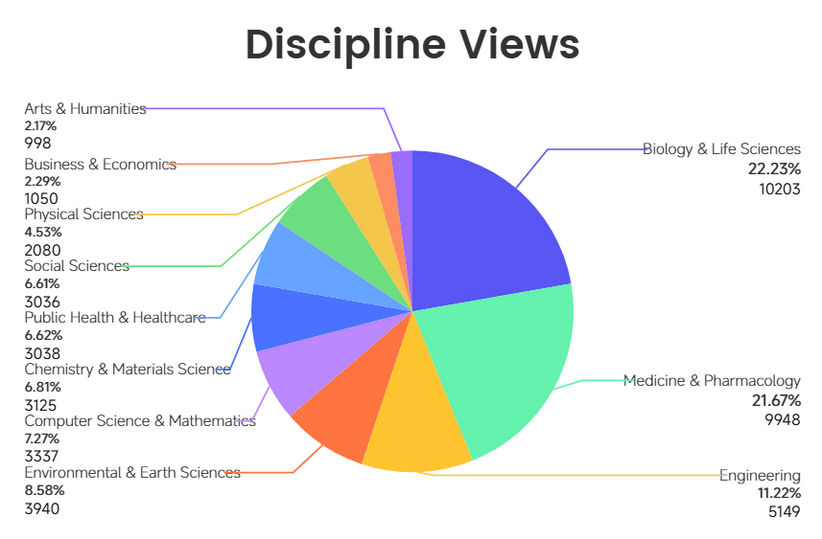
Figure 2. Distribution of page views by academic discipline. Medicine, Biology, and Engineering ranked among the top three. All data was obtained from Encyclopedia.
The following chart (Figure 3, 4) reveals clear patterns in audience distribution across academic disciplines, providing insights into which fields show the strongest engagement (comments, likes, favorites) with video abstracts.
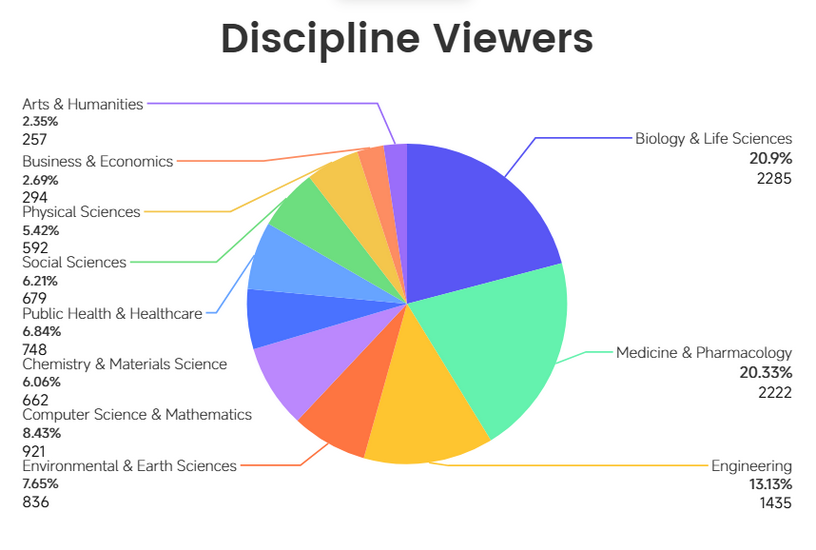
Figure 3. Distribution of viewers by academic discipline. While the top three fields were unchanged, Biology drew a larger audience despite having fewer videos. All data was obtained from Encyclopedia.
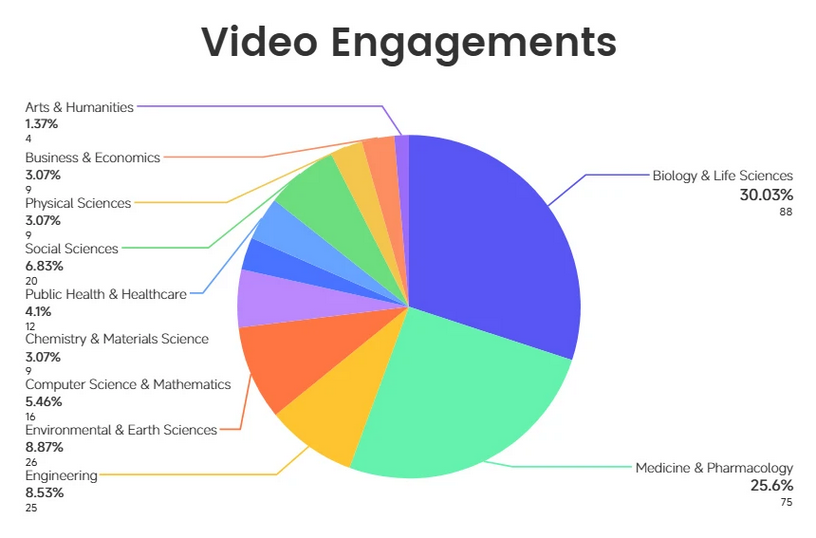
Figure 4. Distribution of video engagement by academic discipline. Biology and Medicine showed noticeably higher engagement compared to other disciplines. All data was obtained from Encyclopedia.
Biology & Life Sciences leads in audience reach with 2,285 viewers, closely followed by Medicine & Pharmacology with 2,222 viewers. These two disciplines together account for the largest share of VA viewership, reflecting strong scholarly interest in life science content.
Based on the survey conducted by the MDPI Video Service regarding user satisfaction (Figure 5), approximately 50% of VA users hold professorial positions, including full professors, associate professors, and assistant professors. PHD students and Post-Doctoral researchers comprise 8.3% and 16.7% of the user base, respectively. Researchers from non-academic institutions account for 8.4%, while independent researchers represent 4.2%. The remaining users include consultants, visiting scientists, and retired researchers.

Figure 5. Word cloud of user attributes. All data was obtained from the video service survey.
Overall, the VA audience is predominantly composed of research professionals. The higher level of engagement observed among professors suggests that their interest in VA is likely driven by teaching and presentation requirements, stronger funding capacity, and sustained academic output. Furthermore, while the non-academic segment represents slightly more than 8% of users, it demonstrates tangible potential and should not be viewed as a market without opportunity.
3.4. Other Video Product Performance
Throughout the reporting period, the MDPI Academic Video Service created 13 Scholar Interview videos, presenting conversations with prominent academics on their research and perspectives. This format holds particular appeal for audiences seeking direct insights from researchers.
As shown in Table 2, this series garnered 2,034 views. It gained prominent exposure via 424,059 main page impressions and secured extensive reach through 5,658,196 recommending impressions.

Table 2. Performance of Scholar Interview series. All data was obtained from Encyclopedia.
This finding indicates a broad acceptance among scholars of interview-based video formats as an effective medium for content delivery. The strong performance of this series across discovery channels suggests that the content aligns well with diverse audience preferences.
3.5. Academic Community Engagement Through VA Activities
The MDPI video service launched a ScholarVision Creations event on the Encyclopedia platform in 2024. The event was designed to introduce users to VAs and engage them in the VA production process. The event concluded with a vote to select the most popular VA created during the event period. The event drew considerable participation from scholars, generating notable momentum and driving interest in video abstracts (Table 3). Its strong reception reflects a clear interest among researchers in VAs as a format for academic communication.
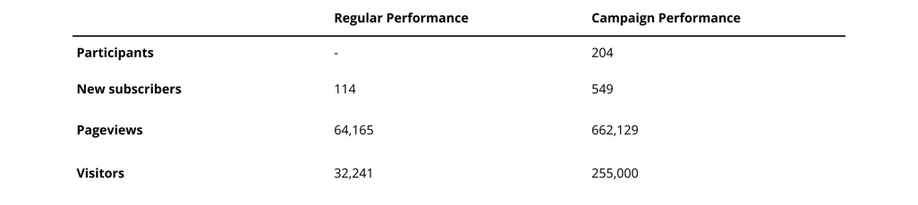
Table 3. Performance metrics of ScholarVision Creations Event and platform engagement. All data was obtained from Encyclopedia.
-
The event yielded 40 videos and involved 204 participants. Four researchers garnered awards for outstanding contributions, while participants completed 2,669 engagements during the event (engagements include creating entries, submitting images, editing entries, and similar actions).
-
Page views increased by ~930% and Visitors by ~690%, indicating highly effective audience reach.
The exceptionally high conversion rate of new users into credit recipients directly reflects a strong user interest in the campaign's core value and a clear intent to engage with VA creation.
4. Impact of Video Abstracts on Enhancing Research Visibility
The effect of VAs on article performance represents the primary area of concern among scholars. Accordingly, this section consolidates data collected from VAs and articles, examining both the VAs' impact on their corresponding original articles and the dissemination performance of the articles across online channels.
4.1. VA-Driven Changes in Article Reach and Metrics
Over the past year, tracking the performance of the VA Series and comparing its data with that of the previous reporting cycle has revealed a clear trend: the substantial growth in the platform-wide exposure of VAs has expanded into the millions. This marks a dramatic rise from the previous statistical period (2024), when total exposure across all VA series remained below 200,000 (181,553) impressions (Table 4).
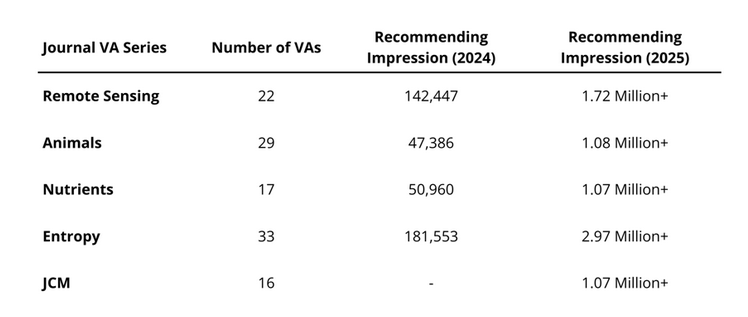
Table 4. The exposure of individual series has now reached the millions. All data was obtained from Encyclopedia. *The JCM VA series was established in 2025 and therefore does not have corresponding data for the previous statistical period (2024).
A comparative study was conducted using articles published in four target journals—Journal of Clinical Medicine (JCM), Agronomy, Remote Sensing, and Nutrients—with Impact Factors of 2.9, 3.4, 4.1, and 5.0, respectively. The analysis covers all articles released between January 1, 2023, and October 31, 2025. Articles accompanied by video abstracts (with VAs produced by MDPI’s academic video service; 30 in total) were designated as the experimental group, while the remaining 24,906 articles without VAs published during the same period formed the control group. For both cohorts, cumulative performance metrics—including article views, downloads, and citations—were collected up to the common statistical cutoff date. A comparison of group-level averages across these key indicators (Figures 6, 7, 8) enables a systematic assessment of the long-term impact of VAs on content dissemination and academic influence.
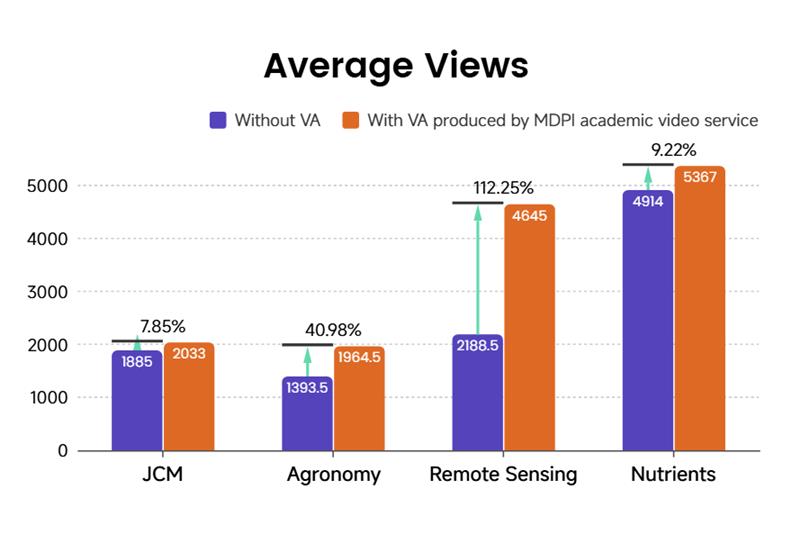
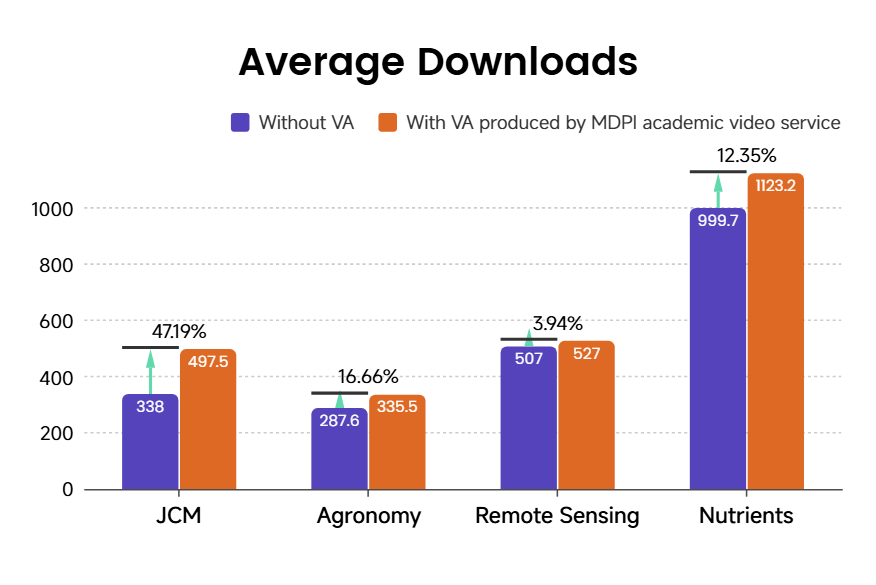
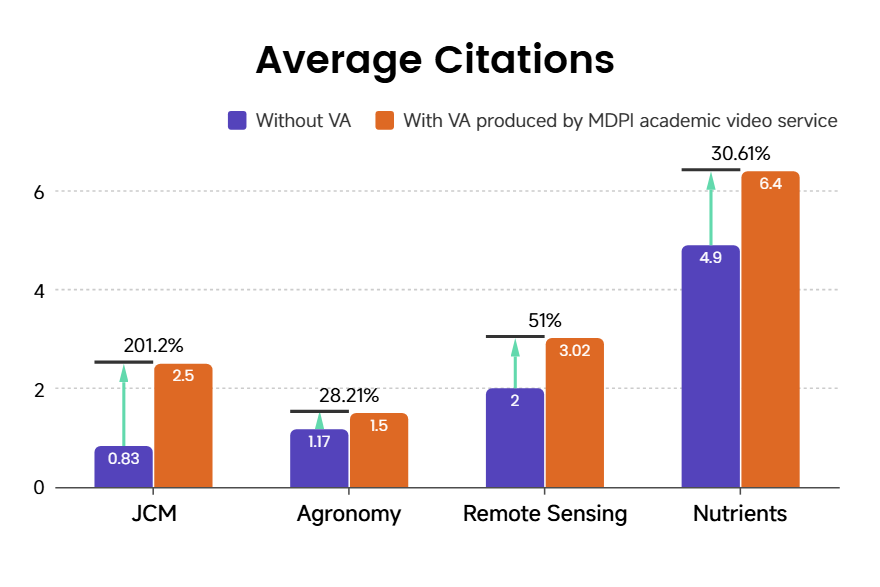
Figure 8. Comparison of average article impact metrics for articles published with and without MDPI’s Academic Video support across four journals, showing consistently higher values for video-supported articles. All data was obtained from MDPI.
In terms of uplift magnitude, page views increased by as much as 112.25% for Remote Sensing, citation growth reached a peak of 201.2% for JCM, and download growth spanned the range between 3.94% and 47.19%. These results highlight clear differences in the strength of the VA service across the dimensions of content dissemination and scholarly impact.
Remote Sensing is the journal benefiting most strongly from VA, recording a 112.25% surge in page views—the highest among all journals—alongside a 51% increase in citations and a 3.94% rise in downloads. This profile reflects an exposure-driven, burst-style growth pattern. For newly integrated JCM articles, VAs demonstrate exceptional effectiveness in driving both academic impact (citations) and downstream conversion (downloads). This finding aligns with the earlier analysis, which indicates stronger audience engagement with biology & medicine content. By contrast, Agronomy exhibits a well-balanced response to VAs, with no pronounced weaknesses and steady improvements across the entire dissemination-to-impact pipeline. Nutrients also records positive gains across all three indicators (citations +30.61%, downloads +12.35%, views +9.22%), though the overall increase remains comparatively limited and weaker than that observed for the other three journals.
Taken together, the results show that VAs effectively enhanced both dissemination efficiency (views to downloads) and academic impact (citations) across all four journals. However, its effectiveness is clearly shaped by disciplinary characteristics: technology-focused journals (e.g., Remote Sensing) tend to achieve rapid gains in visibility through VAs, whereas medical journals (e.g., JCM) perform better at translating enhanced exposure into deeper academic influence.
4.2. Impact of Video Abstracts on Research Dissemination
The deployment of a VA serves as an effective catalyst for the associated research article, as evidenced by the Encyclopedia video dashboard and data from social media platforms.
A. Article Visibility Amplified by VA Distribution
Each VA prominently features the article’s DOI within the video content itself. This design ensures a direct navigational pathway from VA exposure to the original publication, providing a clear analytical rationale for attributing changes in article access (views) behavior to VA visibility.
The impact of a VA on article visibility is assessed by continuously monitoring and comparing article access data before and after the VA is made available online.
Case 1 was initially published on August 24, 2024. During its first month, it received 816 page views, averaging 25.5 daily views, and reached a monthly peak of 1,163 in the third month. The average daily views over the first three months totaled 30.4, after which traffic gradually declined and stabilized. Prior to the release of the VA, the article’s monthly views averaged 677.7.
The associated VA was launched on July 22, 2025. Following the launch, page views rose to 906 in the first month, representing a 33.7% increase over the pre-VA monthly average. Traffic continued to grow over the subsequent three months, reaching a peak of 1,763 in November 2025—an increase of 160% compared to the pre-VA baseline. As of the report date, December traffic stood at 1,309, still 93% higher than the pre-VA average. Over the five months following the VA release, the article averaged 1,383.6 monthly views (44.6 daily views), reflecting a 104% increase in growth relative to the monthly average before the VA launch.
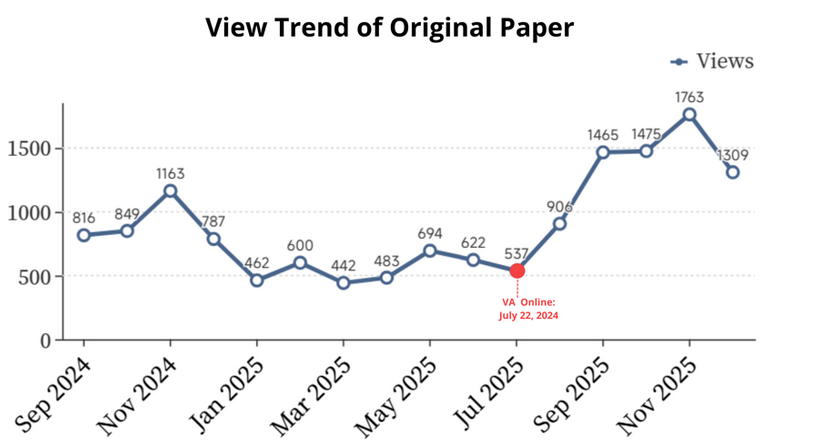
Figure 9. Viewership trend of Case 1 after its publication. All data was obtained from MDPI.
Insights from the line chart and supporting data reveal that the VA maintained a persistent impact on readership well beyond its publication date, significantly improving the article’s visibility and engagement trajectory.
Case 2: A Survey of Object Detection for UAVs Based on Deep Learning
The article examined in this analysis was initially published on December 29, 2023, with its associated VA content released on February 24, 2024.
During the first three months after publication, the article exhibited stable and consistent performance. Average daily traffic remained at 17.7 views, while monthly views increased gradually from 535 to 639 (Figure 10), implying a normal early-stage growth pattern without external intervention.
The deployment of the VA marked a clear inflection point in the traffic trajectory. In the first full month following launch (March 2024), article views increased sharply by 62.4% to 1,038. Following a brief and modest correction in April 2024—likely attributable to natural fluctuation—traffic strongly rebounded, reaching a cycle peak of 1,415 views in May 2024. This period represents the concentrated achievement of the synergistic impact generated by a VA.
Following this peak, beginning in June 2024, the article’s traffic entered a gradual and anticipated normalization phase, ultimately stabilizing at a sustained level that remained structurally higher than the initial baseline.
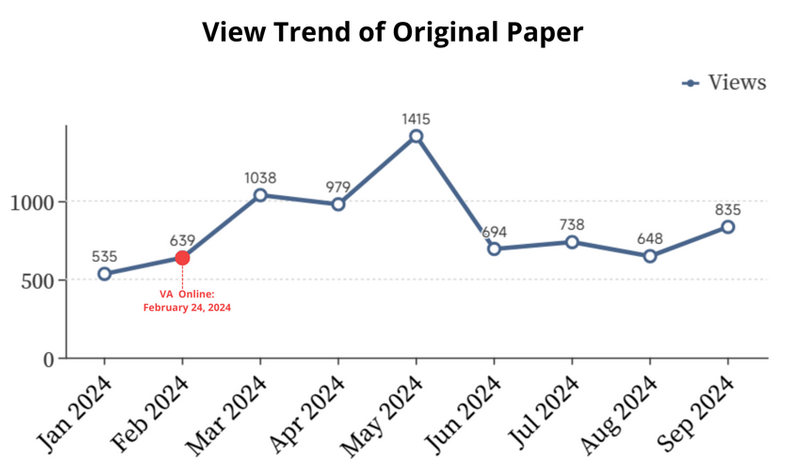
Figure 10. Viewership trend of Case 2 before and after the launch of its VA. All data was obtained from MDPI.
Overall, this pattern aligns with a classic content re-amplification lifecycle, wherein the introduction of a VA catalyzes short-term pulse growth, followed by convergence toward a new steady state.
B. Expanding Reach to New Audiences via Social Platforms
Case 3: Attitudes Toward Managing the Fish-Eating Great Cormorant
The article analyzed here was published on April 23, 2025, with its associated VA content released on July 3, 2025, and concurrently distributed via the Facebook homepage.
By the statistical cutoff date of January 27, 2026, the video had generated 409,966 cumulative views while reaching 9,224 unique users (Figure 11), yielding an exceptionally high views-to-reach ratio and indicating strong visibility amplification and repeated content consumption.
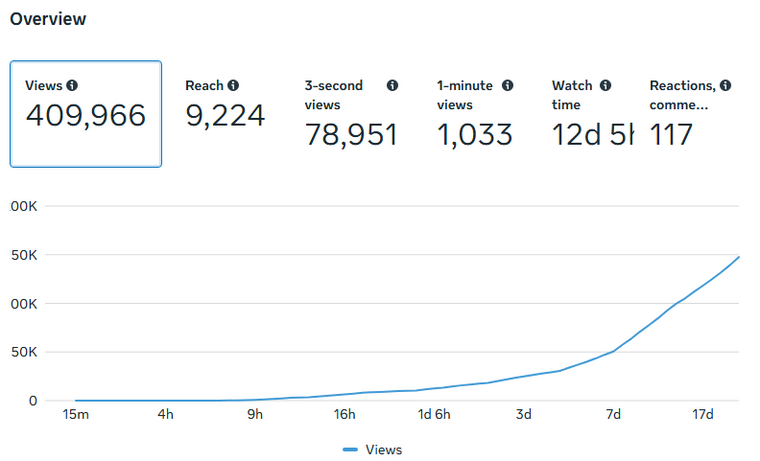
Figure 11. Performance overview of Case 3 on Facebook. All data was obtained from Facebook.
Total viewership for this VA amounted to 12 days and 5 hours (293 hours in total), distributed as shown in the chart above. In addition, the watch time distribution (Figure 12) reveals a critical insight: the audience composition suggests that the vast majority of views originated from non-followers, highlighting the VA’s effectiveness in reaching new viewers and expanding content discoverability.
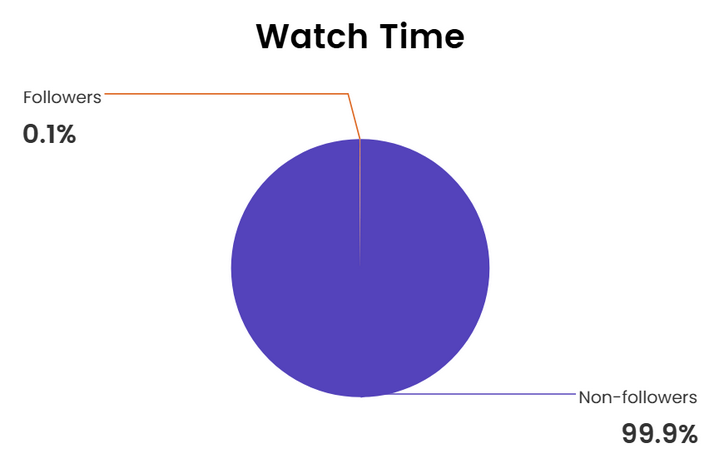
Figure 12. Watch time distribution. This significant difference is largely due to the extensive exposure and the number of followers. All data was obtained from Facebook Insights.
The data reveal a pronounced drop-off in viewing depth; however, 78,947 instances of 3-second views suggest that the video initially captured attention.
The Watch Time Trend (Figure 13) indicates effective initial audience engagement and successful early reach.
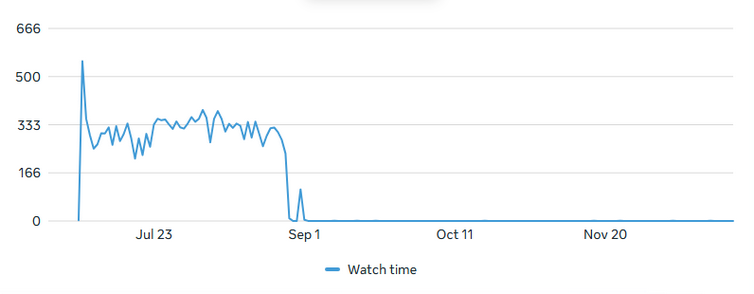
Figure 13. The Watch Time Trend Chart illustrates a robust launch phase in late July, with watch time quickly reaching a significant initial level. All data was obtained from Facebook Insights.
Throughout August and September, the watch time maintained consistently high performance, reflecting stable viewer interest and strong retention. The stability during this period suggests that the content had lasting value and continued to attract views well beyond its release date. A gradual decline is visible from October onwards—a common pattern for published content over time.
Furthermore, the post for the VA achieved 819 impressions and an impressive 312 views on LinkedIn. In other words, the video achieved a view-through rate (VTR) of 39.2%, calculated by dividing views by impressions (321/819). This substantially exceeds typical industry benchmarks for academic and professional content, which generally range between 15 and 25. This high VTR indicates significant content relevance and a strong appeal to the target audience. Over the past year, the average VTR of all the VAs published on LinkedIn reached an impressive 62.4%, well above the general range mentioned earlier.
5. Conclusions and Outlook
The evidence presented in this report leads to an unequivocal conclusion: in an increasingly crowded digital landscape, the VA has evolved from a novel supplement into a critical component of a modern research dissemination strategy.
The data confirms that VAs deliver transformative value by directly addressing the core challenge of academic visibility.
For Authors: VAs capture global attention and drive engagement, translating into increased article visibility and academic impact.
For Journals: VAs significantly boost content consumption metrics and expand readership through algorithmic distribution, enhancing the journal's reach and influence.
Looking forward, the integration of video into scholarly communication is not a passing trend but a fundamental shift. Many researchers feel that deepening understanding is a collaborative effort. Thus, extending an invitation for others to engage with their work is a natural and rewarding step.
About MDPI’s Video Service
The MDPI Video Service was launched in 2025 to meet the growing demand for dynamic research dissemination. The service offers comprehensive video solutions, including Video Abstracts, Short Takes, and Profile Videos. MDPI’s video service provides a one-stop service, including one-on-one video assistance, script writing, high-quality animation, a native speaker voice, quality assurance, and social media promotion. For video examples, see Heat-Sealing Process for Chañar Brea Gum Films and ESG Reporting for Large US Airports
Reference
[1] Spicer, S. Exploring Video Abstracts in Science Journals: An Overview and Case Study. J. Librariansh. Sch. Commun. 2014, 2,eP1110.
[2] Video Streaming Market Trends, Shares, Competition and Growth Forecast 2025-2033 - Cloud Tech and Mobile Platforms Continue to Transform the Landscape, Fueling User Engagement and Market Expansion. Available Online: https://www.globenewswire.com/news-release/2025/10/31/3178410/28124/en/Video-Streaming-Market-Trends-Shares-Competition-and-Growth-Forecast-2025-2033-Cloud-Tech-and-Mobile-Platforms-Continue-to-Transform-the-Landscape-Fueling-User-Engagement-and-Marke.html (accessed on 11 November 2025)
[3] Al-Aufi, A; Fulton, C. Impact of social networking tools on scholarly communication: a cross-institutional study. Electron. Libr. 2015, 33, 224–241.
[4] Laaser, W.; Toloza, E.A. The changing role of the educational video in higher distance education. Int. Rev. Res. Open Dis. 2017, 18, 2.
[5] Gazi, M. A. I.; Rahaman, M. A.; Rabbi, M. F.; Masum, M.; Nabi, M. N.; Senathirajah, A. R. bin S. The Role of Social Media in Enhancing Communication among Individuals: Prospects and Problems. Environ. Soc. Psychol. 2024, 9, 11.
[6] Bonnevie, T.; Repel, A.; Gravier, F.E.; Ladner, J.; Sibert, L.; Muir, J.F.; Cuvelier, A.; Fischer, M.O. Video abstracts are associated with an increase in research reports citations, views and social attention: a cross-sectional study. Scientometrics 2023, 128, 3001–3015.