We are pleased to announce the launch of the Encyclopedia Scientific Infographic Service, created to help researchers transform complex scientific findings into clear, engaging, and professionally designed visual narratives. This service is entirely free of charge and aims to enhance the readability, visibility, and overall impact of your research.
1. What Are Academic Infographics?
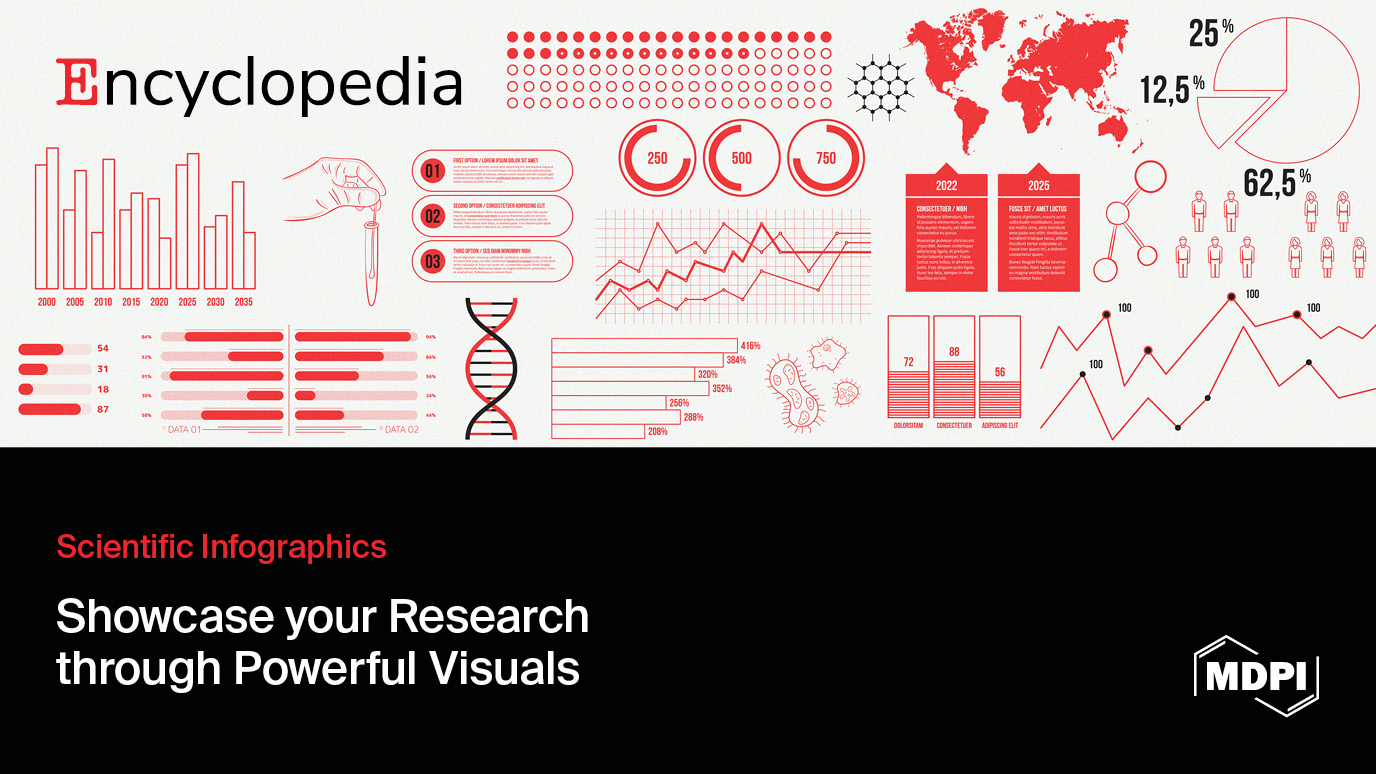
Academic infographics visually present key data, major findings, experimental workflows, and conceptual models in a structured, concise, and accessible format. Research shows that infographic articles generate significantly greater social media attention and achieve higher Altmetric scores than standard original research articles, underscoring their value in enhancing research visibility.
High-quality infographics can:
-
Communicate the core message of your research quickly and effectively.
-
Improve presentation quality and visual appeal.
-
Lower the barrier for interdisciplinary understanding.
-
Facilitate broader dissemination across both academic and public audiences.
2. Who Can Benefit from This Service?
This service is available to researchers across all academic disciplines.Typical use cases include:
-
Post-publication promotion of journal articles.
-
Conference presentations (oral sessions, posters, booth displays).
-
Grant proposals, mid-term project reports, and research summaries.
-
Teaching materials and public science communication.
-
Social media dissemination and institutional outreach.
3. Why Choose Encyclopedia Infographic Service?
Our service provides:
-
Professional production by a dedicated academic design team.
-
Native English editing to ensure accurate and polished content.
-
Consistent visual standards using copyright-safe materials.
-
One complimentary round of revisions.
-
Designs optimized for journals, conferences, and social media platforms.
4. How to Apply
To apply for the Encyclopedia Scientific Infographic Service, please visit https://encyclopedia.pub/user/image/infographics and submit the following information:
-
Manuscript DOI/Link (Optional)
-
Image Notes (Required)
-
Upload Materials (Optional; supported formats: zip, rar; file size: 1 KB–300 MB)
5. Encyclopedia Scientific Infographics
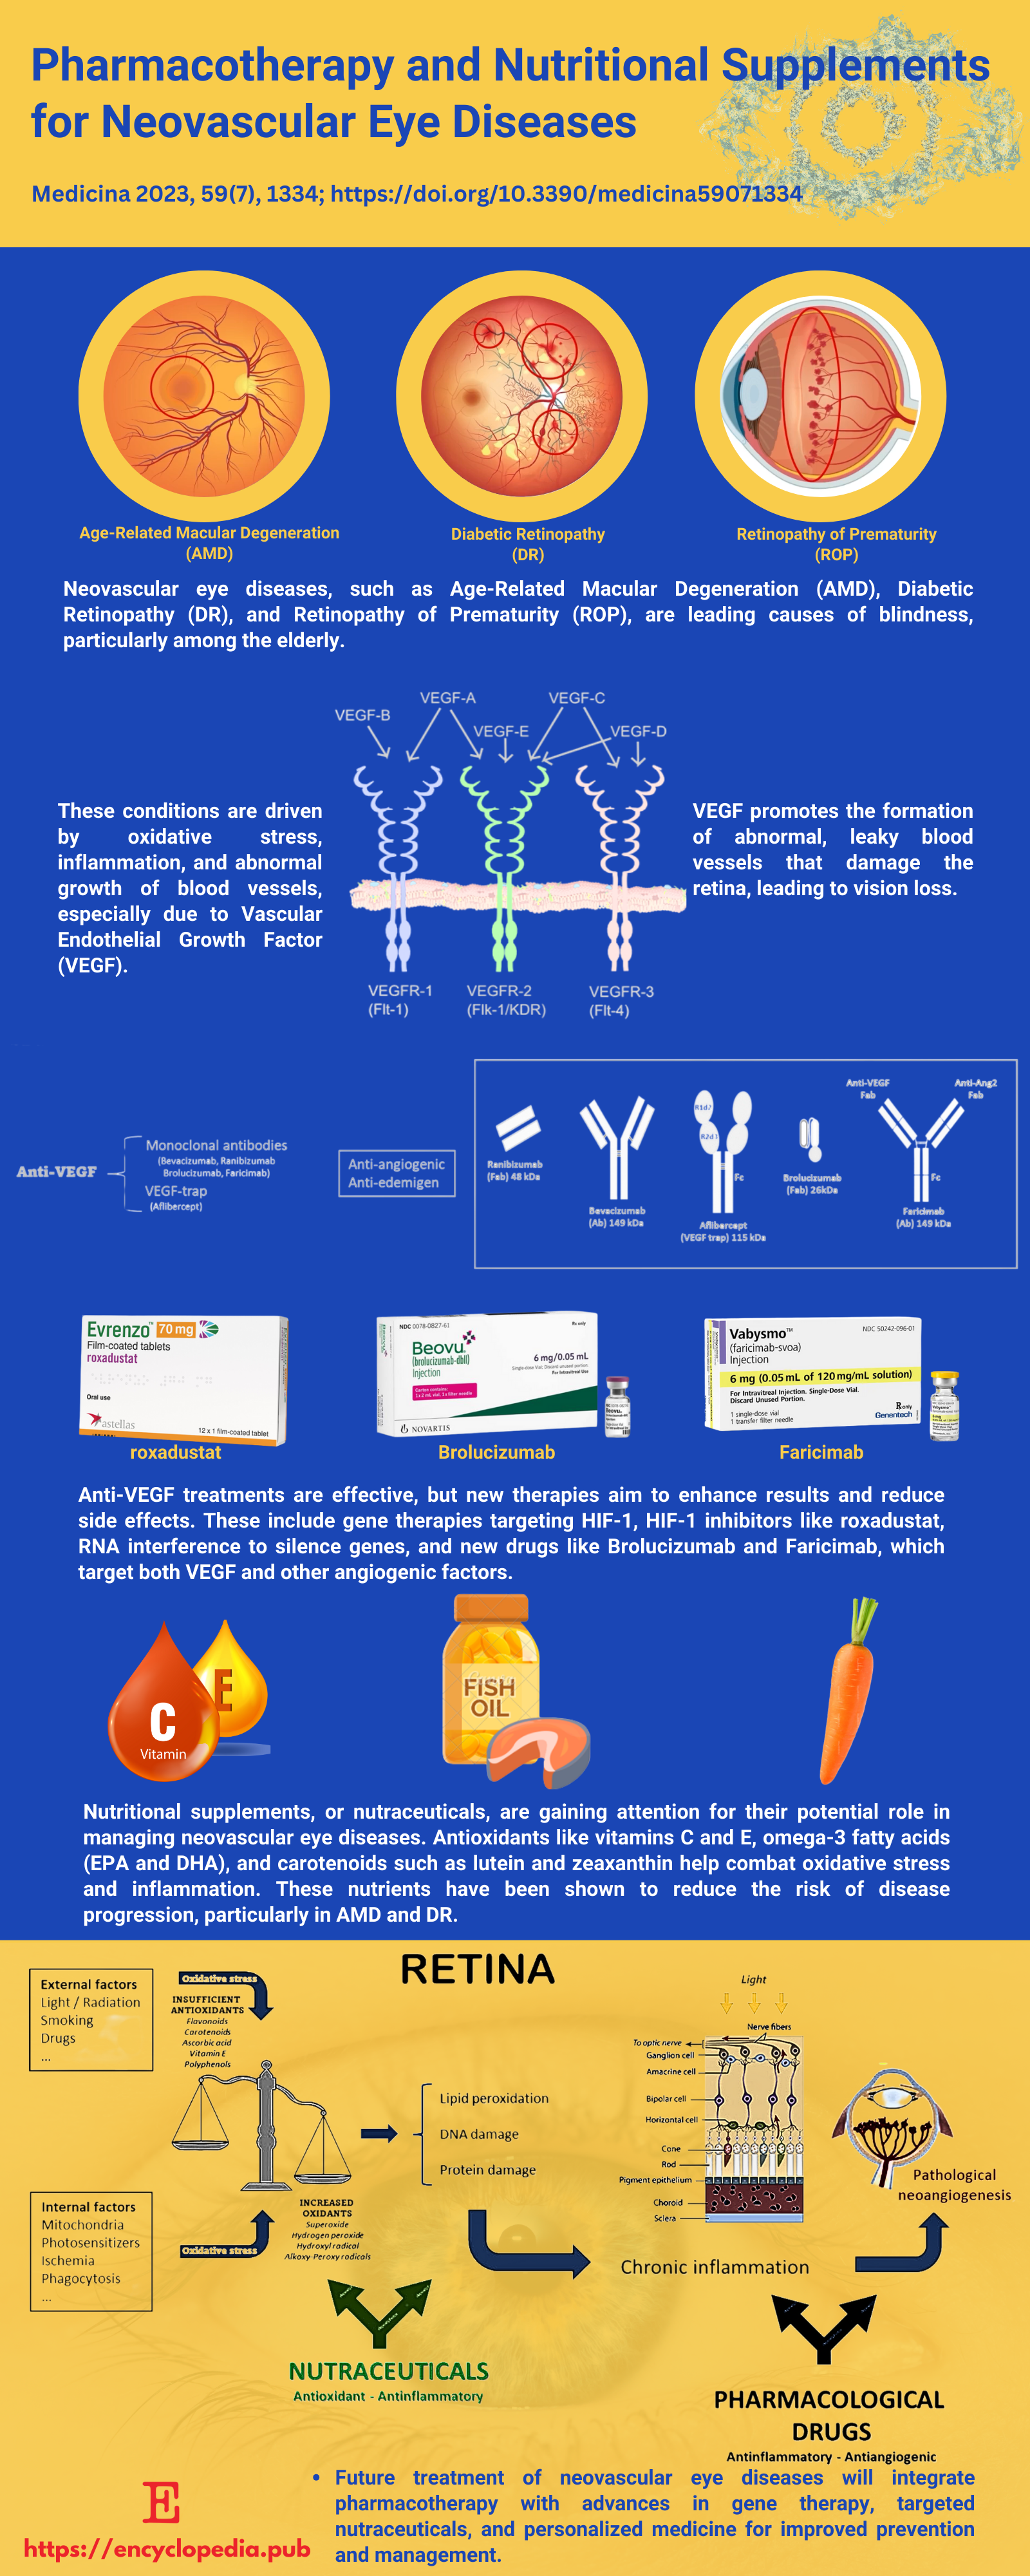
Source: Encyclopedia Scientific Infographic (https://encyclopedia.pub/image/3247)
If you want to see more infographic examples, please visit: https://encyclopedia.pub/image_gallery/6.
6. Contact
Email: office@encyclopedia.pub
Homepage: https://encyclopedia.pub
QR code: