Your browser does not fully support modern features. Please upgrade for a smoother experience.
Please note this is an old version of this entry, which may differ significantly from the current revision.
Computer-aided diagnostic (CAD) systems can assist radiologists in detecting coal workers’ pneumoconiosis (CWP) in their chest X-rays. Early diagnosis of the CWP can significantly improve workers’ survival rate. The feature extraction and detection approaches of computer-based analysis in CWP using chest X-ray radiographs (CXR) can be summarised into three categories: classical methods including computer and international labor organization (ILO) classification-based detection; traditional machine learning methods; and CNN methods.
- coal workers’ pneumoconiosis
- computer-aided diagnostic
- occupational lung disease
- pneumoconiosis
- black lung
- machine learning
- deep learning
- chest X-ray radiographs
1. Introduction
Pneumoconiosis is an occupational lung disease and a group of interstitial lung diseases (ILD) caused by chronic inhalation of dust particles, often in mines and from agriculture, that can damage both lungs and is not reversible [1][2][3]. There are three important occupational lung diseases, coal worker pneumoconiosis (CWP), asbestosis, and silicosis, seen in Australia [4]. CWP (commonly known as black lung (BL)) is mainly caused by long-term experience with coal dust, which is similar to silicosis lung disease caused by silica and asbestos dust. Pneumoconiosis, including CWP, asbestosis, and silicosis, killed 125,000 people worldwide between 1990 and 2010, according to the Global Burden of Disease (GBD) [5]. The national mortality analysis from 1979–2002 reports that over 1000 people have died in Australia due to pneumoconiosis, with CWP, asbestosis, and silicosis representing 6%, 56%, and 38% of the total, respectively. Pneumoconiosis has increased due to poor dust control and a lack of workplace safety measures [6][7][8][9].
In clinical imaging, computer-aided diagnosis (CADx), also known as computer-aided detection (CADe), is a system developed for the computer to help make quick decisions for future treatment [10][11]. Medical image analysis is now an essential assessment for detecting possible clinical abnormalities at an earlier stage. CAD systems help to improve diagnostic image systems, visualising suspicious parts and highlighting the most affected area of images in X-rays, CT-scans, ultrasounds, and MRI [12][13].
Standard Classification of Pneumoconiosis
The abnormality on a chest X-ray of the lung is signified by an increase or decrease in density areas. The chest X-ray lung abnormalities with increased density are also known as pulmonary opacities. Pulmonary opacities have three major patterns: consolidation, interstitial, and atelectasis. Among them, interstitial patterns of pulmonary opacities are mainly responsible for BL disease [14][15][16]. According to ILO classification [17], there are two types of abnormalities, parenchymal and pleural, seen for all types of pneumoconiosis, such as our target research topic BL disease or CWP.
The ILO has categorised pneumoconiosis into 0, 1, 2, and 3 stages, where 0 is normal and 3 is the most complicated stage of the disease. The stage of the disease is indicated by the profusion of small and large opacities, which may be round or irregularly shaped, which presents the parenchymal abnormality. The ILO classifies the size (diameter) of small rounded opacities as p, q, or r, indicative of diameters: p≤1.5, 1.5≤q≤3, 3≤r≤10 mm and defined by the presence on the six significant zones (upper, middle, lower) in both left and right lungs. On the other hand, the size (widths) of small irregular opacities is illustrated by the letters shown in standard radiograph areas, s≤1.5, 1.5≤t≤3, 3≤u≤10 mm. Opacities with a dimension of more than 10 mm are defined as large opacities. They are divided into three major categories, defined as 0≤A≤50 mm, 50≤B≤Area(RUZ), and 50≤C≥Area(RUZ), where RUZ indicates the area of the right upper zone (RUZ).
In pleural abnormalities, the ILO has shown that the parietal pleura is seen in the chest wall, diaphragm, and other sites of the lungs that can diffuse the thickness and decay at the appropriate angle of the lung frame. Figure 1 summarises parenchymal and pleural abnormalities, followed by standard opacities and their perfusion measurements.
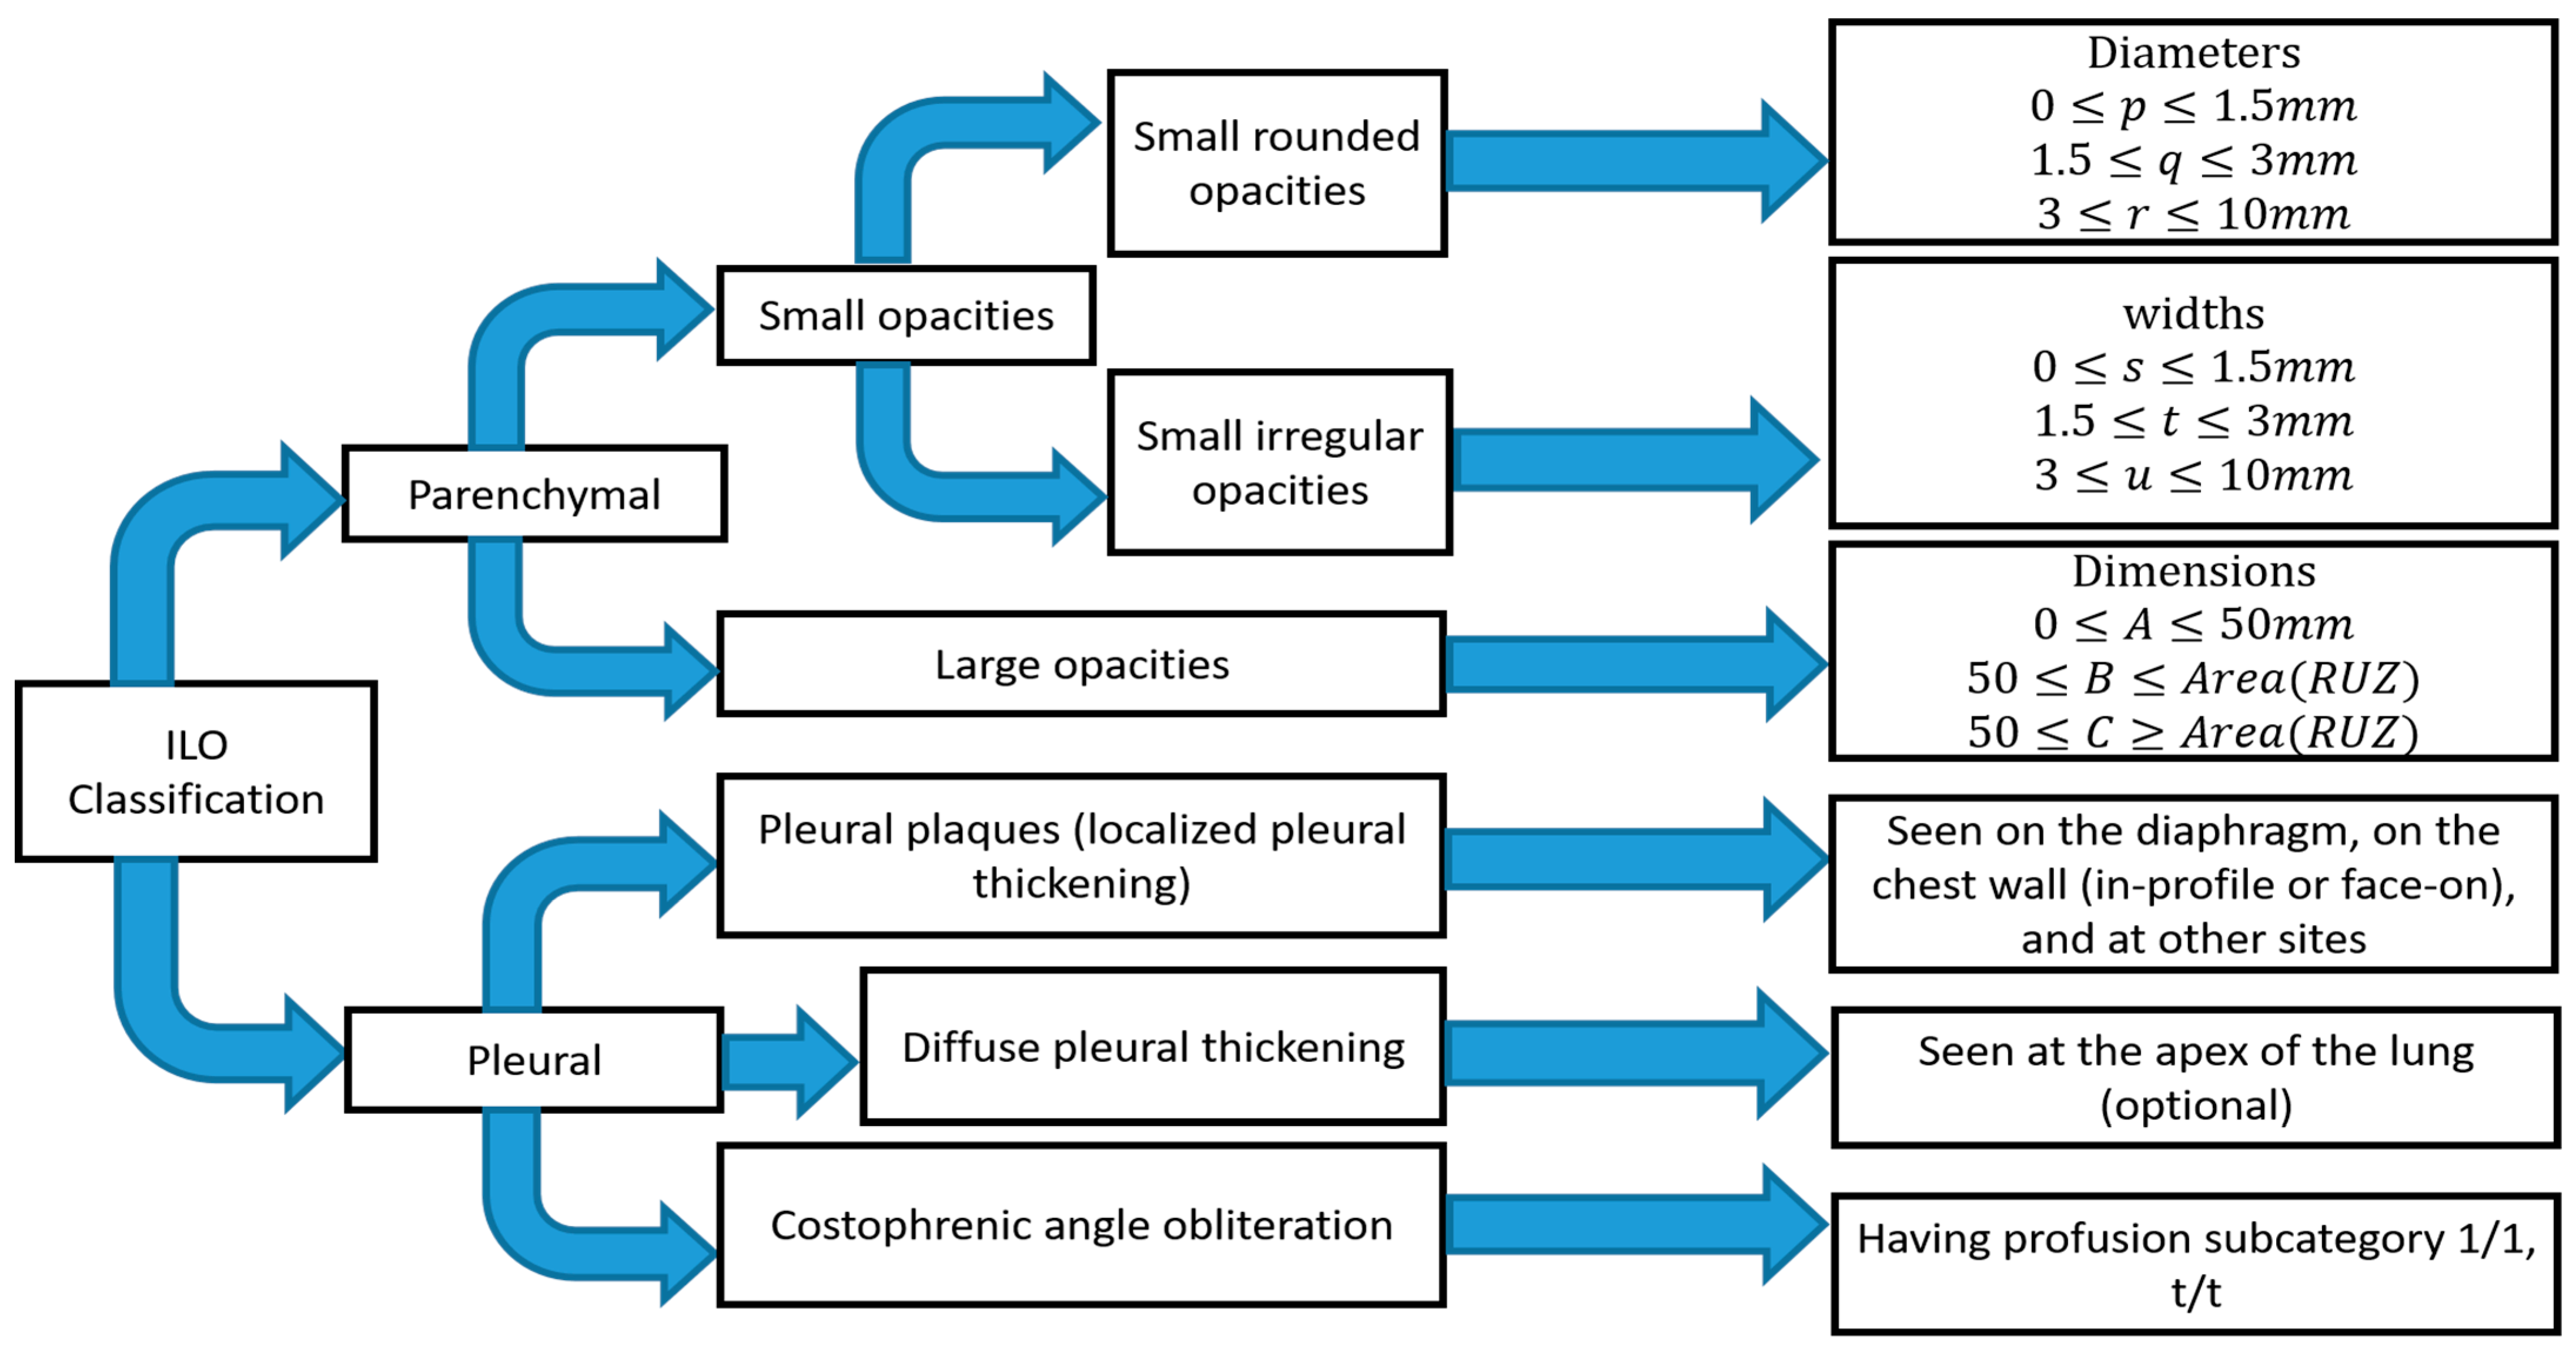
Figure 1. Summary of ILO standard classification of pneumoconiosis.
It is difficult for radiologists to classify pneumoconiosis in both types of abnormalities. The measurement of the size and shape of all regular and irregular opacities is quite difficult, especially in the earlier stage of CWP disease [18]. The radiographic changes in some blood vessels forming the opacities’ shape and the size of pneumoconiosis are difficult to diagnose. In addition, pleural plaque on plain chest radiographs shown in the shadows of ribs may lead to misclassification of conditions consistent with pneumoconiosis [19][20]. Therefore, the development of significant computer-aided diagnosis (CAD) schemes is necessary to reduce the risk in the workplace and improve the chest screening for pneumoconiosis diseases.
2. Detection Approach of CWP
2.1. Classical Methods
In the past year, the texture features were mostly classified using classical computer-based methods and ILO-based standard classification [21][22][23][24][25][26][27][28][29][30][31], as shown in Figure 2. A linear discriminant analysis (LDA) and partial least squares (PLS) regression function has performed this in computer-based classification methods [21][27][28][29][30][31]. LDA and PLS are the classic statistical approaches for reducing the dimensions of characteristics to improve the classification. Besides this classification method, some researchers used the classical ILO standard-based guideline as shown in Figure 2. The profusion of small round opacities and ILO extent properties indicated normal and abnormal classes. Neural networks have been applied to find the shape and size of round opacities from ROI images [32][33][34][35]. The X-ray abnormalities were categorised and compared with the results of the standard ILO measurement of the size and shape of the round opacities, as in Figure 1.
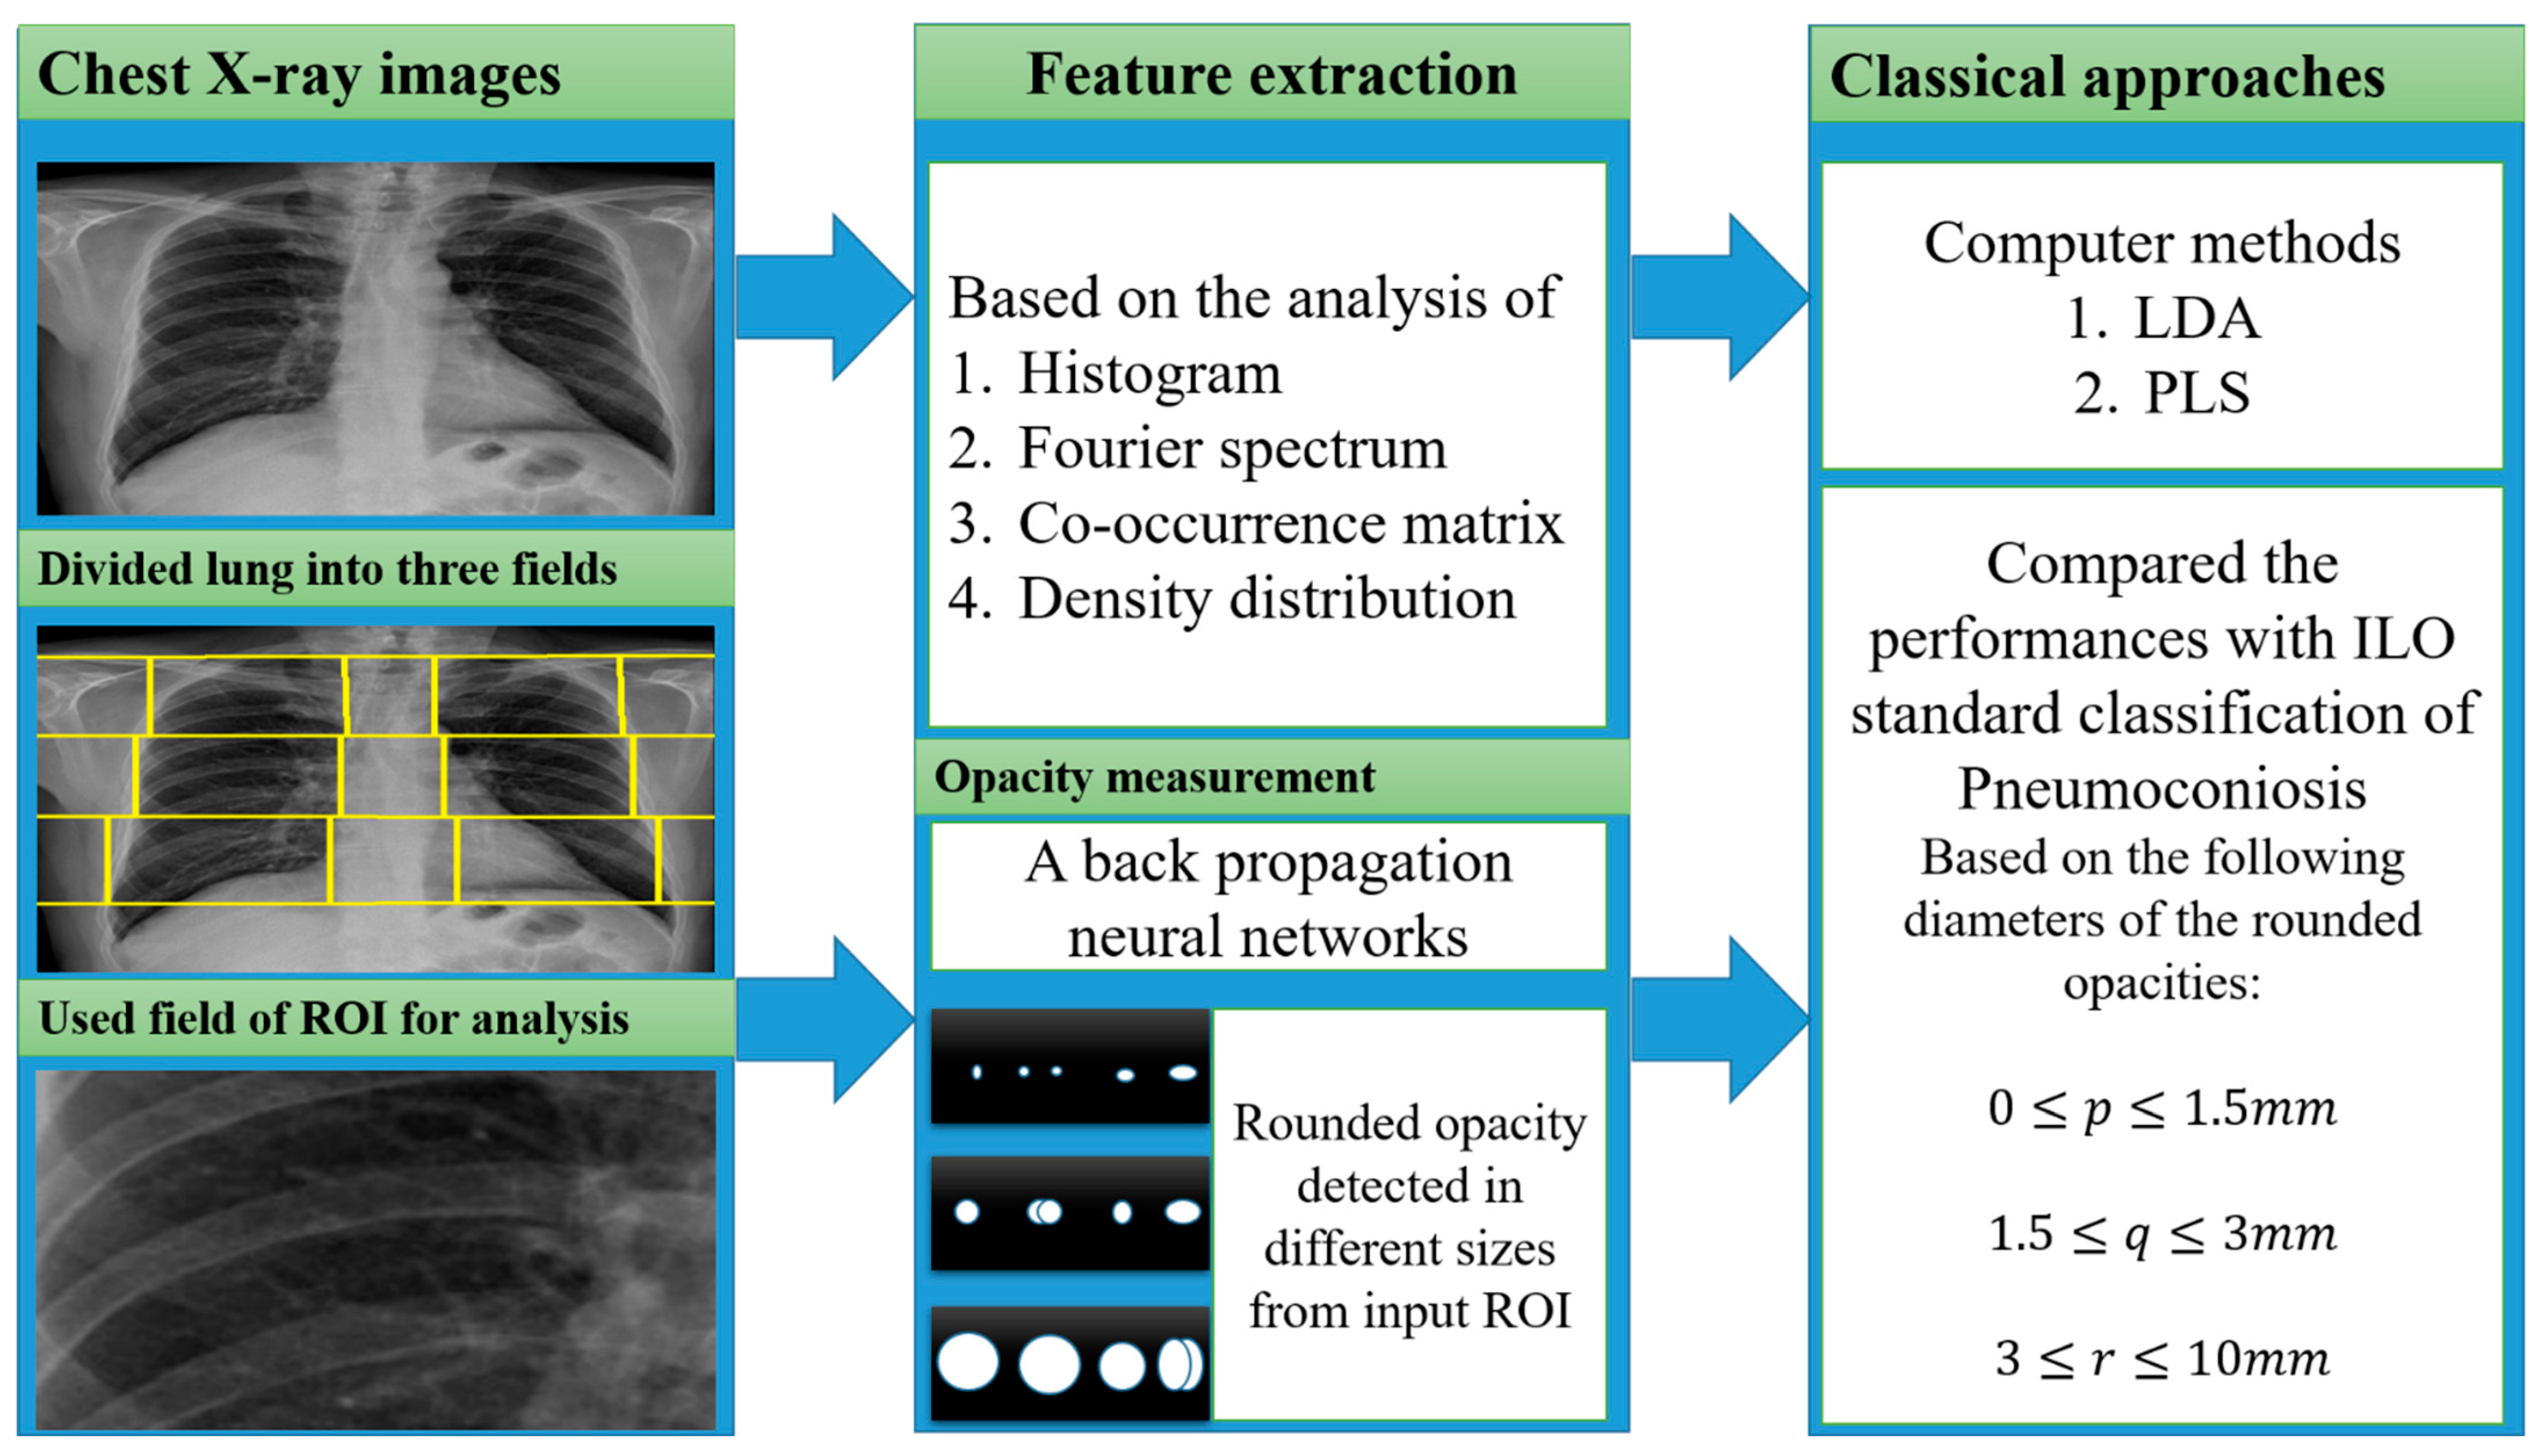
Figure 2. The illustration of the classical approaches was used for CWP detection.
A summary of all classic approaches corresponding to feature extractions with various inputs is shown in Figure 2.
2.2. Traditional Machine Learning
Most texture features, from Fourier spectrum, co-occurrence matrix, histogram, wavelet transform, and density distribution, are classified using different traditional machine learning classifiers, namely support vector machines (SVM) [36][37][38][39][40][41][42][43][44][45], decision trees (DT) [37][39], random trees (RT) [36][38][42][44], artificial neural networks (ANNs) [46][47][48], K-nearest neighbors (KNN) [49], self-organizing maps (SOM) [49], backpropagation (BP), radial basis function (RBF) neural networks (NN) [36][38][42][44][49][50], and ensemble classifiers [37][41][43]. Figure 3 shows how the researchers connected various texture features with traditional machine learning classifiers to detect CWP in CXR. A set of features was derived from the corresponding transformation of various X-ray inputs. Transformation methods were discussed separately in the feature analysis section above.
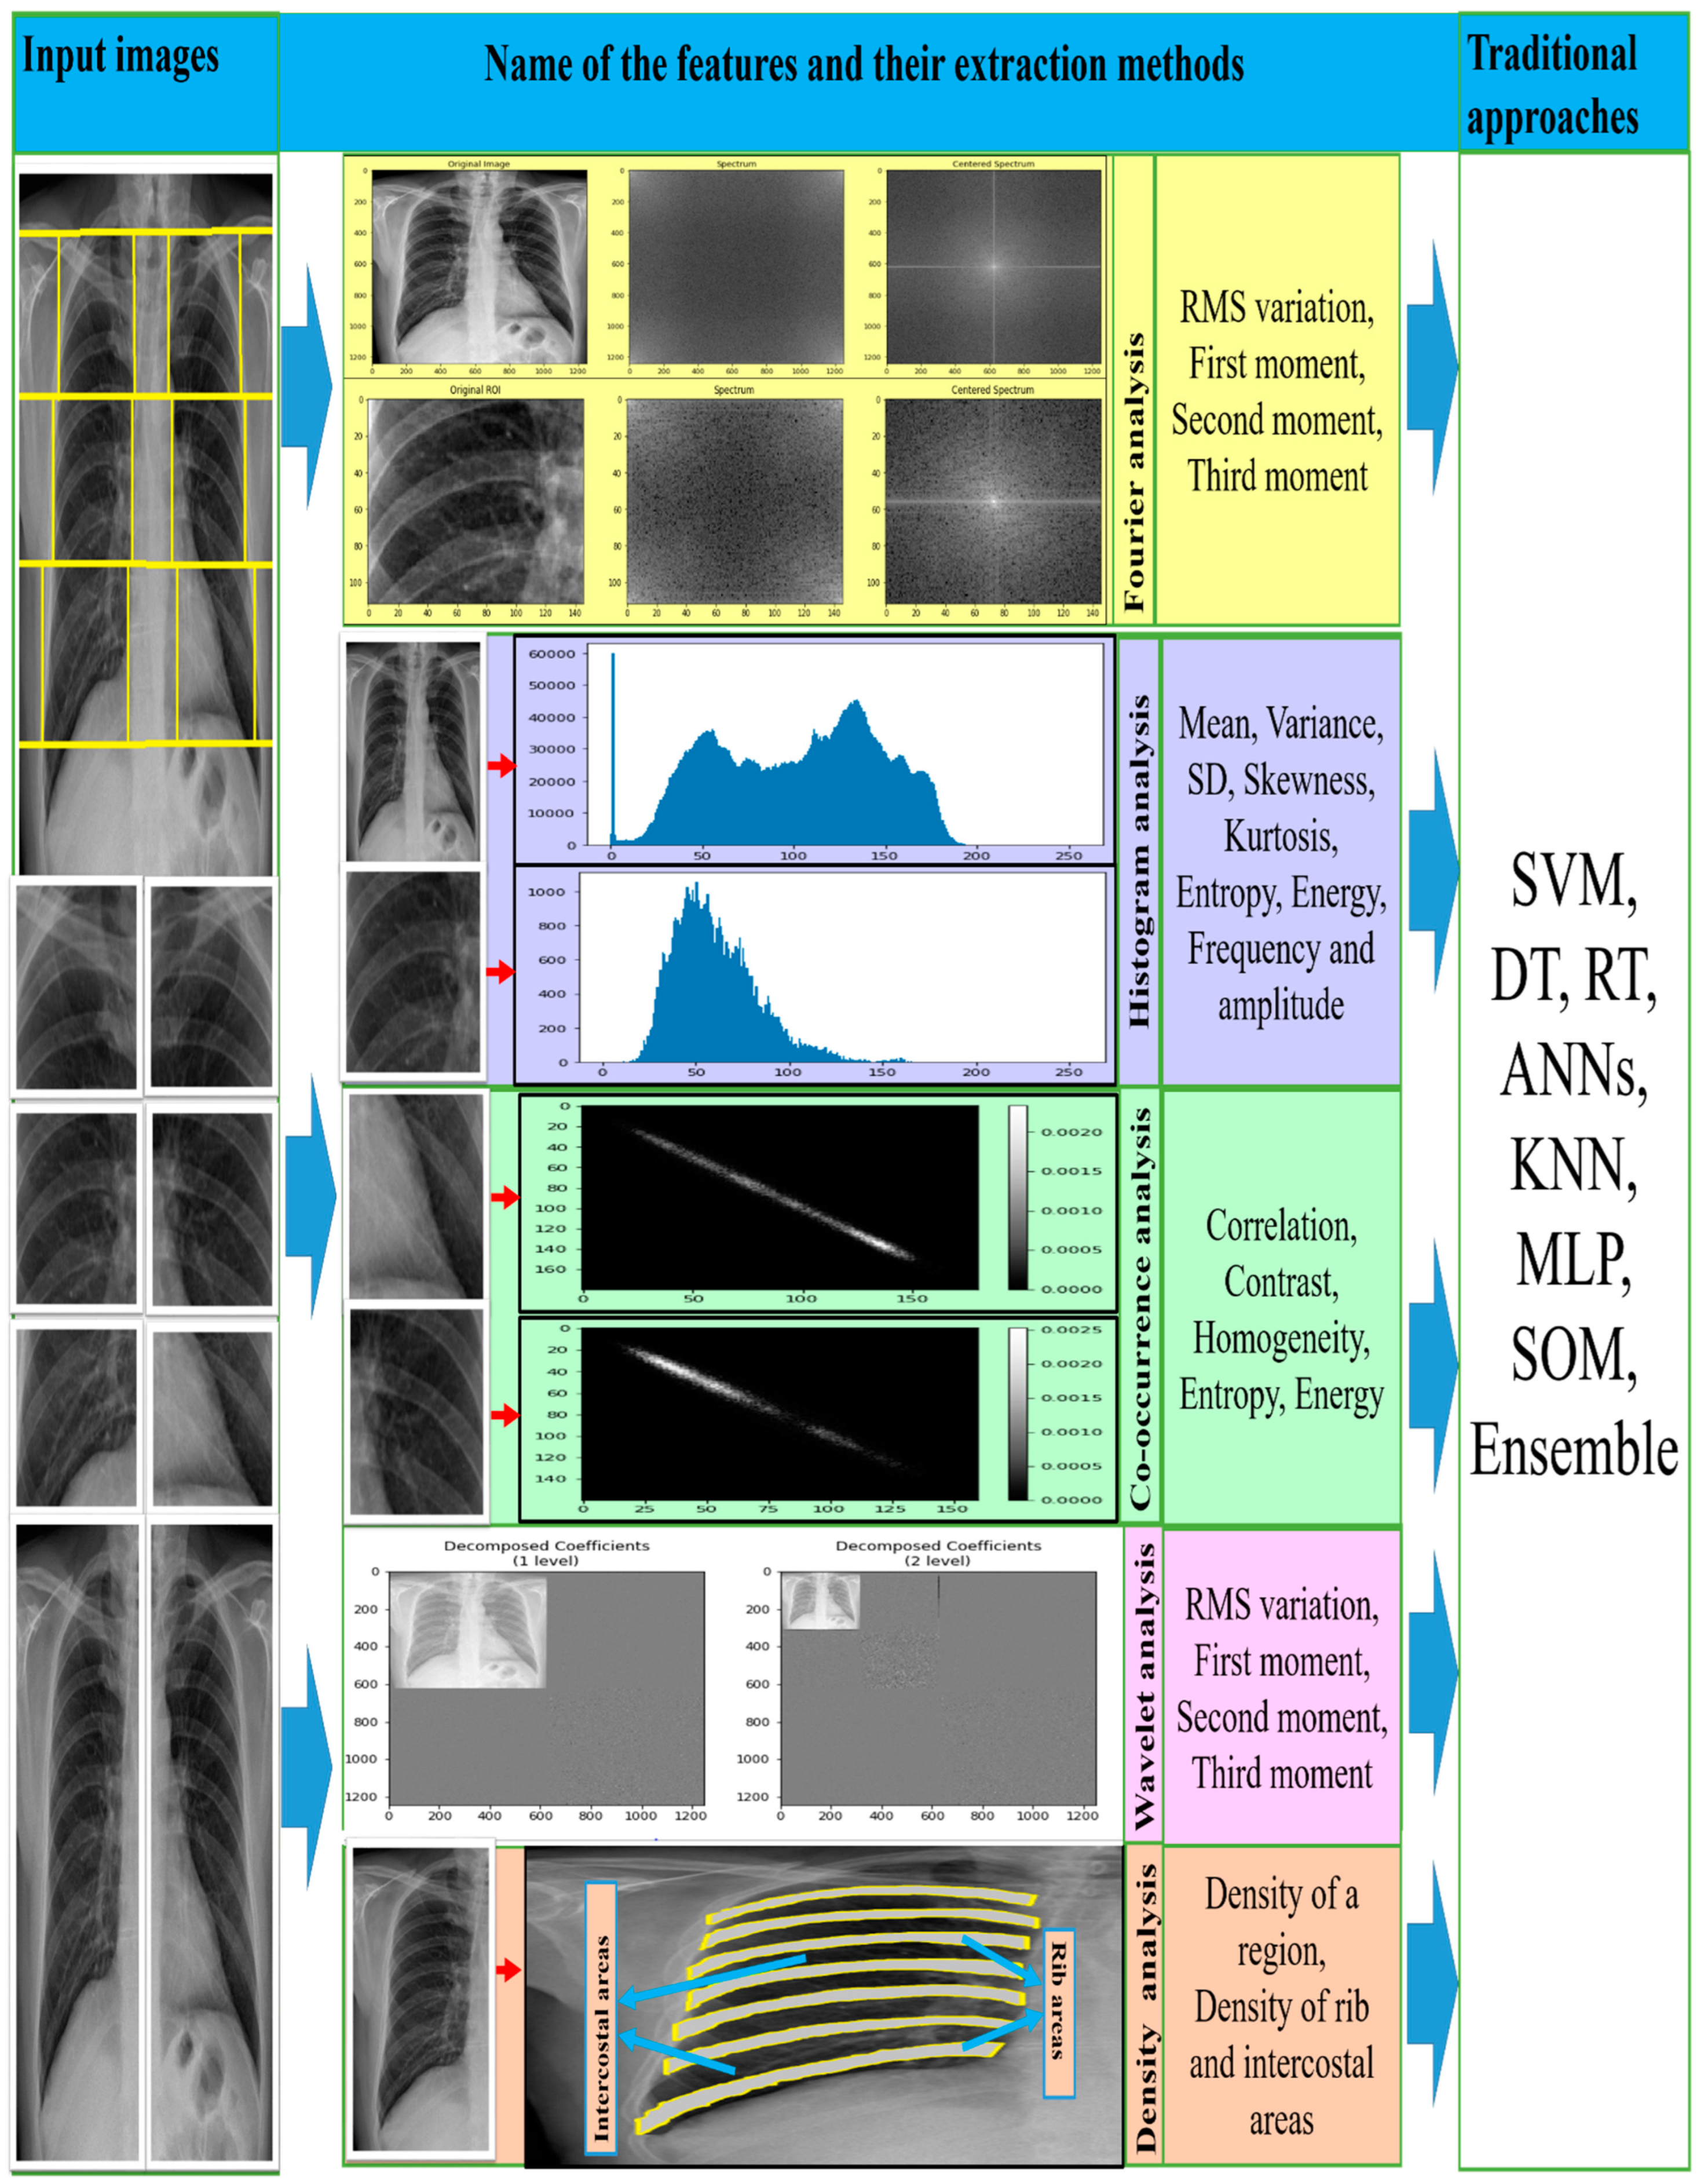
Figure 3. The illustration of the traditional approaches used for CWP detection.
It is found that SVM performed best compared to the other classifiers on ROI-based texture features, which also indicated that SVM with a radial basis function (RBF) kernel is more noticeable than linear and polynomial kernel functions. The maximum AUC (area under the curve) value of the receiver operating characteristic (ROC) curve indicated the SVM classifier’s ability to classify texture features. It was also seen that an ensemble of multiple classifiers would improve detection performance. In [37][41][43], the authors proposed an ensemble of multi-classifier and multi ROI decisions for the diagnosis of CWP, which improved the overall classification result.
The four feature extraction methods (Fourier spectrum, wavelet, histogram, and co-occurrence matrix analysis) outperformed classical approaches with the traditional machine learning classifiers. Among all classifiers, the SVM exceeded the others in terms of histograms and co-occurrence characteristics of chest X-ray radiographs [41][43][45][51]. Moreover, SVM was used in the maximum and a bigger number of CWP data sets in the literature, demonstrating average accuracy, specificity, recall, and area under the curve (AUC).
2.3. CNN-Based
For the period 2019–2021, eights studies were found that proposed using deep convolutional neural network (CNN) models to classify CWP (black lung disease) in CXR [52][53][54][55][56][57][58][59]. They used different pre-trained deep learning models for non-textured feature extraction then applied a fully connected layer with binary classifier for normal or abnormal (black lung) classification. Over the past few years, various CNN models, such as VGG16 [60], VGG19, AlexNet [61], Inception [62], Xception [63], ResNet50 [64], DenseNet121 [65], and CheXNet121 [66], have been developed based on the ImageNet database classification results. Each CNN model consists of two main parts: the base (top-removed), and the other is called the top. The base part of the CNN model is used as an automatic deep feature extractor and consists of a set of convolutional, normalisation, and pooling layers. The top part is used as a deep classifier and consists of a number of dense layers that are fully connected to the outputs of the base part of the model, as shown in Figure 4.
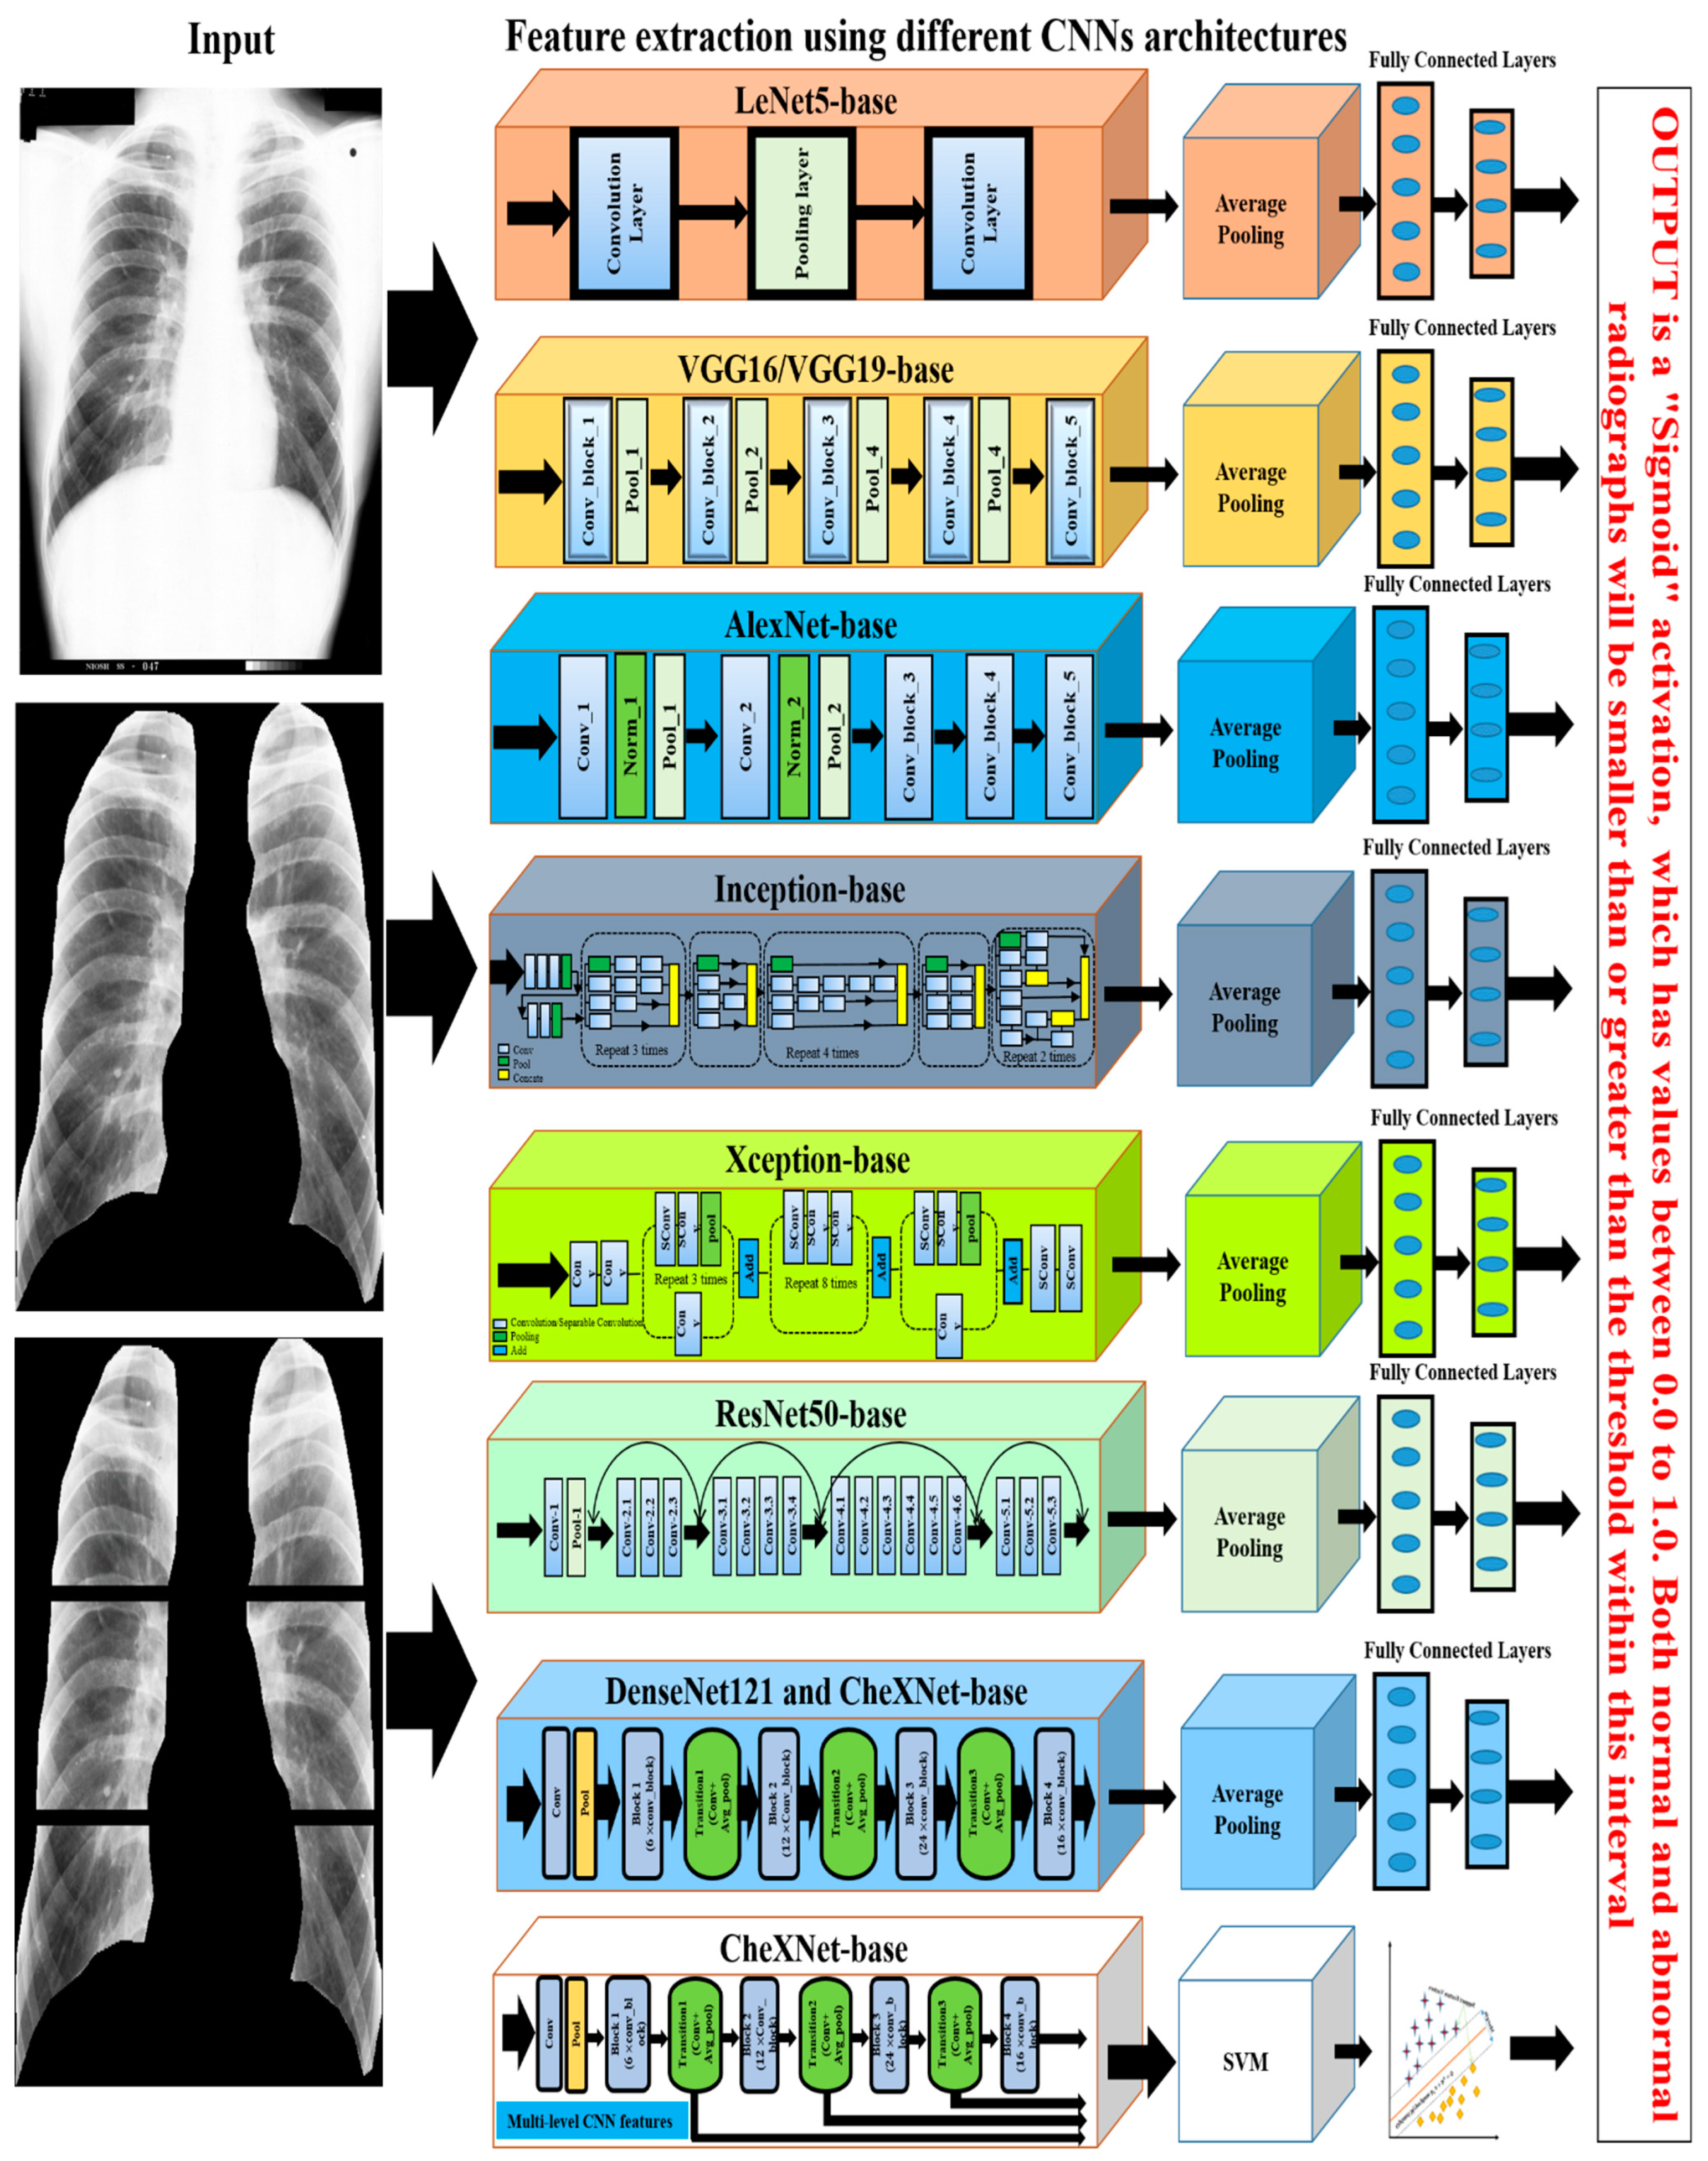
Figure 4. The illustration of the deep learning approaches used for CWP detection.
Devnath et al., investigated the CNN classifier performance with and without deep transfer learning, which suggested that the transfer learning with the deep CNN technique will improve the classification of black lung disease with a small dataset [57][58]. Arzhaeva et al., show that CNN performed better than the statistical analysis methods, including texture features from ROIs and ILO standard classification of pneumoconiosis in CXR [52].
Zheng et al. [59] applied transfer learning of five CNN models, LeNet [67], AlexNet [61], and three versions of GoogleNet [62], for CAD of CWP in a CXR films dataset. They showed that the integrated GoogleNetCF performed better than others on their dataset. Zhang et al. [53] implemented the ResNet [64] model to categorise normal and different stages of pneumoconiosis using six subregions of the lung, as shown by an example in the left column of Figure 4. They verified the best CNN performance with two groups of expert radiologists. Wang et al. also verified the performance of the Inception-V3 model with two certified radiologists [56] and found that CNN is more efficient than human performance. More recently, Devnath et al. [54] proposed a novel method for CWP detection using multi-level features analysis from the CNN architecture as shown in the bottom section of Figure 4. They applied transfer learning of the CheXNet [66] model to extract miltidimensional deep features from the different levels of their architecture. They then used these features to the traditional machine learning classifier, SVM. This intregrated framework outperformed the state-of-art different traditional machine and deep learning methods.
Non-texture features were extracted using different CNN approaches. Among all detection approaches, deep transfer learning of GoogleNet, ResNet, and CheXNet achieved an average accuracy of more than 92% in the detection of CWP from chest X-ray radiographs. Overall analysis revealed that deep learning methods outperformed other traditional and classical approaches in CWP detection.
This entry is adapted from the peer-reviewed paper 10.3390/ijerph19116439
References
- Cullinan, P.; Reid, P. Pneumoconiosis. Prim. Care Respir. J. 2013, 22, 249–252.
- Fishwick, D.; Barber, C. Pneumoconiosis. Medicine 2012, 40, 310–313.
- Schenker, M.B.; Pinkerton, K.E.; Mitchell, D.; Vallyathan, V.; Elvine-Kreis, B.; Green, F.H. Pneumoconiosis from Agricultural Dust Exposure among Young California Farmworkers. Environ. Health Perspect. 2009, 117, 988–994.
- Smith, D.R.; Leggat, P.A. 24 Years of Pneumoconiosis Mortality Surveillance in Australia. J. Occup. Health 2006, 48, 309–313.
- Lozano, R.; Naghavi, M.; Foreman, K.; Lim, S.; Shibuya, K.; Aboyans, V.; Abraham, J.; Adair, T.; Aggarwal, R.; Ahn, S.Y.; et al. Global and regional mortality from 235 causes of death for 20 age groups in 1990 and 2010: A systematic analysis for the Global Burden of Disease Study 2010. Lancet 2012, 380, 2095–2128.
- Zosky, G.; Hoy, R.F.; Silverstone, E.J.; Brims, F.J.; Miles, S.; Johnson, A.R.; Gibson, P.; Yates, D.H. Coal workers’ pneumoconiosis: An Australian perspective. Med. J. Aust. 2016, 204, 414–418.
- Hall, N.B.; Blackley, D.J.; Halldin, C.N.; Laney, A.S. Current Review of Pneumoconiosis Among US Coal Miners. Curr. Environ. Health Rep. 2019, 2019, 1–11.
- Castranova, V.; Vallyathan, V. Silicosis and coal workers’ pneumoconiosis. Environ. Health Perspect. 2000, 108, 675–684.
- Joy, G.J.; Colinet, J.F. Coal Mine Respirable Dust Control View project Dust control with canopy air curtain View project Mınıng engıneerıng Coal workers’ pneumoconiosis prevalence disparity between Australia and the United States. Min. Eng. Mag. 2012, 64, 71.
- Doi, K. Computer-Aided Diagnosis in Medical Imaging: Historical Review, Current Status and Future Potential. Comput. Med Imaging Graph. 2007, 31, 198–211.
- Li, Q.; Nishikawa, R.M. (Eds.) Computer-Aided Detection and Diagnosis in Medical Imaging; Taylor & Francis: Oxford, UK, 2015.
- Chen, C.-M.; Chou, Y.-H.; Tagawa, N.; Do, Y. Computer-Aided Detection and Diagnosis in Medical Imaging. Comput. Math. Methods Med. 2013, 2013, 1–2.
- Halalli, B.; Makandar, A. Computer Aided Diagnosis—Medical Image Analysis Techniques. In Breast Imaging; InTech: London, UK, 2018.
- Jones, J.; Hancox, J. Reticular Interstitial Pattern, Radiology Reference Article, Radiopaedia.org. Available online: https://radiopaedia.org/articles/reticular-interstitial-pattern (accessed on 7 August 2020).
- Oikonomou, A.; Prassopoulos, P. Mimics in chest disease: Interstitial opacities. Insights into Imaging 2012, 4, 9–27.
- Nickson, C. Pulmonary Opacities on Chest X-ray, LITFL-CCC Differential Diagnosis. 2019. Available online: https://litfl.com/pulmonary-opacities-on-chest-x-ray/ (accessed on 6 August 2020).
- Occupational Safety and Health Series No. 22 (Rev. 2011), “Guidelines for the use of the ILO International Classification of Radiographs of Pneumoconioses, Revised Edition 2011”. 2011. Available online: http://www.ilo.org/global/topics/safety-and-health-at-work/resources-library/publications/WCMS_168260/lang--en/index.htm (accessed on 7 August 2020).
- Chong, S.; Lee, K.S.; Chung, M.J.; Han, J.; Kwon, O.J.; Kim, T.S. Pneumoconiosis: Comparison of Imaging and Pathologic Findings. RadioGraphics 2006, 26, 59–77.
- Sun, J.; Weng, D.; Jin, C.; Yan, B.; Xu, G.; Jin, B.; Xia, S.; Chen, J. The Value of High Resolution Computed Tomography in the Diagnostics of Small Opacities and Complications of Silicosis in Mine Machinery Manufacturing Workers, Compared to Radiography. J. Occup. Health 2008, 50, 400–405.
- Ngatu, N.R.; Suzuki, S.; Kusaka, Y.; Shida, H.; Akira, M.; Suganuma, N. Effect of a Two-hour Training on Physicians’ Skill in Interpreting Pneumoconiotic Chest Radiographs. J. Occup. Health 2010, 52, 294–301.
- Murray, V.; Pattichis, M.S.; Davis, H.; Barriga, E.S.; Soliz, P. Multiscale AM-FM analysis of pneumoconiosis X-ray images. In Proceedings of the International Conference on Image Processing (ICIP), Cairo, Egypt, 7–10 November 2009; pp. 4201–4204.
- Ledley, R.S.; Huang, H.; Rotolo, L.S. A texture analysis method in classification of coal workers’ pneumoconiosis. Comput. Biol. Med. 1975, 5, 53–67.
- Katsuragawa, S.; Doi, K.; MacMahon, H.; Nakamori, N.; Sasaki, Y.; Fennessy, J.J. Quantitative computer-aided analysis of lung texture in chest radiographs. RadioGraphics 1990, 10, 257–269.
- Chen, X.; Hasegawa, J.-I.; Toriwaki, J.-I. Quantitative diagnosis of pneumoconiosis based on recognition of small rounded opacities in chest X-ray images. In Proceedings of the International Conference on Pattern Recognition, Rome, Italy, 14 May–17 November 1988; pp. 462–464.
- Kobatake, H.; Oh’Ishi, K.; Miyamichi, J. Automatic diagnosis of pneumoconiosis by texture analysis of chest X-ray images. In Proceedings of the IEEE International Conference on Acoustics, Speech, and Signal Processing; Institute of Electrical and Electronics Engineers, Dalas, TX, USA, 6–9 April 1987; Volume 12, pp. 610–613.
- Savol, A.M.; Li, C.C.; Hoy, R.J. Computer-aided recognition of small rounded pneumoconiosis opacities in chest X-rays. IEEE Trans. Pattern Anal. Mach. Intell. 1980, PAMI-2, 479–482.
- Turner, A.F.; Kruger, R.P.; Thompson, W.B. Automated computer screening of chest radiographs for pneumoconiosis. Investig. Radiol. 1976, 11, 258–266.
- Jagoe, J.R.; Paton, K.A. Measurement of Pneumoconiosis by Computer. IEEE Trans. Comput. 1976, C-25, 95–97.
- Jagoe, J.R.; Paton, K.A. Reading chest radiographs for pneumoconiosis by computer. Occup. Environ. Med. 1975, 32, 267–272.
- Hall, E.L.; Crawford, W.O.; Roberts, F.E. Computer Classification of Pneumoconiosis from Radiographs of Coal Workers. IEEE Trans. Biomed. Eng. 1975, BME-22, 518–527.
- Kruger, R.P.; Thompson, W.B.; Turner, A.F. Computer Diagnosis of Pneumoconiosis. IEEE Trans. Syst. Man Cybern. 1974, 4, 40–49.
- Kondo, H.; Kouda, T. Detection of pneumoconiosis rounded opacities using neural network. In Proceedings of the Annual Conference of the North American Fuzzy Information Processing Society—NAFIPS, Vancouver, BC, Canada, 25–28 July 2001; Volume 3, pp. 1581–1585.
- Kondo, H.; Kouda, T. Computer-aided diagnosis for pneumoconiosis using neural network. Int. J. Biomed. Soft Comput. Hum. Sci. Off. J. Biomed. Fuzzy Syst. Assoc. 2001, 7, 13–18.
- Kondo, H.; Zhang, L.; Koda, T. Computer Aided Diagnosis for Pneumoconiosis Radiograps Using Neural Network. Int. Arch. Photogramm. Remote Sens. 2000, 33, 453–458.
- Kouda, T.; Kondo, H. Automatic Detection of Interstitial Lung Disease using Neural Network. Int. J. Fuzzy Log. Intell. Syst. 2002, 2, 15–19.
- Abe, K.; Minami, M.; Miyazaki, R.; Tian, H. Application of a Computer-aid Diagnosis of Pneumoconiosis for CR X-ray Images. J. Biomed. Eng. Med Imaging 2014, 1, 606.
- Zhu, B.; Luo, W.; Li, B.; Chen, B.; Yang, Q.; Xu, Y.; Wu, X.; Chen, H.; Zhang, K. The development and evaluation of a computerized diagnosis scheme for pneumoconiosis on digital chest radiographs. Biomed. Eng. Online 2014, 13, 141.
- Abe, K. Computer-Aided Diagnosis of Pneumoconiosis X-ray Images Scanned with a Common CCD Scanner. Autom. Control Intell. Syst. 2013, 1, 24.
- Zhu, B.; Chen, H.; Chen, B.; Xu, Y.; Zhang, K. Support Vector Machine Model for Diagnosing Pneumoconiosis Based on Wavelet Texture Features of Digital Chest Radiographs. J. Digit. Imaging 2013, 27, 90–97.
- Masumoto, Y.; Kawashita, I.; Okura, Y.; Nakajima, M.; Okumura, E.; Ishida, T. Computerized Classification of Pneumoconiosis Radiographs Based on Grey Level Co-occurrence Matrices. Jpn. J. Radiol. Technol. 2011, 67, 336–345.
- Yu, P.; Xu, H.; Zhu, Y.; Yang, C.; Sun, X.; Zhao, J. An Automatic Computer-Aided Detection Scheme for Pneumoconiosis on Digital Chest Radiographs. J. Digit. Imaging 2010, 24, 382–393.
- Nakamura, M.; Abe, K.; Minami, M. Extraction of Features for Diagnosing Pneumoconiosis from Chest Radiographs Obtained with a CCD Scanner. J. Digit. Inf. Manag. 2010, 8, 147–152.
- Sundararajan, R.; Xu, H.; Annangi, P.; Tao, X.; Sun, X.; Mao, L. A multiresolution support vector machine based algorithm for pneumoconiosis detection from chest radiographs. In Proceedings of the 2010 IEEE International Symposium on Biomedical Imaging: From Nano to Macro, Rotterdam, The Netherlands, 14–17 April 2010; pp. 1317–1320.
- Nakamura, M.; Abe, K.; Minami, M. Quantitative evaluation of pneumoconiosis in chest radiographs obtained with a CCD scanner. In Proceedings of the 2nd International Conference on the Applications of Digital Information and Web Technologies, ICADIWT 2009, London, UK, 4–6 August 2009; pp. 646–651.
- Yu, P.; Zhao, J.; Xu, H.; Yang, C.; Sun, X.; Chen, S.; Mao, L. Computer Aided Detection for Pneumoconiosis Based on Histogram Analysis. In Proceedings of the 2009 1st International Conference on Information Science and Engineering, ICISE 2009, Nanjing, China, 26–28 December 2009; pp. 3625–3628.
- Okumura, E.; Kawashita, I.; Ishida, T. Development of CAD based on ANN analysis of power spectra for pneumoconiosis in chest radiographs: Effect of three new enhancement methods. Radiol. Phys. Technol. 2014, 7, 217–227.
- Cai, C.X.; Zhu, B.Y.; Chen, H. Computer-aided diagnosis for pneumoconiosis based on texture analysis on digital chest radiographs. Appl. Mech. Mater. 2013, 241, 244–247.
- Okumura, E.; Kawashita, I.; Ishida, T. Computerized Analysis of Pneumoconiosis in Digital Chest Radiography: Effect of Artificial Neural Network Trained with Power Spectra. J. Digit. Imaging 2010, 24, 1126–1132.
- Pattichis, M.; Christodoulou, C.; James, D.; Ketai, L.; Soliz, P. A screening system for the assessment of opacity profusion in chest radiographs of miners with pneumoconiosis. In Proceedings of the IEEE Southwest Symposium on Image Analysis and Interpretation, Sante Fe, NM, USA, 7–9 April 2002; pp. 130–133.
- Soliz, P.; Pattichis, M.; Ramachandran, J.; James, D.S. Computer-assisted diagnosis of chest radiographs for pneumoconioses. In Proceedings of the Medical Imaging 2001: Image Processing, San Diago, CA, USA, 17–22 February 2001; Volume 4322, pp. 667–675.
- Yu, P.; Zhao, J.; Xu, H.; Sun, X.; Mao, L. Computer Aided Detection for Pneumoconiosis Based on Co-Occurrence Matrices Analysis. In Proceedings of the 2009 2nd International Conference on Biomedical Engineering and Informatics, Tianjin, China, 17–19 October 2009; pp. 1–4.
- Arzhaeva, Y.; Wang, D.; Devnath, L.; Amirgholipour, S.K.; McBean, R.; Hillhouse, J.; Luo, S.; Meredith, D.; Newbigin, K. Development of Automated Diagnostic Tools for Pneumoconiosis Detection from Chest X-ray Radiographs; The Final Report Prepared for Coal Services Health and Safety Trust; Coal Services Health and Safety Trust: Sydney, Australia, 2019.
- Zhang, L.; Rong, R.; Li, Q.; Yang, D.M.; Yao, B.; Luo, D.; Zhang, X.; Zhu, X.; Luo, J.; Liu, Y.; et al. A deep learning-based model for screening and staging pneumoconiosis. Sci. Rep. 2021, 11, 2201.
- Devnath, L.; Luo, S.; Summons, P.; Wang, D. Automated detection of pneumoconiosis with multilevel deep features learned from chest X-Ray radiographs. Comput. Biol. Med. 2020, 129, 104125.
- Wang, D.; Arzhaeva, Y.; Devnath, L.; Qiao, M.; Amirgholipour, S.; Liao, Q.; McBean, R.; Hillhouse, J.; Luo, S.; Meredith, D.; et al. Automated Pneumoconiosis Detection on Chest X-Rays Using Cascaded Learning with Real and Synthetic Radiographs. In Proceedings of the 2020 Digital Image Computing: Techniques and Applications (DICTA), Melbourne, Australia, 29 November–1 December 2020; pp. 1–6.
- Wang, X.; Yu, J.; Zhu, Q.; Li, S.; Zhao, Z.; Yang, B.; Pu, J. Potential of deep learning in assessing pneumoconiosis depicted on digital chest radiography. Occup. Environ. Med. 2020, 77, 597–602.
- Devnath, L.; Luo, S.; Summons, P.; Wang, D. Performance Comparison of Deep Learning Models for Black Lung Detection on Chest X-ray Radiographs. In Proceedings of the ACM International Conference Proceeding Series; Association for Computing Machinery: New York, NY, USA, 2020; pp. 152–154.
- Devnath, L.; Luo, S.; Summons, P.; Wang, D. An accurate black lung detection using transfer learning based on deep neural networks. In Proceedings of the International Conference Image and Vision Computing New Zealand, Dunedin, New Zealand, 2–4 December 2019.
- Zheng, R.; Deng, K.; Jin, H.; Liu, H.; Zhang, L. An Improved CNN-Based Pneumoconiosis Diagnosis Method on X-ray Chest Film. In Proceedings of the Lecture Notes in Computer Science (Including Subseries Lecture Notes in Artificial Intelligence and Lecture Notes in Bioinformatics), LNCS; Springer: New York, NY, USA, 2019; Volume 11956 LNCS, pp. 647–658.
- Simonyan, K.; Zisserman, A. Very Deep Convolutional Networks for Large-Scale Image Recognition, Published as a Conference Paper at ICLR. 2015. Available online: https://arxiv.org/abs/1409.1556 (accessed on 26 April 2020).
- Krizhevsky, A.; Sutskever, I.; Hinton, G.E. ImageNet Classification with Deep Convolutional Neural Networks. In Proceedings of the Advances in Neural Information Processing Systems 25 (NIPS 2012), Stateline, NV, USA, 3–8 December 2012; pp. 1097–1105.
- Szegedy, C.; Liu, W.; Jia, Y.; Sermanet, P.; Reed, S.; Anguelov, D.; Erhan, D.; Vanhoucke, V.; Rabinovich, A. Going Deeper with Convolutions. In Proceedings of the IEEE Conference on Computer Vision and Pattern Recognition, Boston, MA, USA, 7–12 June 2015; pp. 1–9.
- Chollet, F. Xception: Deep learning with depthwise separable convolutions. In Proceedings of the 2017 IEEE Conference on Computer Vision and Pattern Recognition (CVPR), Honolulu, HI, USA, 21–26 July 2017.
- He, K. Deep Residual Learning for Image Recognition. In Proceedings of the IEEE Conference on Computer Vision and Pattern Recognition, Las Vegas, NV, USA, 27–30 June 2016; pp. 770–778.
- Huang, G.; Liu, Z.; Van der Maaten, L.; Weinberger, K.Q. Densely Connected Convolutional Networks. In Proceedings of the IEEE Conference on Computer Vision and Pattern Recognition, Honolulu, HI, USA, 21–26 July 2017; pp. 4700–4708.
- Rajpurkar, P.; Irvin, J.; Zhu, K.; Yang, B.; Mehta, H.; Duan, T.; Ding, D.; Bagul, A.; Langlotz, C.; Shpanskaya, K.; et al. CheXNet: Radiologist-Level Pneumonia Detection on Chest X-rays with Deep Learning. arXiv 2017, arXiv:1711.05225.
- Lecun, Y.; Bottou, L.; Bengio, Y.; Haffner, P. Gradient-based learning applied to document recognition. Proc. IEEE 1998, 86, 2278–2324.
This entry is offline, you can click here to edit this entry!